. 2020 Sep 23;107(6):1113-1123.e4.
doi: 10.1016/j.neuron.2020.06.028. Epub 2020 Jul 16.

Orchestrating Opiate-Associated Memories in Thalamic Circuits

Affiliations

Orchestrating Opiate-Associated Memories in Thalamic Circuits

Piper C Keyes et al. Neuron. .

Erratum in

Abstract

Disrupting memories that associate environmental cues with drug experiences holds promise for treating addiction, yet accessing the distributed neural network that stores such memories is challenging. Here, we show that the paraventricular nucleus of the thalamus (PVT) orchestrates the acquisition and maintenance of opiate-associated memories via projections to the central nucleus of the amygdala (CeA) and nucleus accumbens (NAc). PVT→CeA activity associates morphine reward to the environment, whereas transient inhibition of the PVT→NAc pathway during retrieval causes enduring protection against opiate-primed relapse. Using brain-wide activity mapping, we revealed distributed network activities that are altered in non-relapsing mice, which enabled us to find that activating the downstream NAc→lateral hypothalamus (LH) pathway also prevents relapse. These findings establish the PVT as a key node in the opiate-associated memory network and demonstrate the potential of targeting the PVT→NAc→LH pathway for treating opioid addiction.

Keywords: central nucleus of amygdala; memory; nucleus accumbens; opiate; paraventricular nucleus of the thalamus; reconsolidation; relapse; withdrawal.


Conflict of interest statement

Declaration of Interests The authors declare no competing interests.

Figures

Figure 1.
Figure 1.. The PVT→CeA pathway mediates morphine reward memory formation.
(A) Experimental timeline for (C) and (D). Red arrows mark local infusion of CNO or saline into the CeA during each morphine paring trial (C) or during retrieval test 2 (D). (B) Schematics of in vivo chemogenetic inhibition of the PVT→CeA pathway. (C) CPP score was reduced by local infusion of CNO into the CeA of hM4D- (Red, N = 8) but not td-Tomato- (light red, N = 6) expressing mice, or local infusion of saline (black, N = 6) into hM4D-expressing mice. One-way ANOVA (F(2,19) = 4.632, P = 0.0034) followed by Dunnett’s multiple comparisons test. **P < 0.01. (D) Local infusion of CNO (red, N = 7) or saline (black, N = 7) into the CeA of hM4D-expressing mice during test 2 had no effect on CPP scores on test 2 and test 3. Two-way ANOVA (main effect of group F(1,12) = 0. 0351, P = 0. 8545; main effect of test F(2,24) = 0. 6666, P = 0. 5227; interaction F(2,24) = 0. 0792, P = 0. 9241) with post-hoc multiple comparisons with Bonferroni corrections. (E) Local infusion of saline (black, N = 8) or CNO (red, N = 6) into the CeA of hM4D-expressing mice had no effect on morphine induced increase of locomotion. Multiple t-test. (F) Local infusion of saline (black, N = 8) or CNO (red, N = 8) into the CeA of hM4D-expressing mice had no effect on chocolate consumption. Paired t-test, two-tailed. (G) Light stimulation of the PVT→CeA pathway during suboptimal morphine CPP training significantly increased the CPP score in ChR2- (blue, N = 9) but not eGFP- (black, N = 7) expressing mice. Unpaired t-test, two-tailed (P = 0.0235). *P < 0.05. (H) Light stimulation of ChR2- (blue, N = 9) and eGFP- (black, N = 7) expressing mice had no effect on locomotion during sub-threshold morphine CPP training. Multiple t-test. Data are presented as mean ± SEM.
Figure 2.
Figure 2.. hM4D-mediated PVT→NAc pathway inhibition prevent retrieval and relapse.
(A) Experimental timeline for (C), (D) and (E). Red arrows mark local infusion of CNO or saline into the NAc during each morphine paring trial (C) or during retrieval test 2 (D). Black arrows mark morphine prime injection. (B) Schematics of in vivo chemogenetic inhibition of the PVT→NAc pathway. (C) Local infusion of saline (black, N = 8) and CNO (red, N = 7) into the NAc of hM4D-expressing mice had no effect on CPP scores. Unpaired two-tailed t-test. (D) CPP score was reduced by local infusion of CNO into the NAc during test 2 of hM4D- (Red, N = 9) but not td-Tomato- (light red, N = 8) expressing mice, or local infusion of saline (black, N = 8) into hM4D-expressing mice. Two-way ANOVA (main effect of group F(2,22) = 8.124, P = 0.0023; main effect of test F(2,44) = 7.005, P = 0.0023; interaction F(2,44) = 4.03, P = 0.0072) with post-hoc multiple comparisons with Bonferroni corrections. *P < 0.05; **P < 0.01; ***P < 0.001. (E) Morphine priming-injection (10 mg/Kg) induces robust relapse of CPP in saline- (black, N = 6) but not CNO- (red, N = 7) infused hM4D-expressing mice. Two-way ANOVA (main effect of group F(1,11) = 18.85, P = 0.0012; main effect of test F(1,11) = 0.0169, P = 0.8989; interaction F(1,11) = 0.3311, P = 0.5766) with post-hoc multiple comparisons with Bonferroni corrections. **P < 0.01; ***P < 0.001. (F) No difference in morphine-primed increased locomotion between saline- (black, N = 6) and CNO- (red, N = 7) infused mice used in (E). Multiple t-test. (G) No difference in CPP scores of mice before (black) and after (red) inhibition of the PVT→NAc pathway in a novel context (N = 8). Paired t-test. Data are presented as mean ± SEM.
Figure 3.
Figure 3.. Optogenetic inhibition of the PVT→NAc pathway prevent retrieval and relapse.
(A) Experimental timeline for (C), (D) and (F). Green arrow marks light stimulation in the NAc during retrieval test 2 (C). Black arrows mark morphine prime injection (D). Red arrows mark local infusion of CNO or saline into the NAc after retrieval test 2 (F). (B) Schematics of in vivo optogenetic inhibition of the PVT→NAc pathway. (C) Light stimulation during test 2 significantly reduced CPP scores for test 2 and test 3 in ArchT- (green, N = 8) but not eGFP- (black, N = 7) expressing mice. Two way ANOVA (main effect of group F(1,45) = 19.22, P < 0.0001; main effect of test F(2,45) = 2.645, P = 0.0821; interaction F(2,45) = 2.312, P = 0.1107) with post-hoc multiple comparisons with Bonferroni corrections. ***P < 0.001, ****P < 0.0001. (D) Morphine priming-injection (10 mg/Kg) induces robust relapse of CPP in eGFP- (black, N = 7) but not ArchT- (green, n = 8) expressing mice. Two-way ANOVA (main effect of group F(1,13) = 23.13, P = 0.0003; main effect of test F(1,13) = 1.245, P = 0.2847; interaction F(1,13) = 3.982, P = 0.0674) with post-hoc multiple comparisons with Bonferroni corrections. ***P < 0.001, ****P < 0.0001. (E) No difference in morphine-primed increased locomotion between eGFP- (black, N = 7) and ArchT- (green, N = 8) expressing mice used in (D). Multiple t-test. (F) No difference in CPP scores of mice before (black) and after (green) inhibiting the PVT→NAc pathway in a novel context. N = 6. Paired t-test, two-tailed. (G) No difference in CPP scores of mice when local infuse saline (black, N = 6) or CNO (red, N = 7) into the NAc after test 2 in the hM4D-expressing mice. Two-way ANOVA (main effect of group F(1,11) = 0.2512, P = 0. 6261; main effect of test F(2,22) = 2.016, P = 0.1571; interaction F(2,22) = 1.267, P = 0.3014) with post-hoc multiple comparisons with Bonferroni corrections. Data are presented as mean ± SEM.
Figure 4.
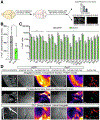
Figure 4.. Whole-brain c-Fos mapping after opioid-primed relapse.
(A) Schematics of iDISCO+ and ClearMap pipeline. (B) Quantification shows significantly more total c-Fos+ cells per hemisphere in eGFP- (black, N = 4) than ArchT- (green, N = 4) expressing mice after test 5. Unpaired t-test (P = 0.0239). *P < 0.05. (C) Quantification of regions of significant difference in c-Fos expression between ArchT- (green) and eGFP- (black) expressing mice. P values are presented in Supplementary Table 1. Abbreviations: Pons, sensory related (Ps), Lateral Hypothalamus (LH), Basolateral Amygdala (BLA), Basomedial Amygdala (BMA), Endopiriform Nucleus (EP), Superior Colliculus, sensory related, Posterior Amygdala (PA), Superior Colliculus, motor related (SCm), Olfactory Areas (OLF), Nucleus of the Brachium of the Inferior Colliculus (NB), Cortical Amygdala (COA), Primary Somatosensory Area, lower limb (SSp-ll), Lateral Amygdala (LA), Midbrain (MB), Claustrum (CLA), Visceral Area, Cortical Subplate (CTXsp), Primary Somatosensory Area, unassigned (SSp-un), Primary Somatosensory Area, mouth (SSp-m), Retrohippocampal Region (RHP), Lateral Septal Complex (LSX), Prosubiculum (ProS), Pons, motor related (Pm), Piriform Area (PIR), Intercalated Amygdala (IA), Piriform-amygdalar Area (PAA), Periaqueductal Gray (PAG), Retrosplenial Cortex (RSP), Field CA1 (CA1), Dorsal Striatum (DS). Multiple t-tests. *P < 0.05, **P < 0.01. (D) Voxel-based statistics on c-Fos density heat maps. Left panels: reference annotation of regions of interest based on Allen Brain Atlas. Second and fourth panels from the left: 30 μm projections of representative raw c-Fos immunostaining data from eGFP- and ArchT- expressing mice. Third and fifth panels from the left: Mean c-Fos density heat maps. Right panels: P-value maps. Red and green voxels indicate a significant decrease and increase, respectively, when comparing the ArchT- to the eGFP- expressing mice. Note green voxels in the PAG. Scale bars, 500 μm. Data are presented as mean ± SEM.
Figure 5.
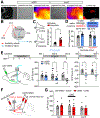
Figure 5.. PVT→NAc→LH pathway mediates morphine memory retrieval and maintenance.
(A) Voxel-based statistics on LH. Scale bars, 500 μm. (B) Schematic of feedforward inhibition from the PVT onto the NAc→LH pathway via D2-MSNs. (C) Representative traces (left) and quantification (right) shows increase of IPSC/EPSC ratios in NAcLH neurons after morphine (red, N = 11 cells) but not saline (black, N = 10 cells) treatment. Scale bars, 200 pA, 40 ms. Unpaired t-test. **P < 0.01. (D) Top panels, example of current injection induced AP traces of NAcLH neurons from saline (black) and morphine (red) treated mice, with and without 20 Hz photostimulation (blue background). Scale bars, 40 mV, 100 ms. Bottom panel, Quantification of AP frequency. Photoactivation of PVT inputs increases AP firing in the saline (left, N = 8 cells) but decrease AP firing in the morphine (right, N = 10 cells) treated mice. Multiple t-test with Bonferroni correction. *P < 0.05. (E) Experimental timeline (upper panel), schematic (lower panel, left), and quantification of NAc→LH optogenetic activation during morphine CPP retrieval (lower panel, middle) and drug-primed relapse (lower panel, right). Light stimulation in ChR2- (blue, test 1–3, N = 9; test 4–5, N = 6) but not eGFP- (black, test 1–3, N = 8; test 4–5, N =6) expressing mice blocks the retrieval (test 2, test 3) and relapse (test 4, test 5). Two-way ANOVAs (test 1–3: main effect of group F(1,15) = 10.51, P = 0.0036; main effect of test F(2,30) = 2.092, P = 0.0665; interaction F(2,30) = 2.855, P = 0.0346; test 4–5: main effect of group F(1,10) = 10.48, P = 0.0089; main effect of test F(1,10) = 0.0009, P = 0.9764; interaction F(1,20) = 0.0449, P = 0.8364). *P < 0.05, **P < 0.01. (F) Experimental design for inhibiting the PVT→NAc and NAc→LH pathways simultaneously. AAV8-hM4D was injected into the PVT, rAAV2-retro-cre was injected into the LH, and AAV9-DIO-hM4D was injected into the NAc. Cannulas were implanted into the NAc. Local infusion of CNO can inhibit both hM4D expressing terminals of PVT inputs and the cell body of NAcLH neurons. (G) Histogram shows similar CPP score between local infusion of saline (gray, N = 6) or CNO (red, N = 6) during test 2 and the following test 3. Data are presented as mean ± SEM.

Comment in

References

    1. Alexander GM, Rogan SC, Abbas AI, Armbruster BN, Pei Y, Allen JA, Nonneman RJ, Hartmann J, Moy SS, Nicolelis MA, et al. (2009). Remote control of neuronal activity in transgenic mice expressing evolved G protein-coupled receptors. Neuron 63, 27–39. - PMC - PubMed
    1. Armbruster BN, Li X, Pausch MH, Herlitze S, and Roth BL (2007). Evolving the lock to fit the key to create a family of G protein-coupled receptors potently activated by an inert ligand. Proc Natl Acad Sci U S A 104, 5163–5168. - PMC - PubMed
    1. Bossert JM, Marchant NJ, Calu DJ, and Shaham Y (2013). The reinstatement model of drug relapse: recent neurobiological findings, emerging research topics, and translational research. Psychopharmacology (Berl) 229, 453–476. - PMC - PubMed
    1. Boyden ES, Zhang F, Bamberg E, Nagel G, and Deisseroth K (2005). Millisecond-timescale, genetically targeted optical control of neural activity. Nat Neurosci 8, 1263–1268. - PubMed
    1. Chen TW, Wardill TJ, Sun Y, Pulver SR, Renninger SL, Baohan A, Schreiter ER, Kerr RA, Orger MB, Jayaraman V, et al. (2013). Ultrasensitive fluorescent proteins for imaging neuronal activity. Nature 499, 295–300. - PMC - PubMed

Publication types