. 2020 Aug 11;15(2):389-407.
doi: 10.1016/j.stemcr.2020.06.017. Epub 2020 Jul 16.

Intestinal Stem Cell Niche Defects Result in Impaired 3D Organoid Formation in Mouse Models of Crohn's Disease-like Ileitis

Affiliations

Intestinal Stem Cell Niche Defects Result in Impaired 3D Organoid Formation in Mouse Models of Crohn's Disease-like Ileitis

Ludovica F Buttó et al. Stem Cell Reports. .

Abstract

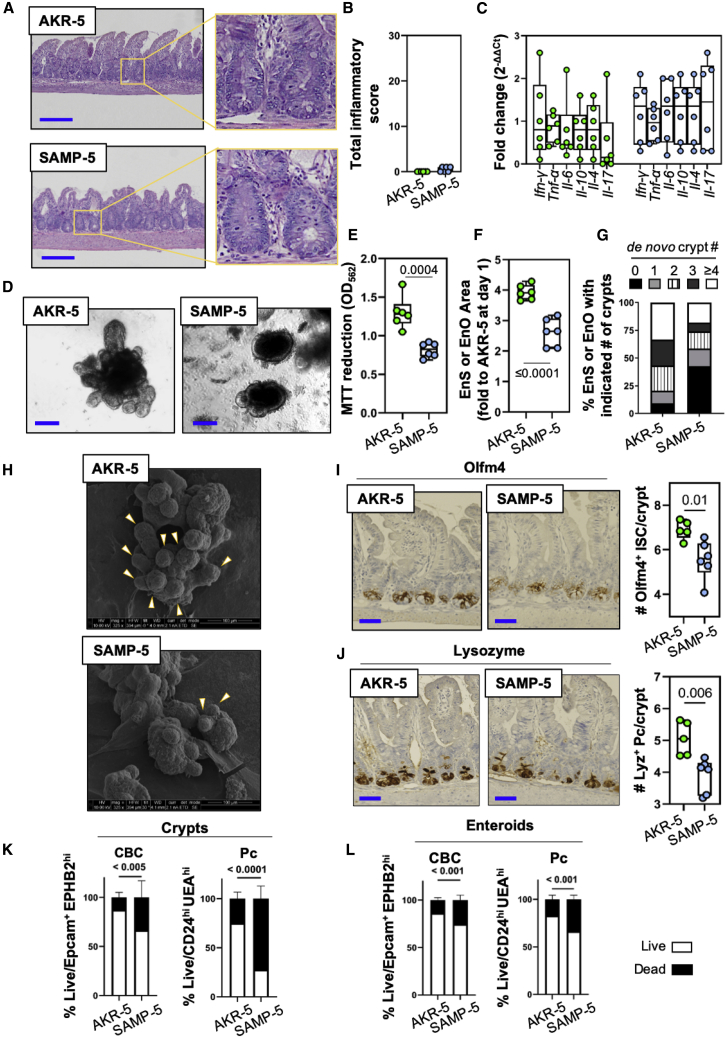
Intestinal epithelial barrier dysfunction is a risk factor in the pathogenesis of Crohn's disease (CD); however, no corrective FDA-approved therapies exist. We used an enteroid (EnO)-based system in two murine models of experimental CD, SAMP1/YitFc (SAMP) and TNFΔARE/+ (TNF). While severely inflamed SAMP mice do not generate EnOs, "inflammation-free" SAMP mice form EnO structures with impaired morphology and reduced intestinal stem cell (ISC) and Paneth cell viability. We validated these findings in TNF mice concluding that inflammation in intestinal tissues impedes EnO generation and suppressing inflammation by steroid administration partially rescues impaired formation in SAMP mice. We generated the first high-resolution transcriptional profile of the SAMP ISC niche demonstrating that alterations in multiple key pathways contribute to niche defect and targeting them may partially rescue the phenotype. Furthermore, we correlated the defects in formation and the rescue of EnO formation to reduced viability of ISCs and Paneth cells.

Keywords: Crohn’s disease; Paneth cells; RNAseq; SAMP1/YitFc; TNF(ΔARE); enteroids; epithelial barrier defect; intestinal stem cell niche; organoids; stem cells.


Figures

None
Graphical abstract
Figure 1
Figure 1
Defective EnO Formation in Intestinal Inflammation-free SAMP Mice Data, indicated as mean ± SD, correspond to three independent experiments (n = 2 mice/group/experiment). (A) Representative photomicrographs of ileal sections of 5-week-old AKR (AKR-5) and SAMP (SAMP-5) mice. Scale bars, 200 μm. Zoomed images are at 20× magnification. (B) Total inflammatory score of ileal tissue from AKR-5 (0.0 ± 0.0) and SAMP-5 (0.5 ± 0.5). (C–F) (C) Relative expression of indicated cytokine mRNA measured in total tissue RNA extracted from 5-week-old SAMP and AKR ilea. The mRNA levels were determined by qRT-PCR, normalized to β-actin and expressed as fold change (2−ΔΔCt). Small intestinal EnSs and EnOs (D) growth, (E) viability, and (F) size from AKR-5 and SAMP-5 mice after 6 days in culture. Scale bars, 100 μm. (G) Quantification of de novo crypt formation at day 6 in EnOs from AKR-5 and SAMP-5 mice. (H) Scanning electron micrographs of EnOs from AKR-5 and SAMP-5 mice at day 6 in culture. Arrows indicate de novo crypts. Note the higher number of de novo crypts in EnOs from AKR-5 compared with those from SAMP-5. (I–L) (I) OLFM4 and (J) LYSOZYME staining of AKR-5 and SAMP-5 small intestinal crypts. Scale bars, 50 μm. Frequency of live and dead crypt base columnar (CBC) stem cells (Epcam+ Ephb2hi/CD44hiGRP78low/CD166+ CD24med/CD31CD45) and Paneth cells (CD24hiUEA+/CD31CD45) isolated from (K) crypts and (L) EnOs of 5-week-old SAMP and AKR mice.
Figure 2
Figure 2
Crypts from Inflamed SAMP Mice do Not Form EnSs and EnOs Data, indicated as mean ± SD, correspond to three independent experiments (n = 1–2 mice/group/experiment). (A) Representative photomicrographs of ileal sections of 25-week-old AKR (AKR-25) and SAMP (SAMP-25) mice. Scale bars, 200 μm. Zoomed images are at 20× magnification. (B) Total inflammatory score of ileal tissue from AKR-25 (0.0 ± 0.0) and SAMP-25 (19.8 ± 2.9) mice. (C–F) (C) Relative expression of indicated cytokine mRNA measured in total tissue RNA extracted from AKR-25 and SAMP-25 ilea. The mRNA levels were determined by qRT-PCR, normalized to β-actin and expressed as fold change (2−ΔΔCt). Small intestinal EnSs and EnOs (D) growth, (E) viability, and (F) size from AKR-25 and SAMP-25 mice after 6 days in culture. Scale bars, 100 μm. (G) Quantification of de novo crypt formation at day 6 in EnOs from AKR-25 and SAMP-25 mice. (H and I) (H) OLFM4 and (I) LYSOZYME staining of AKR-25 and SAMP-25 small intestinal crypts. Scale bars, 50 μm. (J) Frequency of live and dead CBC stem cells (Epcam+ Ephb2hi/CD44hiGRP78low/CD166+ CD24med/CD31CD45) and Paneth cells (CD24hiUEA+/CD31CD45) isolated from ileal crypts of 25-week-old SAMP and AKR mice.
Figure 3
Figure 3
Characterization of Mucosal Gene Expression and Functional Categorization Enrichment of Differentially Expressed Genes in the Ileal ISC Niche of SAMP Mice Data, indicated as mean ± SD, correspond to three independent experiments (n = 1 mouse/group/experiment). (A) Total inflammatory score of ileal tissue from AKR-5 (0.0 ± 0.0), SAMP-5 (0.5 ± 0.5), and SAMP-25 (19.8 ± 2.9) mice. (B) Pie chart indicating differentially expressed genes (DEGs) in the three groups. (C–E) (C) Heatmap and hierarchical tree comparing differences in gene expression of the top 1,000 DEGs in ISC niche of inflamed SAMP-25 and of inflammation-free (SAMP-5 and AKR-25) mice. Expression values are log2-transformed median-centered fragments per kilobase of transcript per million reads mapped. Red and blue colors represent increased and decreased gene expression compared with ISC niche from inflammation-free mice, respectively. We used a 5% false discovery rate (FDR-adjusted q ≤ 0.05) as the criteria for defining DEGs. Heatmap and hierarchical clustering of shared normalized enrichment scores from GSEA analysis performed on DEGs using (D) Hallmark (MSigDB H) and (E) curated and GO (MSigDB C2C5) signature gene sets in the ISC niche of SAMP-25 versus AKR-25 and SAMP-5 mice, respectively.
Figure 4
Figure 4
Wnt3a-Conditioned Medium Partially Rescues EnO Size from SAMP-5 Crypts but Not Dysregulated Molecular Signature Data, indicated as mean ± SD, correspond to four independent experiments (n = 1 mouse/group/experiment). (A–E) (A and B) Growth, (C) viability, (D) number, and (E) morphology, quantification of de novo crypt formation of 6-day-old EnOs from 5-week-old AKR and SAMP mice cultured in Intesticult (IC) and in Wnt3a-conditioned medium (Wnt3a-CM). Scale bars, 100 μm. (F) Protein levels of indicated cytokines in AKR-5 and SAMP-5 EnOs cultures in IC or Wnt3a-CM medium. EnOs were passaged twice retaining the observed phenotype.
Figure 5
Figure 5
Dexamethasone Treatment Partially Rescues EnO Formation in Inflamed SAMP Mice Data, indicated as mean ± SD, correspond to three independent experiments (n = 1–2 mice/group/experiment). (A) Representative photomicrographs of ileal sections of 25-week-old dexamethasone-treated SAMP (SAMPDex-25), SAMP (SAMP-25), and AKR (AKR-25) mice. Scale bars, 200 μm. Zoomed images are at 20× magnification. (B) Total inflammatory score of ileal tissue from SAMPDex-25 (4.8 ± 1.5), SAMP-25 (19.9 ± 2.6), and AKR-25 (0 ± 0) mice. (C) Relative expression of indicated cytokine mRNA measured in total tissue RNA extracted from SAMPDex-25, SAMP-25, and AKR-25 ilea. The mRNA levels were determined by qRT-PCR, normalized to β-actin and expressed as fold change (2−ΔΔCt). (D–F) (D) Growth, (E) viability, (F) size, and de novo crypt quantification of small intestinal 6-day-old EnO from SAMPDex-25, SAMP-5, and AKR-5 mice. Scale bars, 100 μm. (G) De novo crypt quantification of small intestinal 6-day-old EnO from AKR-25, SAMP-25, and SAMPDex-25 mice. Scale bars, 100 μm. (H–L) (H) OLFM4 and (I) LYSOZYME staining of AKR-25, SAMP-25, and SAMPDex-25 small intestinal crypts. Scale bars, 50 μm. Frequency of live and dead CBC stem cells (Epcam+ Ephb2hi/CD44hiGRP78low/CD166+ CD24med/CD31CD45) and Paneth cells (CD24hiUEA+/CD31CD45) isolated from (J) crypts and (K) EnOs of AKR-25, SAMP-25, and SAMPDex-25 mice. Relative expression of indicated genes measured in (L) total tissue or in (M) EnOs. The mRNA levels were determined by qRT-PCR, normalized to β-actin and expressed as fold change (2−ΔΔCt).
Figure 6
Figure 6
Crypts from the Distal Ileum of Low-Grade Inflamed TNF Mice Form Rudimentary EnOs Data are indicated as mean ± SD. The distal parts of the ileum of three TNF-5 mice were pooled together and two independent experiment were carried out. Whereas, two mice/group were used to generate TNFp-5 and BL-5 data, in three independent experiments. (A) Representative photomicrographs of ileal sections from 5-week-old C57BL/6 (BL-5) and of the distal ileum (TNFd-5) and proximal small intestine (TNFp-5) from 5-week-old TNF mice. Scale bars, 200 μm. Zoomed images are at 20× magnification. (B) Total inflammatory score of ileal tissue from BL-5 (0.0 ± 0.0), TNFd-5 (4.3 ± 1.4), and TNFp-5 (0.3 ± 0.5) mice. (C) Relative expression of Tnf-α mRNA measured in total tissue RNA extracted from TNFd-5, TNFp-5 ilea, and from the distal and proximal portion of the ileum of BL-5 mice (BLd-5 and BLp-5, respectively). The mRNA levels were determined by qRT-PCR, normalized to β-actin and expressed as fold change (2−ΔΔCt). (D–G) (D) Growth, (E) viability, (F) size, and (G) de novo crypt quantification of small intestinal 6-day-old EnO from TNFd-5, TNFp-5, and BL-5 mice. Scale bars, 100 μm. (H and I) (H) OLFM4 and (I) LYSOZYME staining of BL-5 and TNFd-5 small intestinal crypts. Scale bars, 50 μm. Frequency of live and dead CBC stem cells (Epcam+ Ephb2hi/CD44hiGRP78low/CD166+ CD24med/CD31CD45) and Paneth cells (CD24hiUEA+/CD31CD45) isolated from (J) crypts and (K) EnOs of BL-5 and TNFd-5 mice.
Figure 7
Figure 7
Crypts from the Distal Ileum of Highly Inflamed TNF Mice do Not Form EnSs Data are indicated as mean ± SD. The distal parts of the ileum of three TNF-25 mice were pooled together and two independent experiment were carried out. Whereas, two mice/group were used to generate TNFp-25 and BL-25 data in three independent experiments. (A) Representative photomicrographs of ileal sections from 25-week-old C57BL/6 (BL-25) and of the ileum (TNFd-25) and proximal small intestine (TNFp-25) from 25-week-old TNF mice. Scale bars, 200 μm. Zoomed images are at 20× magnification. (B) Total histologic score of ileal tissue from BL-25 (0.0 ± 0.0), TNFd-25 (26.8 ± 5.8), and TNFp-25 (1.7 ± 1.4) mice. (C) Segmental differential expression of Tnf mRNA between the distal and proximal ileum of TNF-25 and BL-25 mice, with 7-fold higher expression of Tnf in the distal ileum (tissue at 3 cm from the distal part of the ileum versus that at 10 cm). The mRNA levels were determined by qRT-PCR, normalized to β-actin and expressed as fold change (2−ΔΔCt). (D–G) (D) Growth, (E) viability, (F) size, and (G) de novo crypt quantification of small intestinal 6-day-old EnO from TNFd-25, TNFp-25, and BL-25 mice. Scale bars, 100 μm. (H–J) (H) OLFM4 and (I) LYSOZYME staining of BL-25 and TNFd-25 small intestinal crypts. Scale bars, 50 μm. (J) Frequency of live and dead CBC stem cells (Epcam+ Ephb2hi/CD44hiGRP78low/CD166+ CD24med/CD31CD45) and Paneth cells (CD24hiUEA+/CD31CD45) isolated from crypts of BL-25 and TNFd-25 mice.

Similar articles

Cited by

References

    1. Alkim C., Alkim H., Koksal A.R., Boga S., Sen I. Angiogenesis in inflammatory bowel disease. Int. J. Inflam. 2015;2015:970890. - PMC - PubMed
    1. Barnes P.J. Glucocorticosteroids. Handb. Exp. Pharmacol. 2017;237:93–115. - PubMed
    1. Baumgart D.C., Sandborn W.J. Crohn's disease. Lancet. 2012;380:1590–1605. - PubMed
    1. Baur P., Martin F.P., Gruber L., Bosco N., Brahmbhatt V., Collino S., Guy P., Montoliu I., Rozman J., Klingenspor M. Metabolic phenotyping of the Crohn's disease-like IBD etiopathology in the TNF(DeltaARE/WT) mouse model. J. Proteome Res. 2011;10:5523–5535. - PubMed
    1. Biton M., Haber A.L., Rogel N., Burgin G., Beyaz S., Schnell A., Ashenberg O., Su C.W., Smillie C., Shekhar K. T helper cell cytokines modulate intestinal stem cell renewal and differentiation. Cell. 2018;175:1307–1320.e22. - PMC - PubMed

Publication types

MeSH terms