. 2020 Aug 10;38(2):279-296.e9.
doi: 10.1016/j.ccell.2020.06.005. Epub 2020 Jul 16.

Tumor Microenvironment-Derived NRG1 Promotes Antiandrogen Resistance in Prostate Cancer

Affiliations

Tumor Microenvironment-Derived NRG1 Promotes Antiandrogen Resistance in Prostate Cancer

Zeda Zhang et al. Cancer Cell. .

Abstract

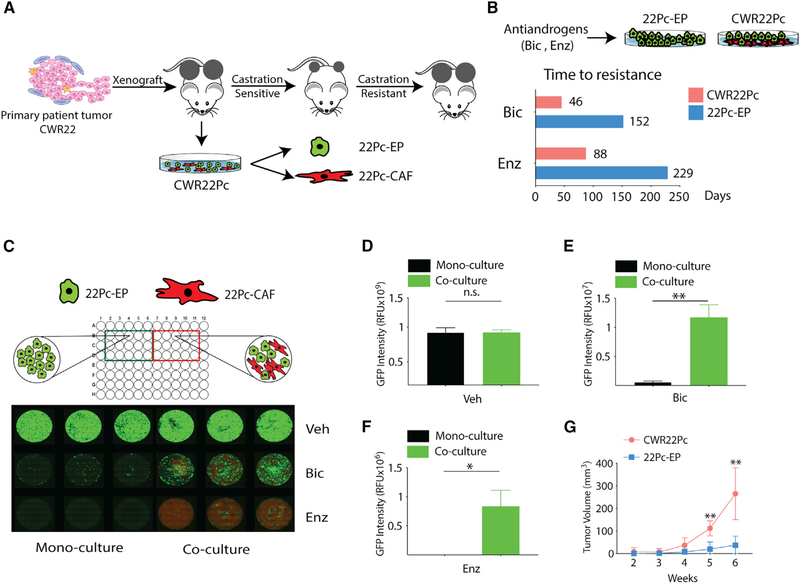
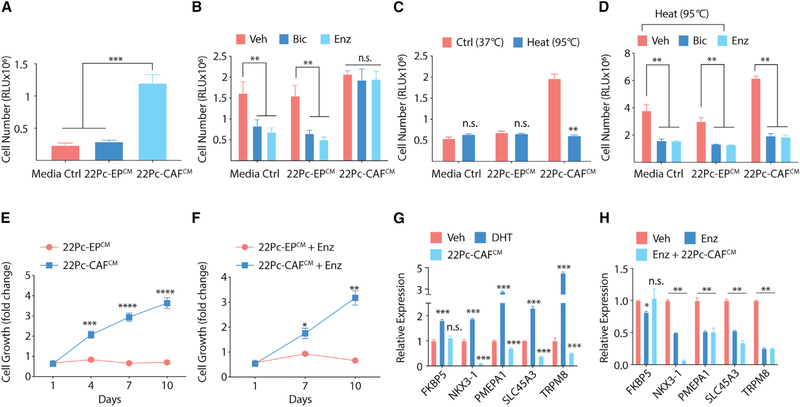
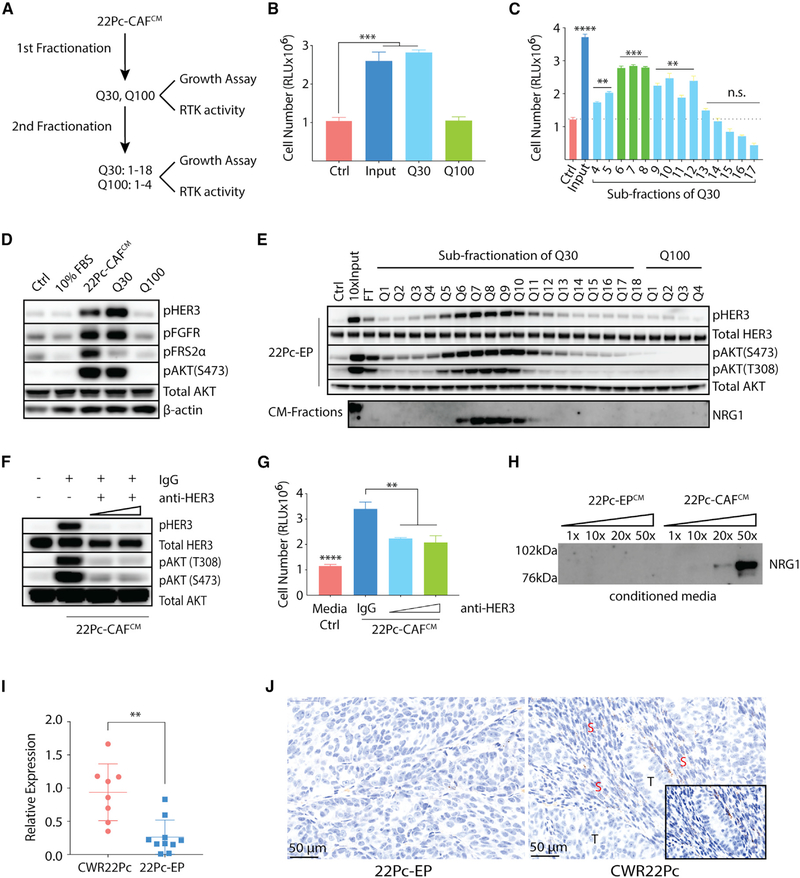
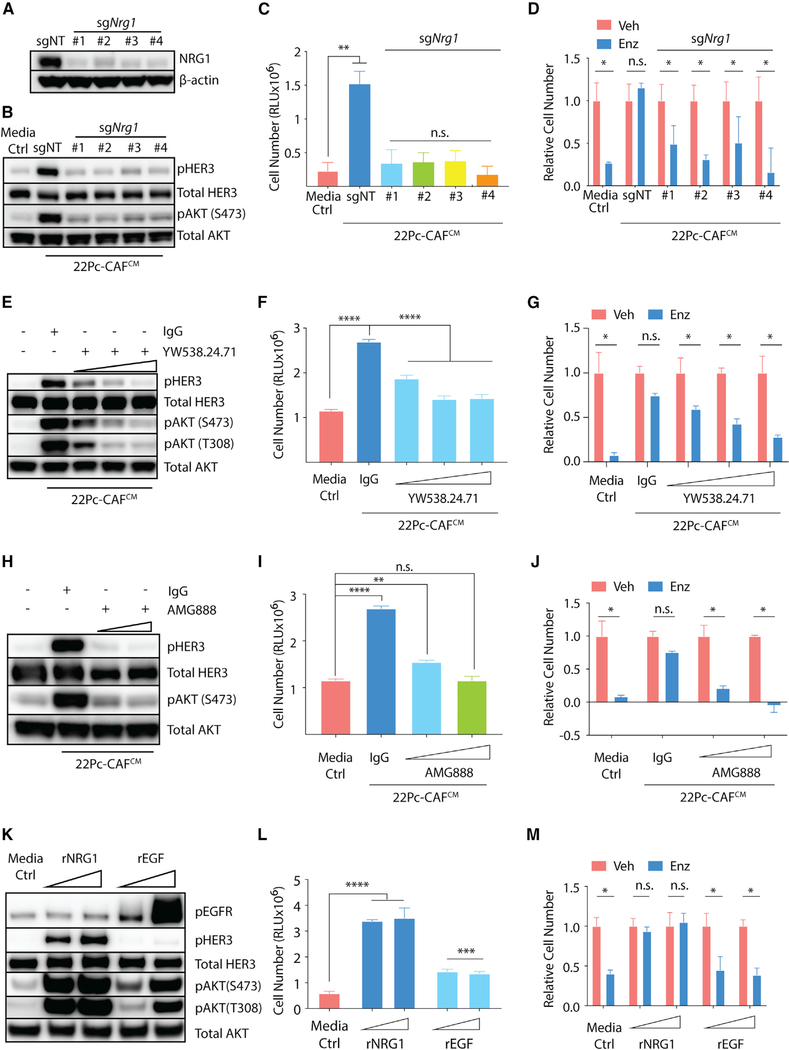
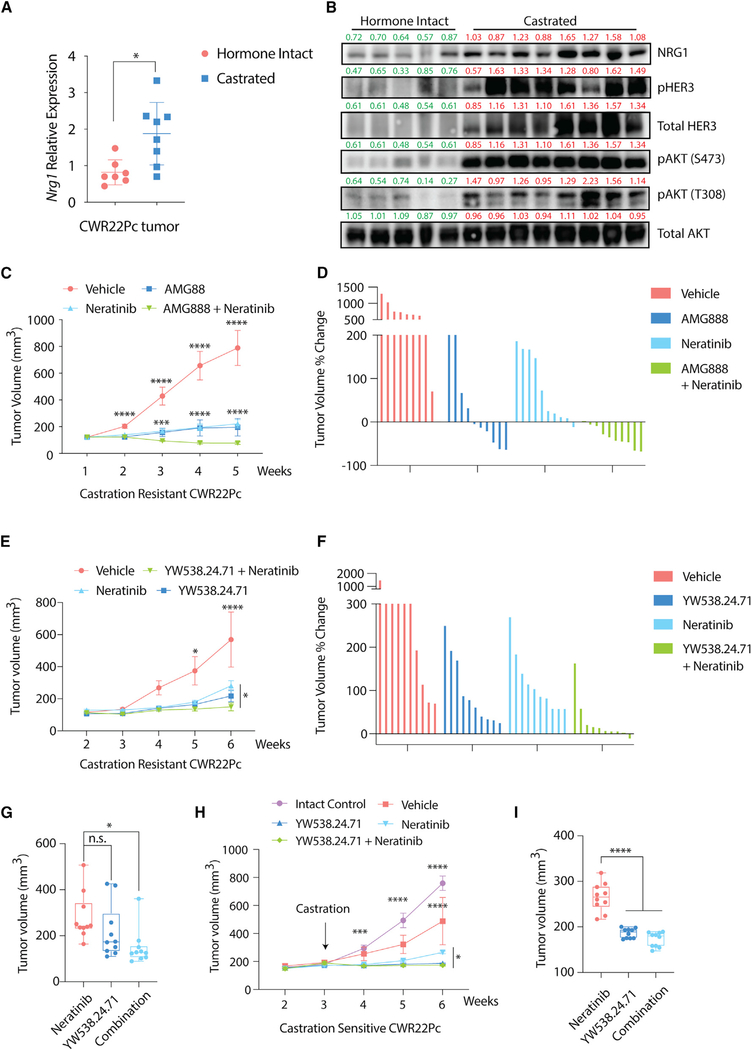
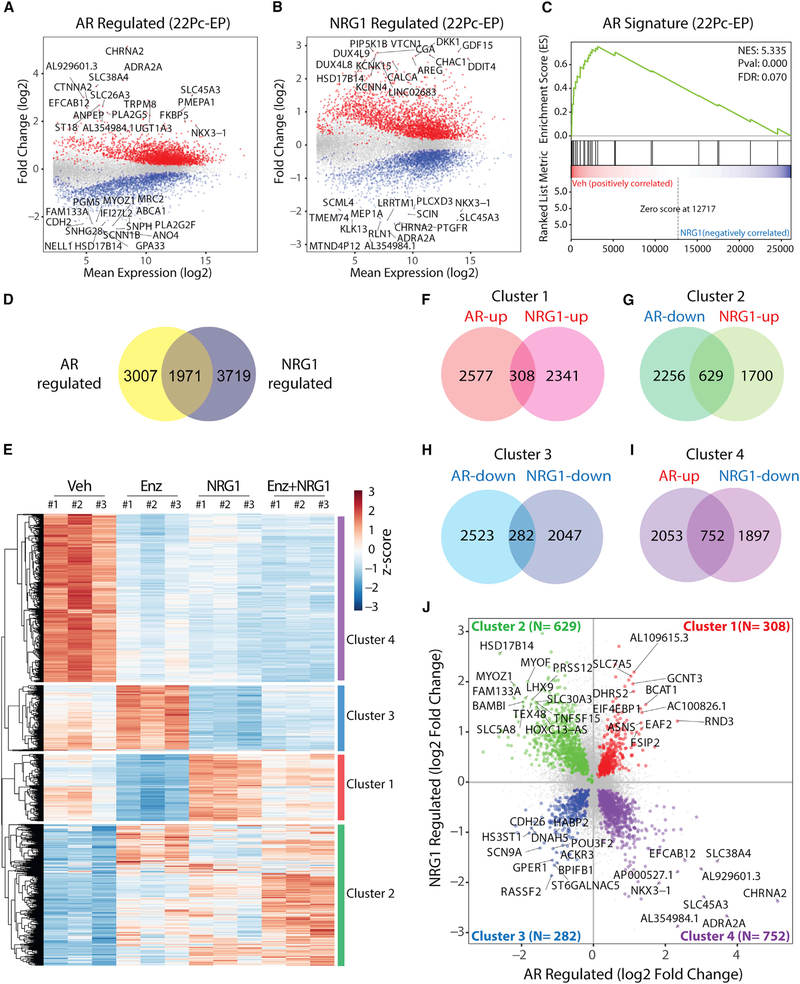
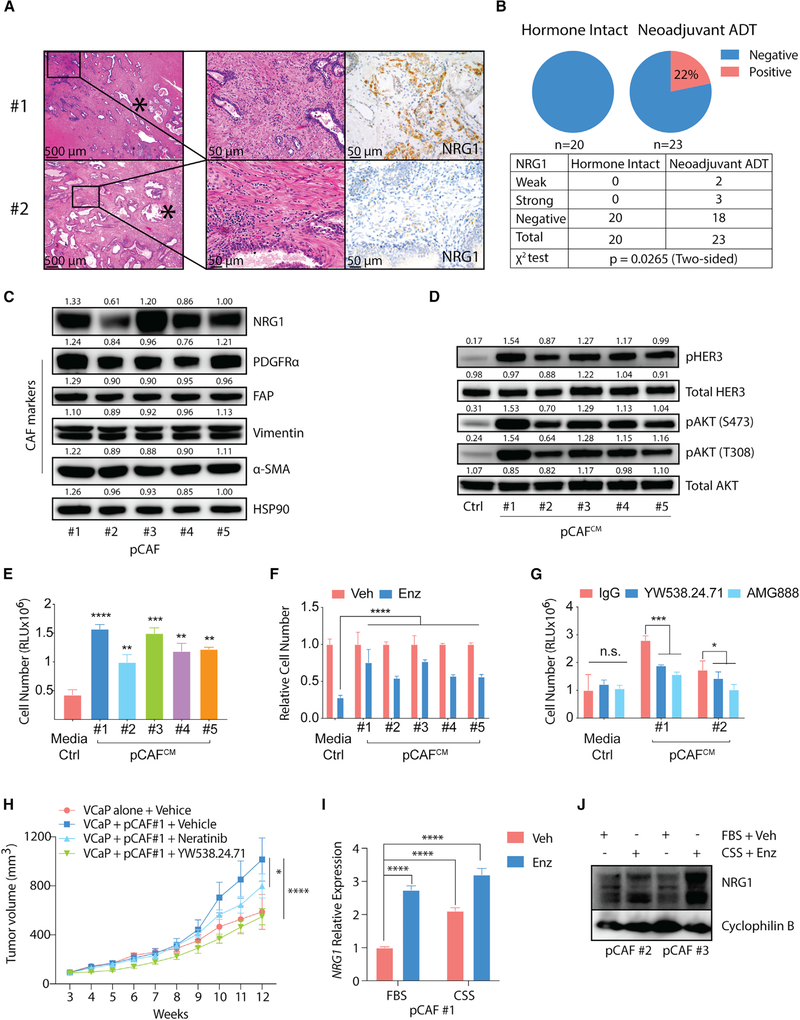
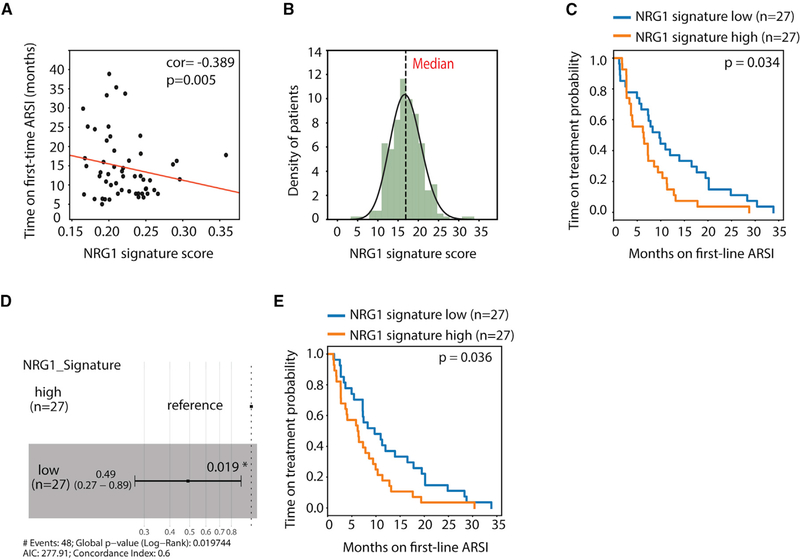
Despite the development of second-generation antiandrogens, acquired resistance to hormone therapy remains a major challenge in treating advanced prostate cancer. We find that cancer-associated fibroblasts (CAFs) can promote antiandrogen resistance in mouse models and in prostate organoid cultures. We identify neuregulin 1 (NRG1) in CAF supernatant, which promotes resistance in tumor cells through activation of HER3. Pharmacological blockade of the NRG1/HER3 axis using clinical-grade blocking antibodies re-sensitizes tumors to hormone deprivation in vitro and in vivo. Furthermore, patients with castration-resistant prostate cancer with increased tumor NRG1 activity have an inferior response to second-generation antiandrogen therapy. This work reveals a paracrine mechanism of antiandrogen resistance in prostate cancer amenable to clinical testing using available targeted therapies.

Keywords: NRG1/neuregulin 1; cancer-associated fibroblast; drug resistance; hormone therapy; tumor microenvironment.


Conflict of interest statement

Declaration of Interests C.L.S. and J.W. are co-inventors of enzalutamide and apalutamide and may be entitled to royalties. C.L.S. serves on the Board of Directors of Novartis and is a co-founder of ORIC Pharmaceuticals. He is a science advisor to Agios, Beigene, Blueprint, Column Group, Foghorn, Housey Pharma, Nextech, KSQ, Petra, and PMV. W.A. reports consulting for Clovis Oncology, Janssen, MORE Health, and ORIC Pharmaceuticals, and received honoraria from CARET and travel accommodations from GlaxoSmith Kline, Clovis Oncology, and ORIC Pharmaceuticals. D.E.R. reports having consulting or advisory role (uncompensated) from Genentech/Roche, Janssen Oncology, and TRACON Pharma, and received research funding from: AstraZeneca (Inst); Celgene (Inst); Ferring (Inst); Genentech/Roche (Inst); Janssen Oncology (Inst); Medivation/Astellas/Pfizer (Inst); Millennium (Inst); Novartis (Inst); Taiho Pharmaceutical (Inst); Takeda (Inst); TRACON Pharma (Inst). W.R.K. is a coinventor on patent WO2012168930A2 filed by Koninklijke Nederlandse Akademie Van Wetenschappen that covers organoid technology.

Figures

Figure 1.
Figure 1.. Cancer-Associated Fibroblasts Promote Antiandrogen Resistance in an Androgen-Dependent PCa Model
(A) Schematic diagram depicting the origin and characteristics of the CWR22Pc model (Dagvadorj et al., 2008). CWR22Pc contains both murine cancer-associated fibroblasts (22Pc-CAF) and human cancer cells (22Pc-EP), as described previously (Mu et al., 2017). (B) Bar graph showing time to development of resistance to Bic (10 μM) or Enz (1 μM) in CWR22Pc and 22Pc-EP. (C) Top: cartoon showing 22Pc-EPeGFP + 22Pc-CAFtdTomato co-culture or 22Pc-EPeGFP mono-culture. Bottom: fluorescent images of co-culture assay showing number of 22Pc-EPeGFP cells (green) and 22Pc-CAFtdTomato cells (red) in the presence of Bic (10 μM), Enz (1 μM), or vehicle (Veh, DMSO) on day 30 (n = 3). (D–F) Quantification of eGFP fluorescence signal intensity from (C) using relative fluorescence units (RFU) in three experimental conditions: Veh (D), Bic (E), or Enz (F) (**p < 0.01, *p < 0.05; n.s., not significant. Student’s t test). (G) Growth of CWR22Pc or 22Pc-EP tumor xenografts in castrated mice (n = 5 mice per group, **p < 0.01, multiple t test). Data are represented as mean ± SD (D–F), or mean ± SEM (G). See also Figure S1.
Figure 2.
Figure 2.. CAF-Secreted Factors Promote Antiandrogen Resistance
(A) Growth of 22Pc-EP cells in CSS media supplemented with either conditioned media from 22Pc-EP (hereafter, 22Pc-EPCM) or from 22Pc-CAF (hereafter, 22Pc-CAFCM) assessed by CellTiter-Glo on day 4 using relative luminescence unit (RLU). Media Ctrl, serum-free media. (B) Growth of 22Pc-EP cells in FBS media supplemented with either 22Pc-EPCM or 22Pc-CAFCM treated with Veh (DMSO), Bic (10 μM), or Enz (0.1 μM). CellTiter-Glo reading on day 7. Media Ctrl, serum-free media. (C) Growth of 22Pc-EP cells in CSS media supplemented with either control or heat-inactivated 22Pc-EPCM or 22Pc-CAFCM. CellTiter-Glo reading on day 4. Media Ctrl, serum-free media. (D) Growth of 22Pc-EP cells in FBS media supplemented with heat-inactivated 22Pc-EPCM or 22Pc-CAFCM treated with Veh (DMSO), Bic (10 μM), or Enz (0.1 μM). CellTiter-Glo reading on day 7. Media Ctrl, serum-free media. (E) Growth curve of 22Pc-EP cells in CSS media supplemented with 22Pc-EPCM or 22Pc-CAFCM. CellTiter-Glo reading on days 1, 4, 7, and 10. (F) Growth curve of 22Pc-EP cells in FBS media supplemented with 22Pc-EPCM or 22Pc-CAFCM treated with Enz (0.1 μM). CellTiter-Glo reading on day 1, 7, and 10. (G) qRT-PCR analysis of AR target genes in 22Pc-EP cells in CSS media treated with Veh (DMSO), DHT (1 nM), or 22Pc-CAFCM for 24 h (normalized to ACTB). (H) qRT-PCR analysis of AR target genes in 22Pc-EP cells in FBS media treated with Veh (DMSO), Enz (0.1 μM), or Enz +22Pc-CAFCM for 24 h (normalized to ACTB). Assays were performed with three biological replicates. ****p < 0.0001, ***p < 0.001, **p < 0.01, *p < 0.05; n.s., not significant. (A–D) One-way ANOVA, (E–F) multiple t test with false discovery rate of 1%, (G–H) Student’s t test. Data are represented as mean ± SD. See also Figure S2.
Figure 3.
Figure 3.. Biochemical Fractionation of CAF-Secreted Resistance Activity Implicates NRG1
(A) Schematic diagram showing fraction purification and resistance activity in 22Pc-CAFCM. (B) Growth of 22Pc-EP cells in CSS media supplemented with purified fractions from input (22Pc-CAFCM), Q30, or Q100. CellTiter-Glo reading on day 4. Ctrl, PBS. (C) Growth of 22Pc-EP cells in CSS media supplemented with sub-purified fractions (Q3–Q17) from Q30. CellTiter-Glo reading on day 4. Input, Q30; Ctrl, PBS. (D) Western blot analysis of HER3 and FGFR activation in 22Pc-EP after stimulation with FBS media, 22Pc-CAFCM, Q30 or Q100. Ctrl, PBS. β-Actin serves as loading control. (E) Western blot analysis of HER3-AKT activation in 22Pc-EP after stimulation with different Q fractions and analysis of secreted NRG1 in corresponding fractions. Ctrl, PBS; Input, Q30; FT, flow through. Total AKT serves as loading control. (F) Western blot analysis of HER3-AKT activation in 22Pc-EP after stimulation with 22Pc-CAFCM in the presence of a commercial HER3-blocking antibody (10 or 30 μg/mL) or immunoglobulin G (IgG) (30 μg/mL). Total AKT serves as loading control. (G) Growth of 22Pc-EP cells in CSS media supplemented with 22Pc-CAFCM treated with a commercial HER3-blocking antibody (10 or 30 μg/mL) or IgG (30 μg/mL). CellTiter-Glo reading on day 4. Media Ctrl, serum-free media. (H) Western blot analysis of NRG1 from 22Pc-EPCM or 22Pc-CAFCM (concentrated 1×, 10×, 20×, or 50×). (I) qRT-PCR analysis of Nrg1 expression in CWR22Pc (n = 8) or 22Pc-EP (n = 10) tumor xenografts using mouse-specific primers. (J) Representative images showing RNA in situ hybridization (ISH) analysis of mouse Nrg1 expression in CWR22Pc or 22Pc-EP tumor xenografts. T, tumor; S, stroma; mouse-specific Nrg1 probe, brown dots. Assays were performed with three biological replicates. ****p < 0.0001, ***p < 0.001, **p < 0.01, *p < 0.05; n.s., not significant. (B and C) One-way ANOVA compared with Ctrl group, (G and I) Student’s t test. Data are represented as mean ± SD. See also Figure S3.
Figure 4.
Figure 4.. NRG1 Promotes Antiandrogen Resistance in Androgen-Dependent PCa Models
(A) Western blot analysis of NRG1 expression in 22Pc-CAF in which Nrg1 was deleted using CRISPR/Cas9. sgNT, non-targeting guide control; sgNrg1 (no. 1–4), four independent guides targeting Nrg1. β-Actin serves as loading control. (B) Western blot analysis of HER3-AKT activation in 22Pc-EP after stimulation with either sgNT- or sgNrg1-22Pc-CAFCM. Total AKT serves as loading control. (C) Growth of 22Pc-EP cells in CSS media supplemented with either sgNT- or sgNrg1-22Pc-CAFCM. CellTiter-Glo reading on day 4. Media Ctrl, serum-free media. (D) Growth of 22Pc-EP cells in FBS media supplemented with either sgNT- or sgNrg1-22Pc-CAFCM treated with Enz (0.1 μM) or Veh (DMSO). The Enz group was normalized to the Veh group. CellTiter-Glo reading on day 7. Media Ctrl, serum-free media. (E) Western blot analysis of HER3-AKT activation in 22Pc-EP cells after stimulation with 22Pc-CAFCM in the presence of either NRG1 neutralizing antibody YW538.24.71 (1, 10, or 100 μg/mL) or IgG (100 μg/mL). Total AKT serves as loading control. (F) Growth of 22Pc-EP cells in CSS media supplemented with 22Pc-CAFCM treated with YW538.24.71 (1, 10, or 20 μg/mL) or IgG (20 μg/mL). CellTiter-Glo reading on day 4. Media Ctrl, serum-free media. (G) Growth of 22Pc-EP cells in Enz (0.1 μM) or Veh (DMSO) containing FBS media supplemented with 22Pc-CAFCM treated with YW538.24.71 (1, 10, or 20 μg/mL) or IgG (20 μg/mL). The Enz group was normalized to the Veh group. CellTiter-Glo reading on day 7. Media Ctrl, serum-free media. (H) Western blot analysis of HER3-AKT activation in 22Pc-EP after stimulation with 22Pc-CAFCM in the presence of an HER3-blocking antibody AMG888 (1 or 10 μg/mL) or IgG (10 μg/mL). Total AKT serves as loading control. (I) Growth of 22Pc-EP cells in CSS media supplemented with 22Pc-CAFCM treated with AMG888 (1 or 10 μg/mL) or IgG (10 μg/mL). CellTiter-Glo reading on day 4. Media Ctrl, serum-free media. (J) Growth of 22Pc-EP cells in Enz (0.1 μM) or Veh (DMSO) containing FBS media supplemented with 22Pc-CAFCM treated with AMG888 (1 or 10 μg/mL) or IgG (10 μg/mL). The Enz group was normalized to the Veh group. CellTiter-Glo reading on day 7. Media Ctrl: serum-free media. (K) Western blot analysis of HER3-AKT activation in 22Pc-EP after stimulation with either recombinant NRG1 or EGF (10 or 50 ng/mL). Total AKT serves as loading control. (L) Growth of 22Pc-EP in CSS media supplemented with either recombinant NRG1 or EGF (10 or 50 ng/mL). CellTiter-Glo reading on day 4. Media Ctrl, serum-free media. (M) Growth of 22Pc-EP cells in Enz (0.1 μM) or Veh (DMSO) containing FBS media treated with recombinant NRG1 or EGF (10 or 50 ng/mL). The Enz group was normalized to the Veh group. CellTiter-Glo reading on day 7. Media Ctrl, serum-free media. Assays were performed with three biological replicates. ****p < 0.0001, ***p < 0.001, **p < 0.01, *p < 0.05; n.s., not significant, Student’s t test. Data are represented as mean ± SD. See also Figure S4.
Figure 5.
Figure 5.. NRG1-HER3 Signaling Confers Antiandrogen Resistance In Vivo
(A) qRT-PCR analysis of Nrg1 expression in hormone-intact (n = 7) or castration-resistant (n = 8) CWR22Pc tumors using mouse-specific primers. (B) Western blot analysis of NRG1 expression and HER3-AKT activation in hormone-intact or castration-resistant CWR22Pc tumors. Total AKT serves as loading control. Bands were quantified using ImageJ and normalized to mean of β-actin intensity in each group. Green, hormone intact; red, castrated. (C) Growth of castration-resistant CWR22Pc tumor xenografts in castrated mice, treated with AMG888 (20 mg/kg), neratinib (20 mg/kg), or vehicle. Treatment started when the average tumor size reached 150 mm3 (n = 5 mice per group). (D) Waterfall plot showing growth of individual tumors from (C). (E) Growth of castration-resistant CWR22Pc tumor xenografts in castrated mice, treated with YW538.24.71 (25 mg/kg), neratinib (20 mg/kg), or vehicle. Treatment started when the average tumor size reached 150 mm3 (n = 5 mice per group). (F) Waterfall plot showing growth of individual tumors from (E). (G) Boxplot showing tumor size at week 6 in single-agent neratinib or YW538.24.71 versus combination treatment groups from (E). Each dot represents individual tumors, upper/lower/median values are labeled. (H) Growth of castration-sensitive CWR22Pc tumor xenografts in intact mice, treated with castration plus either YW538.24.71 (25 mg/kg), neratinib (20 mg/kg), or vehicle. Treatment started when the average tumor size reached 200 mm3 (n = 5 mice per group). (I) Boxplot showing tumor size at week 6 in single-agent neratinib or YW538.24.71 versus combination treatment groups in (H). Labeling is the same as in (G). ****p < 0.0001, ***p < 0.001, *p < 0.05; n.s., not significant. (A, G, and I) Student’s t test, data are represented as mean ± SD, (C, E, and H) multiple t test, data are represented as mean ± SEM. See also Figure S5.
Figure 6.
Figure 6.. NRG1 Activates a Subset of AR Target Genes
(A) MA plot showing differentially expressed genes (n = 4,978, adjusted p value < 0.05) in 22Pc-EP cells treated with Enz (0.5 μM, 48 h) or Veh (DMSO). Top 15 up- or downregulated genes were labeled. Canonical AR targets FKBP5 and NKX3–1 were also labeled. (B) MA plot showing differentially expressed genes (n = 5,690, adjusted p value < 0.05) in 22Pc-EP cells treated with recombinant NRG1 (10 ng/mL, 48 h) or Veh (PBS). Top 15 up- or downregulated genes were labeled. (C) GSEA of AR signature between Veh (DMSO)- versus NRG1-treated group in 22Pc-EP cells. (D) Venn diagram showing the number of overlapping genes that are co-regulated by both AR and NRG1 (n = 1,971, adjusted p value < 0.05). (E) Heatmap showing unsupervised clustering of expression of 1,971 genes across 4 conditions (Veh, Enz, NRG1, or Enz + NRG1). Four distinct clusters were identified (clusters 1–4), each representing AR and NRG1 co-regulated genes in the same or opposite directions. (F–I) Venn diagram showing the number of AR and NRG1 co-regulated genes (adjusted p value < 0.05 for both conditions) in each direction (clusters 1–4). Cluster 1 (F), cluster 2 (G), cluster 3 (H), and cluster 4 (I). (J) Dot plot showing fold change values (log2) of genes in each of clusters 1–4. In clusters 1 and 3, genes with log2 fold change >1 were labeled. In clusters 2 and 4, genes with log2 fold change >1.5 were labeled. See also Figure S6 and Tables S1, S2, and S3.
Figure 7.
Figure 7.. ADT Induces NRG1 Expression in the Stroma of Prostate Cancer Patients
(A) Representative images showing H&E (left, middle) and immunohistochemistry (right) analysis of stromal NRG1 staining in radical prostatectomy specimens from high-grade primary PCa patients. Asterisk denotes areas of intraductal carcinoma (no. 1) or invasive cancer (no. 2). (B) Top: pie chart showing percentage of NRG1 positivity in hormone-intact or neoadjuvant ADT-treated groups, and table showing number of patients with NRG1-positive biopsies in hormone-intact or neoadjuvant ADT-treated group. (C) Western blot analysis of NRG1 and CAF markers (PDFGRα, FAP, vimentin, and α-SMA) in five independent patient-derived primary PCa CAFs (pCAFs). pCAF no. 1 is from a neoadjuvant ADT-treated patient and pCAFs no. 2–5 are from hormone-intact patients. HSP90 serves as loading control. Bands were quantified using ImageJ and normalized to mean of HSP90 intensity in each group. (D) Western blot analysis of HER3-AKT activation in 22Pc-EP cells stimulated with conditioned media from patient-derived primary CAFs (pCAFCM). Total AKT serves as loading control. Bands were quantified using ImageJ and normalized to mean of total AKT intensity in each group. (E) Growth of 22Pc-EP cells in CSS media supplemented with pCAFCM. CellTiter-Glo reading on day 4. Media Ctrl, serum-free media. (F) Growth of 22Pc-EP cells in FBS media supplemented with pCAFCM and treated with Enz (0.1 μM). The Enz group was normalized to the Veh group. CellTiter-Glo reading on day 7. Media Ctrl, serum-free media. (G) Growth of 22Pc-EP cells in CSS media supplemented with pCAFCM treated with YW538.24.71 (10 μg/mL) or AMG888 (10 μg/mL). CellTiter-Glo reading on day 4. Media Ctrl, serum-free media. (H) Growth of VCaP or VCaP + pCAF no. 1 co-injected tumor xenografts in castrated mice treated with YW538.24.71 (25 mg/kg), neratinib (20 mg/kg), or vehicle. Treatment started when tumors reached 200 mm3 (n = 5 mice per group). (I) qRT-PCR analysis of NRG1 mRNA expression in pCAF no. 1 treated with CSS, Enz (10 μM), or Veh (DMSO) on day 7. NRG1 expression is normalized to ACTB. (J) Western blot analysis of NRG1 protein in pCAFs no. 2 and 3 treated with CSS, Enz (10 μM), or Veh (DMSO) on day 7. Cyclophilin B serves as loading control. Assays were performed with three biological replicates. ****p < 0.0001, *p < 0.05; n.s., not significant. (E–G) One-way ANOVA compared with Ctrl/Veh/IgG group, (H) one-way ANOVA compared with VCaP alone + Vehicle group, (I) Student’s t test compared with Ctrl group, (E–G and I) data are represented as mean ± SD, (H) data are represented as mean ± SEM. Ctrl, serum-free media. See also Figure S7 and Tables S4–S7.
Figure 8.
Figure 8.. NRG1 Activity Is Associated with Unfavorable Treatment Outcome in CRPC Patients
(A) Pearson correlation analysis of NRG1 signature score versus time on treatment for first line androgen receptor signaling inhibitors (ARSI) of a 54 mCRPC patient cohort (p = 0.005). (B) Histogram showing frequency distribution of NRG1 signature score in the same patient cohort. Dotted line denotes median cutoff. (C) Probability of treatment duration of the high and low (median separation) NRG1 signature (Nagashima et al., 2007) groups among 54 patients. p value (0.034) was calculated using log rank test. (D) Cox hazard ratio analysis of the NRG1 signature score high and low groups of 54 patients. p value (0.019) was calculated using log rank test. (E) Probability of treatment duration of the high and low (median separation) prostate-specific NRG1 signature (22Pc-EP) groups among 54 patients. p value (0.036) was calculated using log rank test. See also Figure S8 and Table S8.

Comment in

References

    1. Abida W, Cyrta J, Heller G, Prandi D, Armenia J, Coleman I, Cieslik M, Benelli M, Robinson D, Van Allen EM, et al. (2019). Genomic correlates of clinical outcome in advanced prostate cancer. Proc. Natl. Acad. Sci. U S A 116, 11428–11436. - PMC - PubMed
    1. Agus DB, Sweeney CJ, Morris MJ, Mendelson DS, McNeel DG, Ahmann FR, Wang J, Derynck MK, Ng K, Lyons B, et al. (2007). Efficacy and safety of single-agent pertuzumab (rhuMAb 2C4), a human epidermal growth factor receptor dimerization inhibitor, in castration-resistant prostate cancer after progression from taxane-based therapy. J. Clin. Oncol 25, 675–681. - PubMed
    1. Ammirante M, Luo JL, Grivennikov S, Nedospasov S, and Karin M (2010). B-Cell-derived lymphotoxin promotes castration-resistant prostate cancer. Nature 464, 302–305. - PMC - PubMed
    1. Antonarakis ES, Lu C, Wang H, Luber B, Nakazawa M, Roeser JC, Chen Y, Mohammad TA, Chen Y, Fedor HL, et al. (2014). AR-V7 and resistance to enzalutamide and abiraterone in prostate cancer. N. Engl. J. Med 371, 1028–1038. - PMC - PubMed
    1. Arora VK, Schenkein E, Murali R, Subudhi SK, Wongvipat J, Balbas MD, Shah N, Cai L, Efstathiou E, Logothetis C, et al. (2013). Glucocorticoid receptor confers resistance to antiandrogens by bypassing androgen receptor blockade. Cell 155, 1309–1322. - PMC - PubMed

Publication types

MeSH terms