

Fertility, mortality, migration, and population scenarios for 195 countries and territories from 2017 to 2100: a forecasting analysis for the Global Burden of Disease Study
- PMID: 32679112
- PMCID: PMC7561721
- DOI: 10.1016/S0140-6736(20)30677-2
Fertility, mortality, migration, and population scenarios for 195 countries and territories from 2017 to 2100: a forecasting analysis for the Global Burden of Disease Study
Abstract
Background: Understanding potential patterns in future population levels is crucial for anticipating and planning for changing age structures, resource and health-care needs, and environmental and economic landscapes. Future fertility patterns are a key input to estimation of future population size, but they are surrounded by substantial uncertainty and diverging methodologies of estimation and forecasting, leading to important differences in global population projections. Changing population size and age structure might have profound economic, social, and geopolitical impacts in many countries. In this study, we developed novel methods for forecasting mortality, fertility, migration, and population. We also assessed potential economic and geopolitical effects of future demographic shifts.
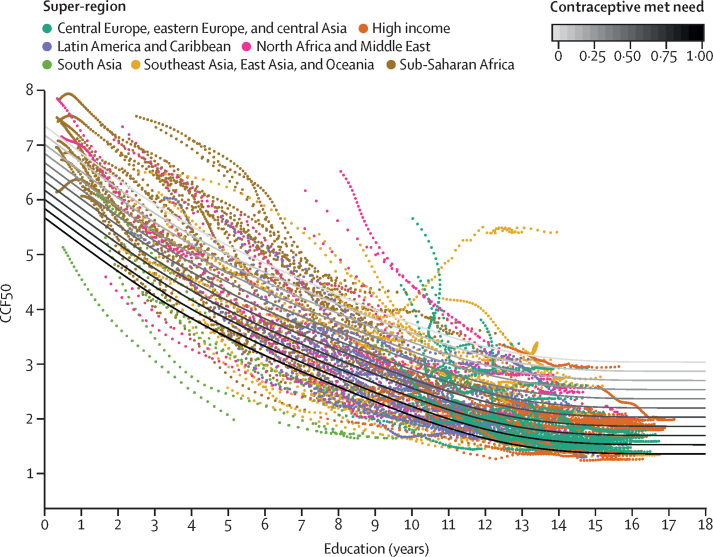
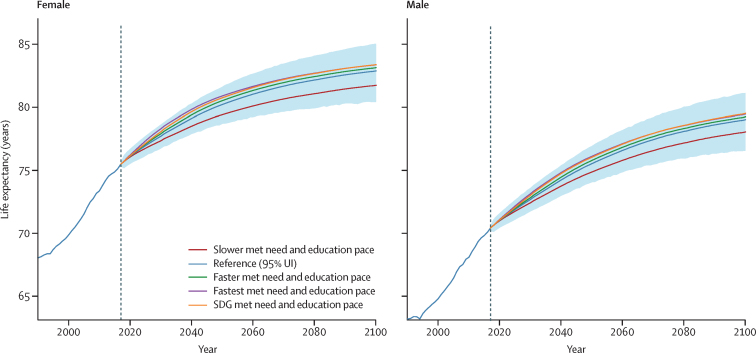
Methods: We modelled future population in reference and alternative scenarios as a function of fertility, migration, and mortality rates. We developed statistical models for completed cohort fertility at age 50 years (CCF50). Completed cohort fertility is much more stable over time than the period measure of the total fertility rate (TFR). We modelled CCF50 as a time-series random walk function of educational attainment and contraceptive met need. Age-specific fertility rates were modelled as a function of CCF50 and covariates. We modelled age-specific mortality to 2100 using underlying mortality, a risk factor scalar, and an autoregressive integrated moving average (ARIMA) model. Net migration was modelled as a function of the Socio-demographic Index, crude population growth rate, and deaths from war and natural disasters; and use of an ARIMA model. The model framework was used to develop a reference scenario and alternative scenarios based on the pace of change in educational attainment and contraceptive met need. We estimated the size of gross domestic product for each country and territory in the reference scenario. Forecast uncertainty intervals (UIs) incorporated uncertainty propagated from past data inputs, model estimation, and forecast data distributions.
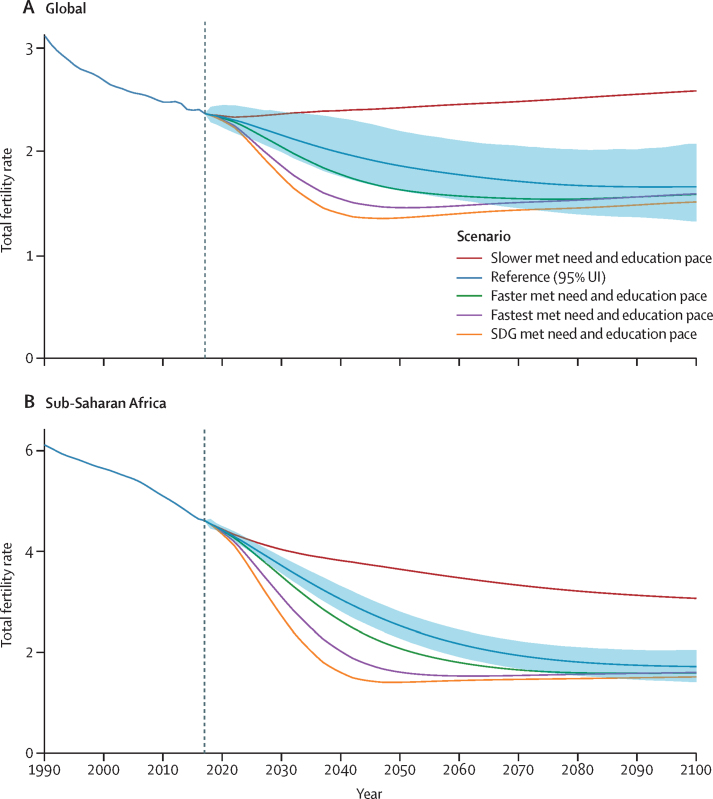
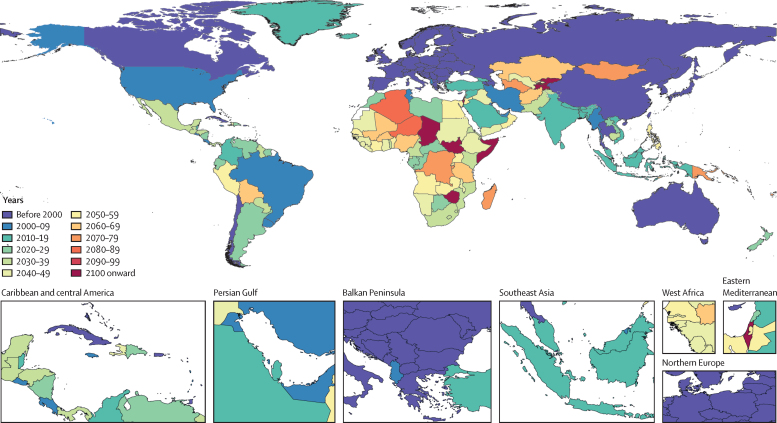
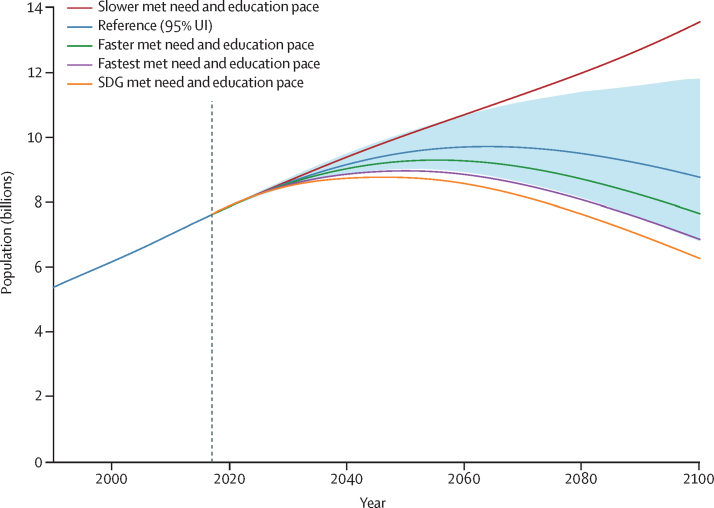
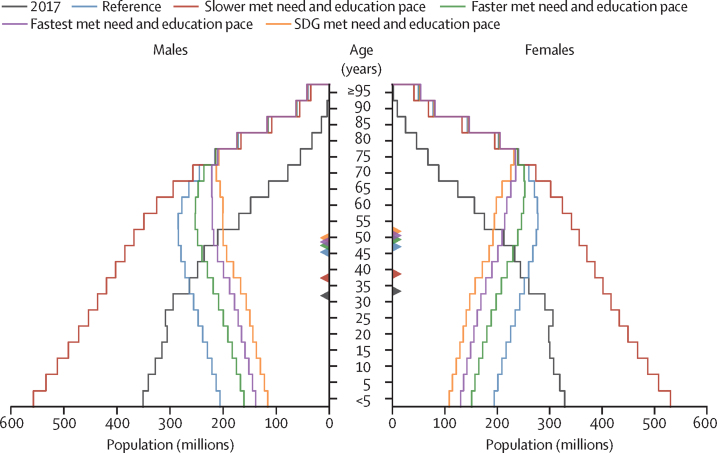
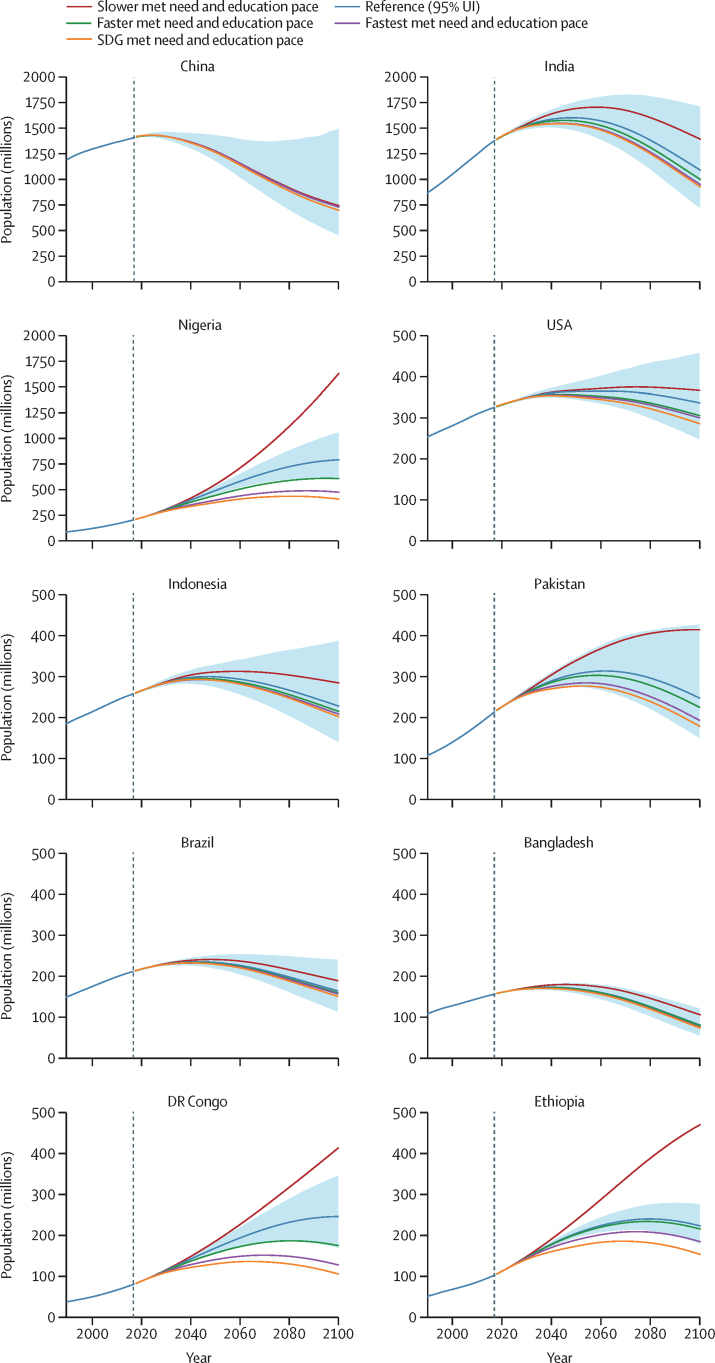
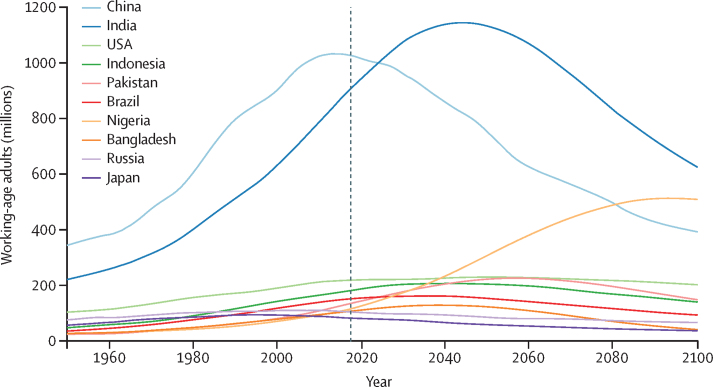
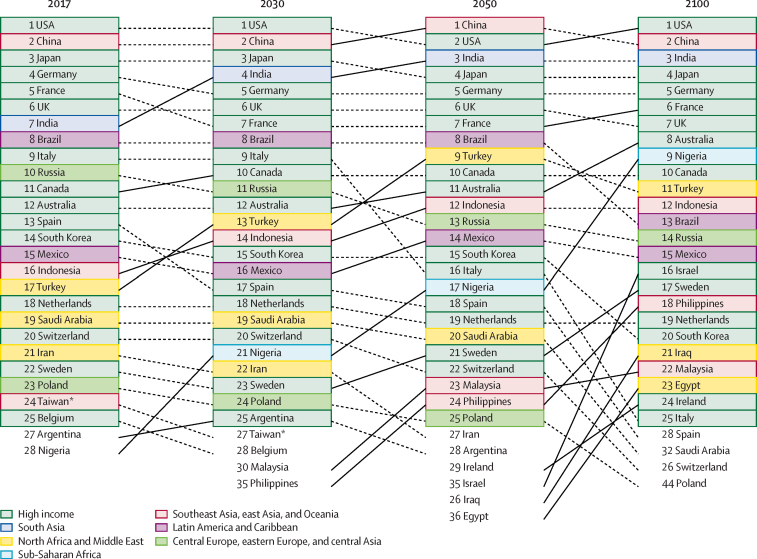
Findings: The global TFR in the reference scenario was forecasted to be 1·66 (95% UI 1·33-2·08) in 2100. In the reference scenario, the global population was projected to peak in 2064 at 9·73 billion (8·84-10·9) people and decline to 8·79 billion (6·83-11·8) in 2100. The reference projections for the five largest countries in 2100 were India (1·09 billion [0·72-1·71], Nigeria (791 million [594-1056]), China (732 million [456-1499]), the USA (336 million [248-456]), and Pakistan (248 million [151-427]). Findings also suggest a shifting age structure in many parts of the world, with 2·37 billion (1·91-2·87) individuals older than 65 years and 1·70 billion (1·11-2·81) individuals younger than 20 years, forecasted globally in 2100. By 2050, 151 countries were forecasted to have a TFR lower than the replacement level (TFR <2·1), and 183 were forecasted to have a TFR lower than replacement by 2100. 23 countries in the reference scenario, including Japan, Thailand, and Spain, were forecasted to have population declines greater than 50% from 2017 to 2100; China's population was forecasted to decline by 48·0% (-6·1 to 68·4). China was forecasted to become the largest economy by 2035 but in the reference scenario, the USA was forecasted to once again become the largest economy in 2098. Our alternative scenarios suggest that meeting the Sustainable Development Goals targets for education and contraceptive met need would result in a global population of 6·29 billion (4·82-8·73) in 2100 and a population of 6·88 billion (5·27-9·51) when assuming 99th percentile rates of change in these drivers.
Interpretation: Our findings suggest that continued trends in female educational attainment and access to contraception will hasten declines in fertility and slow population growth. A sustained TFR lower than the replacement level in many countries, including China and India, would have economic, social, environmental, and geopolitical consequences. Policy options to adapt to continued low fertility, while sustaining and enhancing female reproductive health, will be crucial in the years to come.
Funding: Bill & Melinda Gates Foundation.
Copyright © 2020 The Author(s). Published by Elsevier Ltd. This is an Open Access article under the CC BY 4.0 license. Published by Elsevier Ltd.. All rights reserved.
Figures
Comment in
-
The future of migration, human populations, and global health in the Anthropocene.Lancet. 2020 Oct 17;396(10258):1133-1134. doi: 10.1016/S0140-6736(20)31523-3. Epub 2020 Jul 14. Lancet. 2020. PMID: 32679110 No abstract available.
-
Why sub-Saharan Africa might exceed its projected population size by 2100.Lancet. 2020 Oct 17;396(10258):1131-1133. doi: 10.1016/S0140-6736(20)31522-1. Epub 2020 Jul 14. Lancet. 2020. PMID: 32679113 No abstract available.
-
Trends in population health and demography.Lancet. 2021 Aug 14;398(10300):579-580. doi: 10.1016/S0140-6736(21)01047-3. Lancet. 2021. PMID: 34391495 No abstract available.
-
Trends in population health and demography.Lancet. 2021 Aug 14;398(10300):580. doi: 10.1016/S0140-6736(21)01050-3. Lancet. 2021. PMID: 34391496 No abstract available.
-
Trends in population health and demography.Lancet. 2021 Aug 14;398(10300):580-581. doi: 10.1016/S0140-6736(21)01051-5. Lancet. 2021. PMID: 34391497 No abstract available.
-
Trends in population health and demography.Lancet. 2021 Aug 14;398(10300):581. doi: 10.1016/S0140-6736(21)01113-2. Lancet. 2021. PMID: 34391498 No abstract available.
References
-
- UN. Department of Economic and Social Affairs. Population Division . United Nations; New York: 2019. World population prospects 2019: volume I: comprehensive tables.
-
- UN. Department of Economic and Social Affairs. Population Division . United Nations; New York: 2011. World population prospects: the 2010 revision, volume 1: comprehensive tables.
-
- UN. Department of Economic and Social Affairs. Population Division . United Nations; New York: 2014. World population prospects: the 2012 revision, methodology of the United Nations population estimates and projections.
Publication types
MeSH terms
LinkOut - more resources
Full Text Sources
Other Literature Sources
Miscellaneous
