Multicenter Study
. 2021 Feb;5(2):195-214.
doi: 10.1016/j.oret.2020.07.008. Epub 2020 Jul 15.

Enhanced S-Cone Syndrome: Spectrum of Clinical, Imaging, Electrophysiologic, and Genetic Findings in a Retrospective Case Series of 56 Patients

Affiliations
Multicenter Study

Enhanced S-Cone Syndrome: Spectrum of Clinical, Imaging, Electrophysiologic, and Genetic Findings in a Retrospective Case Series of 56 Patients

Emanuel R de Carvalho et al. Ophthalmol Retina. 2021 Feb.

Abstract

Purpose: To describe the detailed phenotype, long-term clinical course, clinical variability, and genotype of patients with enhanced S-cone syndrome (ESCS).

Design: Retrospective case series.

Participants: Fifty-six patients with ESCS.

Methods: Clinical history, examination, imaging, and electrophysiologic findings of 56 patients (age range, 1-75 years) diagnosed with ESCS were reviewed. Diagnosis was established by molecular confirmation of disease-causing variants in the NR2E3 gene (n = 38) or by diagnostic full-field electroretinography findings (n = 18).

Main outcome measures: Age at onset of visual symptoms, best-corrected visual acuity (BCVA), quantitative age-related electrophysiologic decline, and imaging findings.

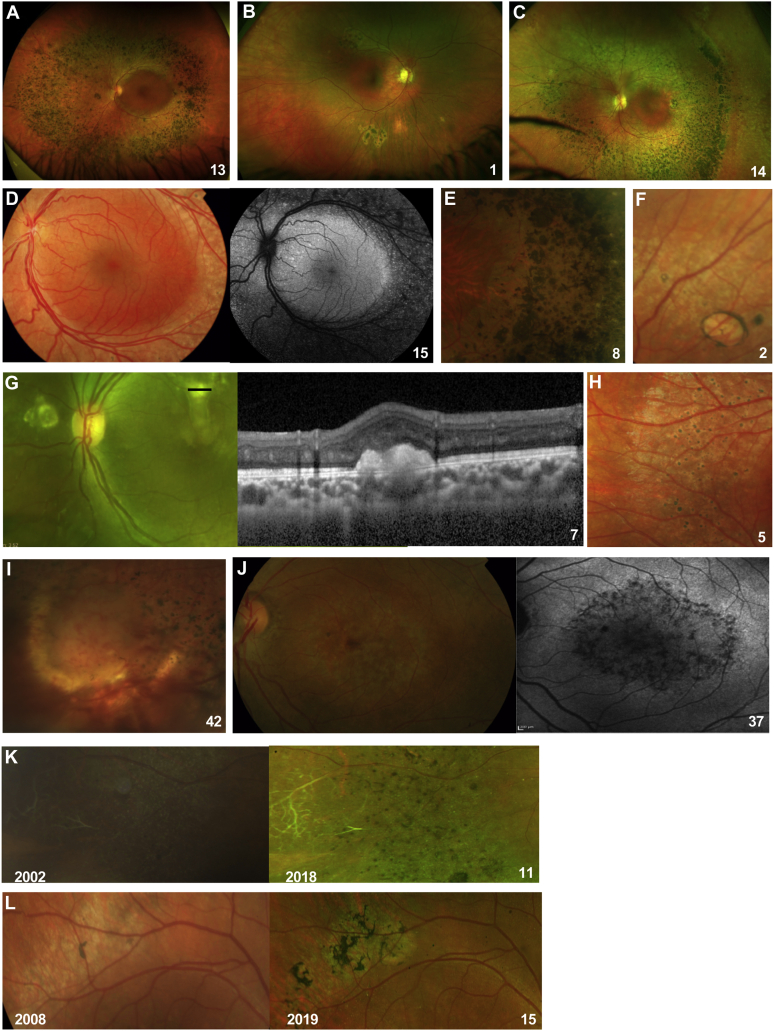
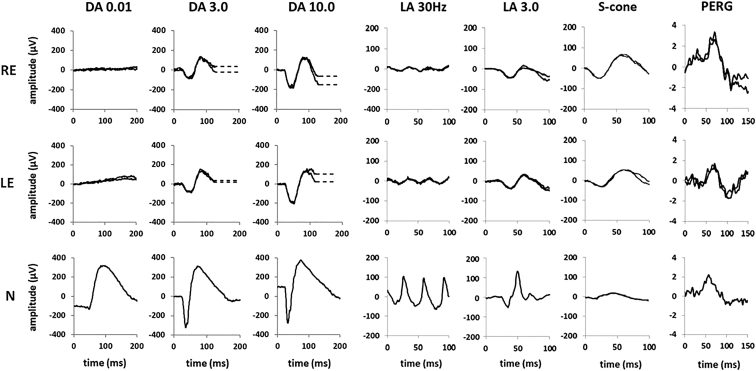
Results: Mean age at onset of visual symptoms was 4.0 years, and median age at presentation was 20.5 years, with mean follow-up interval being 6.1 years. Six patients were assessed once. Disease-causing variants in NR2E3 were identified in 38 patients. Mean BCVA of the better-seeing eye was 0.32 logarithm of the minimum angle of resolution (logMAR) at baseline and 0.39 logMAR at follow-up. In most eyes (76% [76/100]), BCVA remained stable, with a mean BCVA change of 0.07 logMAR during follow-up. Nyctalopia was the most common initial symptom, reported in 92.9% of patients (52/56). Clinical findings were highly variable and included foveomacular schisis (41.1% [26/56]), yellow-white dots (57.1% [32/56]), nummular pigmentation (85.7% [48/56]), torpedo-like lesions (10.7% [6/56]), and circumferential subretinal fibrosis (7.1% [4/56]). Macular and peripheral patterns of autofluorescence were classified as (1) minimal change, (2) hypoautofluorescent (mild diffuse, moderate speckled, moderate diffuse, or advanced), or (3) hyperautofluorescent flecks. One patient showed undetectable electroretinography findings; quantification of main electroretinography components in all other patients revealed amplitude and peak time variability but with pathognomonic electroretinography features. The main electroretinography components showed evidence of age-related worsening over 6.7 decades, at a rate indistinguishable from that seen in unaffected control participants. Eighteen sequence variants in NR2E3 were identified, including 4 novel missense changes.

Conclusions: Enhanced S-cone syndrome has a highly variable phenotype with relative clinical and imaging stability over time. Most electroretinography findings have pathognomonic features, but quantitative assessment reveals variability and a normal mean rate of age-related decline, consistent with largely nonprogressive peripheral retinal dysfunction.

Keywords: Electroretinography; Enhanced S-cone syndrome; Molecular genetics; NR2E3.


Figures

Figure 1
Figure 1
A, Plot showing best-corrected visual acuity (BCVA; logarithm of the minimum angle of resolution [logMAR]) of the right eye at baseline and last follow-up visit against the patient’s age. B, Plot showing BCVA (logMAR) in the right eye as a function of period of follow-up time per individual patient. C, D, Plots showing BCVA change in the right eye (BCVAFU – BCVAbaseline) as function of (C) follow-up (FU) time (y = years) and (D) age at baseline.
Figure 2
Figure 2
Images showing phenotypical variation of enhanced S-cone syndrome in individual patients (numbered). A, Nummular pigmentary deposition in the mid-peripheral retina. B, Circumscribed area of nummular pigmentary deposition with halo of atrophy in inferior peripheral retina. C, Nummular pigmentary deposition, yellow-white dots, and clumped pigmentary changes in the mid-peripheral retina. D, Yellow-white dots along vascular arcades, with increased fundus autofluorescence inside the vascular arcades, sparing the central macula. E, Magnified view of nummular pigmentary deposition, yellow-white dots, and clumped pigmentary changes in mid-peripheral retina. F, Torpedo-like lesion in the peripheral retina. G, Subretinal fibrosis and spectral-domain OCT tomography across lesion (marked) showing a large subretinal hyperreflective deposit. H, Magnified view of yellow-white dots with early pigmentary hyperplastic changes. I, Retinal angioma in a patient with bilateral preretinal nondiabetic neovascularization. J, Maculopathy, characterized by patchy atrophic macular changes, more visible on fundus autofluorescence. K, Color fundus photographs showing the right peripheral retina of patient 11 at baseline (right image) and 17 years later, at last follow-up (left image, year of OCT acquisition marked in left bottom corner). At baseline, retinal sclerosed vessels and yellow-white dots are seen that progressed to nummular and clumped pigmentary deposition as observed in the follow-up photograph of the same area. L, Color fundus photographs showing the right superior vascular arcade in patient 15 at baseline (right image) and 11 years later, at last follow-up (left image, year of OCT acquisition marked in left bottom corner). A well-defined area of yellow-white dots is observed at baseline that developed into clumped pigmentary deposition, shown in the follow-up image.
Figure 3
Figure 3
OCT images showing variation of features of enhanced S-cone syndrome in individual patients (numbered). A, Preserved foveal architecture and outer retinal atrophy, with loss of the ellipsoid zone. B, Foveomacular schisis. C, Magnified view of area outlined in (B), with pseudocolor representation of the the schitic cavities (round shape, in red) at the level of the inner nuclear layer (round shape, in red) and at the level of the outer nuclear layer (elongated shape, in blue). D, End-stage giant foveomacular schisis. E, Disorganization of retinal layers in the atrophic area of mid-peripheral retina. F, Macular atrophy.
Figure 4
Figure 4
Fundus autofluorescence (FAF) images showing macular and peripheral patterns in enhanced S-cone syndrome in individual patients (numbered). A, Minimal change macular FAF pattern. B, Minimal change macular FAF pattern with hyperautofluorescent flecks. C, Mild diffuse macular hypoautofluorescence. D, Moderate speckled macular hypoautofluorescence with increased paramacular FAF. E, Severe end-stage macular hypoautofluorescence. F, Peripheral hyperautofluorescent flecks. G, Moderate diffuse (mid-peripheral half-ring or ring <5000 μm widest diameter) peripheral hypoautofluorescence with half-ring of pronounced hyperautofluorescent ring along the temporal macular rim. H, Near-peripheral moderate diffuse hypoautofluorescence with patchy advanced hypoautofluorescence. I, Moderate diffuse peripheral hypoautofluorescence (>5000 μm). J, Advanced peripheral hypoautofluorescence. K, Colour fundus photograph and related autofluorescence image showing the correspondence between yellow-white dots and hyperautofluorescent flecks. L, Wide-field autofluorescence image from a control participant. The macula was defined as the region encompassing 5.5 mm from the temporal margin of the optic nerve head and the mid periphery as 3 mm around the macula.
Figure 5
Figure 5
Full-field electroretinography and pattern electroretinography (PERG) recordings from the right eye (RE) and left eye (LE) of a patient with enhanced S-cone syndrome compared with recordings from a representative unaffected control participant (N). Electroretinography recordings include the dark-adapted (DA) electroretinography responses (flash strengths, 0.01 and 10.0 cd.s/m2; DA 0.01 and DA 10.0) and light-adapted (LA) electroretinography responses for a flash strength of 3.0 cd.s/m2 (LA 3.0; 30 Hz and 2 Hz). The pattern electroretinography (PERG) responses are recorded in an alternating checkerboard. A 20-ms prestimulus delay in single-flash electroretinography recordings is present, with the exception of the S-cone electroretinography response. Broken lines replace blink artefacts occurring after electroretinography b-waves, for clarity. Patient responses are superimposed to demonstrate reproducibility. In this patient, the PERG P50 component is delayed but of normal amplitude. The rod-specific dim flash (DA 0.01) electroretinography features are undetectable. The single-flash DA 3.0, DA 10.0, and LA 3.0 electroretinography responses have similarly simplified and severely delayed waveforms, qualitatively comparable in shape with the S-cone electroretinography response and consistent with generation by the same (S-cone) mechanism. The S-cone electroretinography response is delayed and grossly enlarged. The LA 30-Hz electroretinography response is smaller than the LA 3 electroretinography a-wave, whereas in the typical healthy participant, the LA 30-Hz electroretinography amplitude is between that of the LA 3 a- and b-waves. Measurements of the main electroretinography components are compared with the control range in Supplemental Table O (available at www.ophthalmologyretina.org).
Figure 6
Figure 6
Graphs showing the main dark-adapted (DA) full-field electroretinography component amplitudes and peak times in each eye in the enhanced S-cone syndrome (ESCS) cohort (filled circles and squares) and in healthy control participants (gray circles) plotted against age (in years) at the time of testing, illustrating the severity and range of electroretinography abnormality in the ESCS group. Data are shown for the DA strong flash (DA 10) electroretinography a-wave (A) amplitude and (B) peak time and for the b-wave (C) amplitude and (D) peak time. Regression analysis shows a similar, statistically significant (P < 0.05) age-related reduction in amplitudes for both control (broken lines) and ESCS (solid lines) groups. LE = left eye; RE = right eye.
Figure 7
Figure 7
Graphs showing the main light-adapted (LA) full-field electroretinography component amplitudes and peak times in each eye in the enhanced S-cone syndrome (ESCS) cohort (filled circles and squares) and in healthy control participants (gray circles) plotted against age (in years) at the time of testing, illustrating the severity and range of electroretinography abnormality in the ESCS group. Data are shown for the LA 30-Hz flicker electroretinography (A) amplitude and (B) peak time, for the single flash cone (LA 3) electroretinography a-wave (C) amplitude and (D) peak time, and for the LA 3 electroretinography b-wave (E) amplitude and (F) peak time. Regression analysis shows a similar, statistically significant (P < 0.05) age-related reduction in amplitudes for both control (broken lines) and ESCS (solid lines) groups. LE = left eye; RE = right eye.
Figure 8
Figure 8
Graph showing a comparison of amplitude and peak time ratios between the light-adapted (LA) 3.0 electroretinography a-wave and LA 30-Hz electroretinography responses in the enhanced S-cone syndrome (ESCS) cohort (filled circles and squares) and healthy control participants (open gray circles and squares). The horizontal bars show the mean ±1 standard deviation (SD) for amplitudes in the ESCS group. The LA 30-Hz electroretinography response has an amplitude of more than the LA 3 electroretinography a-wave in all control participants. In the ESCS group, the LA 30-Hz electroretinography amplitude is equal or smaller than the LA 3 electroretinography a-wave, resulting in a ratio of 1 or more. ∗∗∗P = 0.0001.
Figure 9
Figure 9
Graphs showing the S-cone electroretinography (ERG) component (A) amplitudes and (B) peak times for the enhanced S-cone syndrome (ESCS) cohort (n = 28, filled circles) and a healthy control group (n = 51, open gray circles) for comparison, plotted against age (in years). S-cone electroretinography amplitudes were measured from the early negative trough to maximum peak or, in the absence of an early trough, from baseline to the peak of the positive polarity S-cone electroretinography component. The largest S-cone electroretinography responses were seen in some of the younger ESCS individuals (solid regression line shows a negative slope), but no age-related statistically significant differences were found. Comparison of S-cone electroretinography (C) amplitudes and (D) peak times with those for light-adapted (LA) 3 electroretinography b-waves are shown for the ESCS and control groups and illustrate high positive correlation in the ESCS group, consistent with S-cone and LA 3 electroretinography responses being dominated by abnormal S-cone opsin-mediated activity. All data relate to right-eye recordings.
Figure 10
Figure 10
A, Stereo representation of the NR2E3 ligand-binding domain (LBD) monomer (pdb code, 4LOG), starting at residue 217, and locations of the novel missense NR2E3 LBD mutations mapped on the receptor. BD, Predicted effect of the mutations (p.R247W, p.L303P, and p.R309Q) leading to a rearrangement of the bulky side chains and loss of hydrogen bonds.

References

    1. Kobayashi M., Takezawa S., Hara K. Identification of a photoreceptor cell-specific nuclear receptor. Proc Natl Acad Sci U S A. 1999;96:4814–4819. - PMC - PubMed
    1. Schorderet D.F., Escher P. NR2E3 mutations in enhanced S-cone sensitivity syndrome (ESCS), Goldmann-Favre syndrome (GFS), clumped pigmentary retinal degeneration (CPRD), and retinitis pigmentosa (RP) Hum Mutat. 2009;30:1475–1485. - PubMed
    1. Coppieters F., Leroy B.P., Beysen D. Recurrent mutation in the first zinc finger of the orphan nuclear receptor NR2E3 causes autosomal dominant retinitis pigmentosa. Am J Hum Gen. 2007;81:147–157. - PMC - PubMed
    1. Gerber S., Rozet J.M., Takezawa S.I. The photoreceptor cell-specific nuclear receptor gene (PNR) accounts for retinitis pigmentosa in the Crypto-Jews from Portugal (Marranos), survivors from the Spanish Inquisition. Hum Genet. 2000;107:276–284. - PubMed
    1. Sharon D., Sandberg M.A., Berson E.L., Dryja T.P. Shared mutations in NR2E3 in enhanced S-cone syndrome, Goldmann-Favre syndrome, and clumped pigmentary retinal degeneration. Invest Ophthalmol Vis Sci. 2002;43 1316–1323. - PubMed

Publication types

MeSH terms

Supplementary concepts