. 2020 Jul 24;23(7):101331.
doi: 10.1016/j.isci.2020.101331. Epub 2020 Jul 1.

Translational Components Contribute to Acclimation Responses to High Light, Heat, and Cold in Arabidopsis

Affiliations

Translational Components Contribute to Acclimation Responses to High Light, Heat, and Cold in Arabidopsis

Antoni Garcia-Molina et al. iScience. .

Abstract

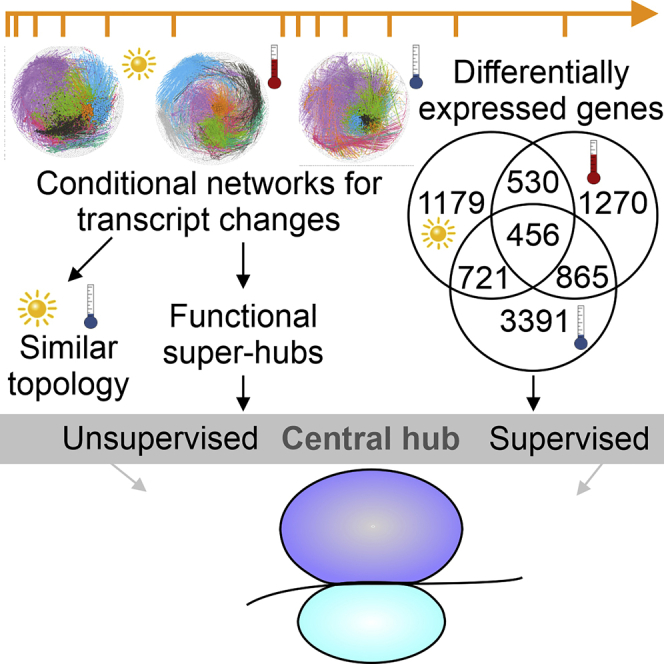
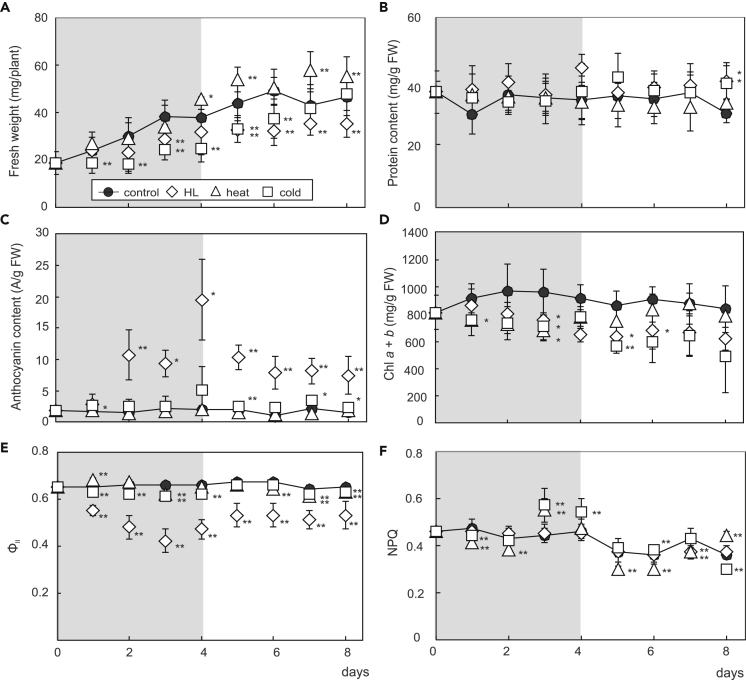
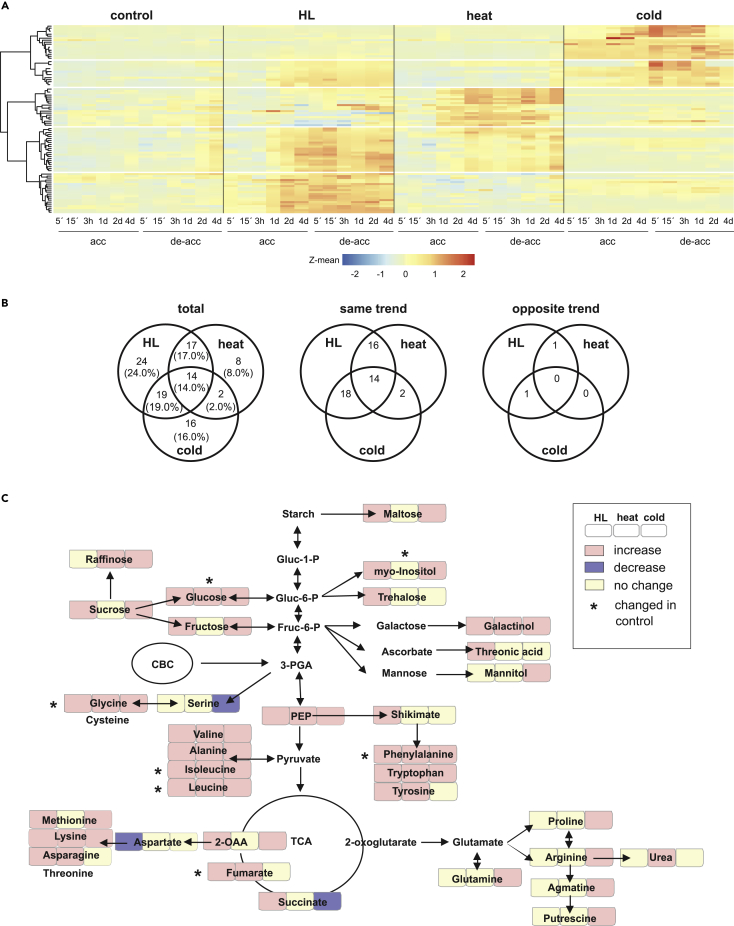
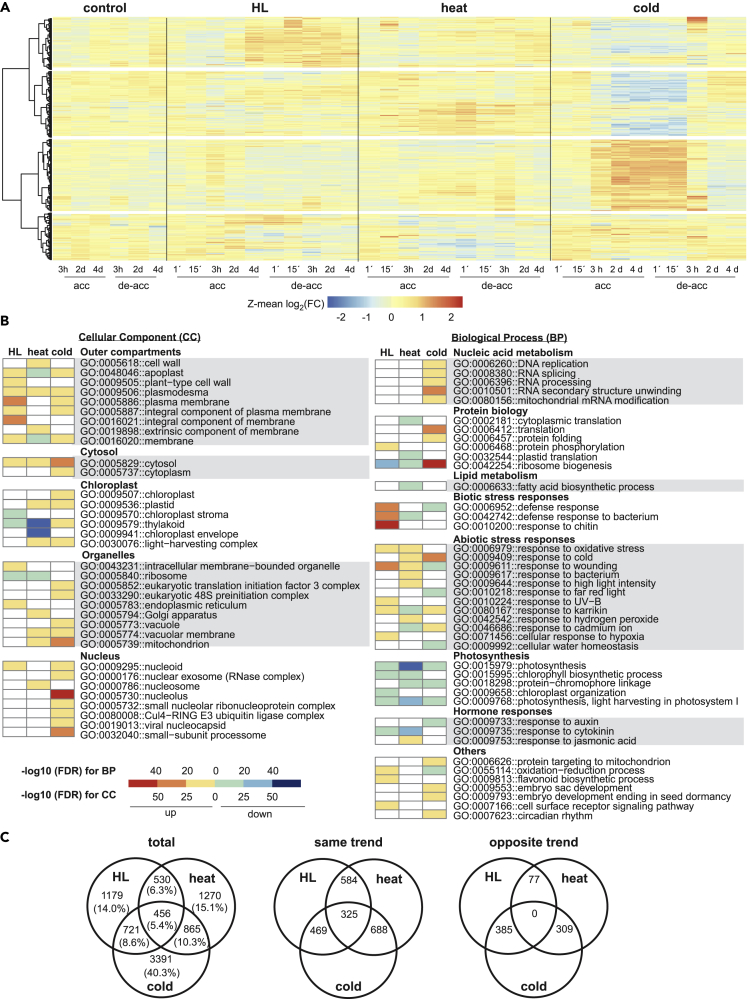
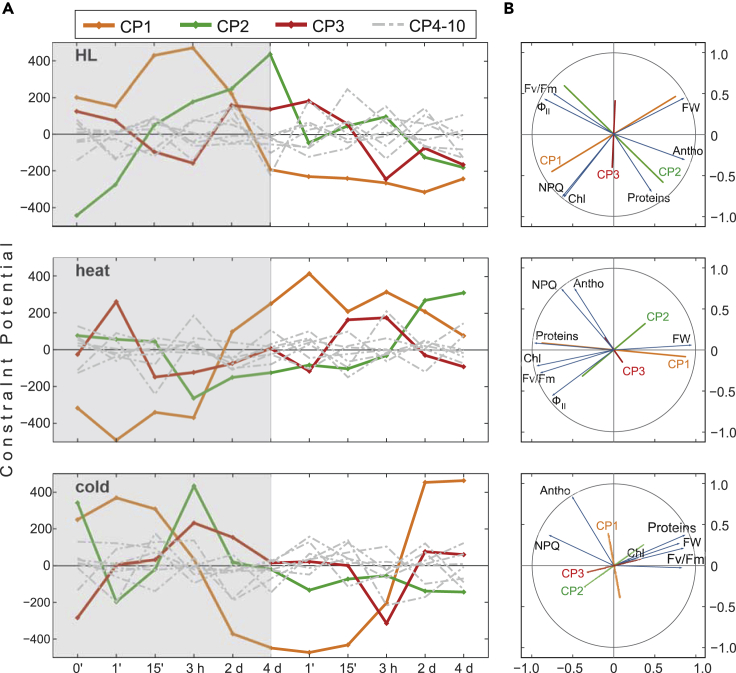
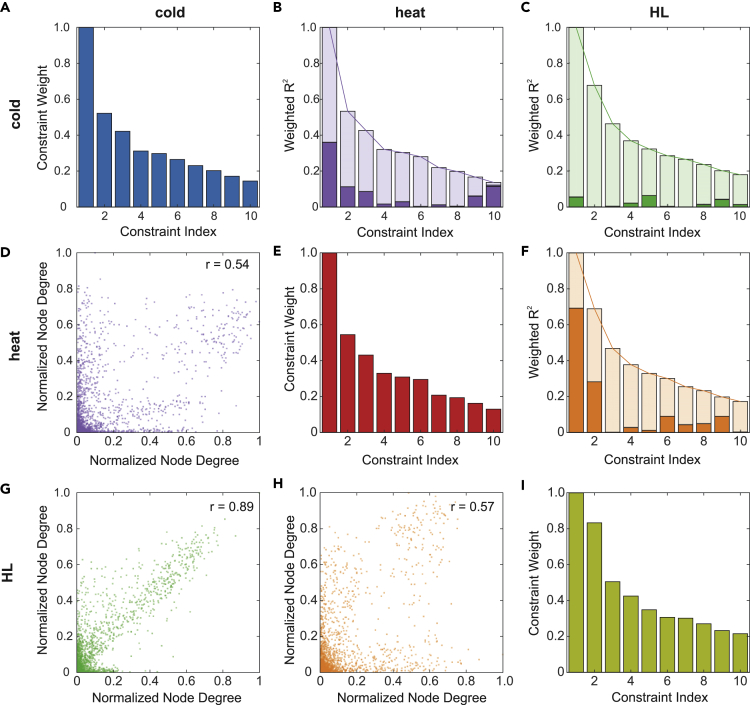
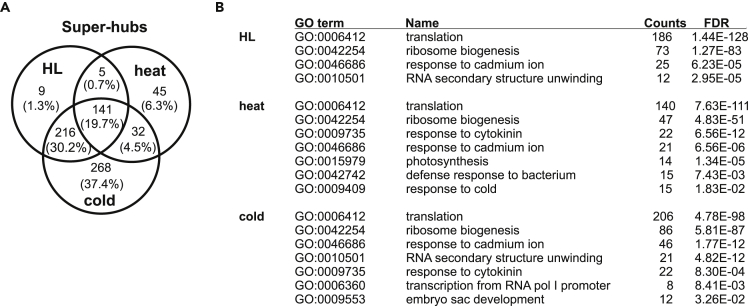
Plant metabolism is broadly reprogrammed during acclimation to abiotic changes. Most previous studies have focused on transitions from standard to single stressful conditions. Here, we systematically analyze acclimation processes to levels of light, heat, and cold stress that subtly alter physiological parameters and assess their reversibility during de-acclimation. Metabolome and transcriptome changes were monitored at 11 different time points. Unlike transcriptome changes, most alterations in metabolite levels did not readily return to baseline values, except in the case of cold acclimation. Similar regulatory networks operate during (de-)acclimation to high light and cold, whereas heat and high-light responses exhibit similar dynamics, as determined by surprisal and conditional network analyses. In all acclimation models tested here, super-hubs in conditional transcriptome networks are enriched for components involved in translation, particularly ribosomes. Hence, we suggest that the ribosome serves as a common central hub for the control of three different (de-)acclimation responses.

Keywords: Biological Sciences; Metabolomics; Plant Biology; Plants; Transcriptomics.


Conflict of interest statement

Declaration of Interests The authors declare no competing interests.

Figures

None
Graphical abstract
Figure 1
Figure 1
Physiological Performance of Arabidopsis Plants during (De-)acclimation to High Light, Heat, and Cold (A–F) 14-day-old plants grown under standard growth conditions were exposed to high light (HL), heat, and cold for 4 days (acclimation period, highlighted by gray background), followed by a return to standard growth conditions for 4 days (de-acclimation period). Fresh weight (A), total protein content (B), anthocyanin content (C), chlorophyll (Chl a + b) level (D), effective quantum yield of photosystem II (ФII) (E), and non-photochemical quenching (NPQ) (F) were recorded daily. Values correspond to the mean ± SD of n ≥ 4 independent experiments. ∗∗p < 0.01; ∗p < 0.05 (Student’s t test). See Table S1 for standard deviations and statistics. See also Figure S1.
Figure 2
Figure 2
Changes in Metabolite Composition during (De-)acclimation to High Light, Heat, and Cold (A) Heatmaps based on Z-means of fold changes of SAMs and generated by hierarchical clustering according to Ward d2. (B) Venn diagrams depicting shared or unique SAMs, comprising total numbers (left panel, “total”), or only the ones that show the same (up-up or down-down, “same trend”) or opposite (up-down or down-up, “opposite trend”) regulation polarities. (C) Scheme summarizing the changes in concentration of metabolites involved in central metabolism in Arabidopsis. acc, acclimation; de-acc, de-acclimation; CBC, Calvin-Benson cycle; TCA, tricarboxylic acid cycle; Gluc, glucose; Fruc, fructose; P, phosphate; 3-PGA, 3-phosphoglycerate; PEP, phosphoenolpyruvate; 2-OAA, 2-oxaloacetate. Metabolites whose levels also changed under control conditions are indicated by ∗. Note that glycine levels decreased under control conditions. See also Figures S2 and S3.
Figure 3
Figure 3
Changes in Transcript Accumulation during (De-)acclimation to High Light, Heat, and Cold (A) Heatmaps based on Z-means of fold changes of DEGs. Major regulons were identified by clustering of Z-scores using Ward d2. (B) Heatmaps illustrating non-redundant Gene Ontology (GO) term enrichment according to DAVID and REVIGO (Huang da et al., 2009a, 2009b; Supek et al., 2011). The color scale corresponds to the -log10 transformation of the FDR for the enrichment according to the Fisher's exact test. The regulatory trend of the transcripts in each bin (up or down) is indicated. (C) Venn diagrams illustrating shared or unique DEGs, comprising total numbers (left panel, “total”), or only those that show the same (up-up or down-down, “same trend”) or opposite (up-down or down-up, “opposite trend”) polarities of regulation. Note that “same trend” and “opposite trend” sets do not always sum up to “total,” because in several instances the polarity of regulation changed during the time course. See also Figures S4 and S5.
Figure 4
Figure 4
Surprisal Analysis of Transcriptome Changes during (De-)acclimation to High Light, Heat, and Cold (A) Time course of the constraint potentials (CPs) derived from the transcriptome profiles of (de-)acclimation samples (high light [HL], heat, and cold). The minor constraints (4–10) are shown as gray lines; the acclimation phase is indicated by a gray square. Sign changes of CPs indicate reconfiguration of the underlying molecular dynamics. (B) Circle correlation plots derived from partial least-squares regression analysis of CP1–3 of the time course shown in (A) and the physiological profiles depicted in Figure 1. Antho, anthocyanin content; Chl, chlorophyll content; FW, fresh weight; ФII, effective quantum yield of PSII; Fv/Fm, maximum quantum efficiency of PSII. Lines of CP1–CP3 in this plot were mirrored to reflect the fact that constraints contain positive and negative weights. Therefore, it is not possible to distinguish whether the effect was caused by positive or negative correlation. See also Figure S7.
Figure 5
Figure 5
Commonalities and Differences between Acclimation Responses Revealed by Comparing Results of Conditional Network and Surprisal Analyses Matrices showing correlations between constraint indices and weights, normalized node degrees, and weighted R2 scores. Column and row headers indicate which conditions were compared with one another (blue = cold, red = heat, yellow = HL, purple = heat/cold, green = HL/cold, orange = heat/HL). (A–I) (A, E, and I) Weights of the constraints determined by surprisal analysis for the three conditions. (B, C, and F) Weighted coefficients of determination (R2) of linear regression analyses of constraint potential (CP) time courses determined by surprisal analysis for each constraint index (1–10) and depicted as column plots. Linear regression scores were calculated pairwise for CPs with the same index. R2 was then weighted by the mean of the respective constraint weights of the two compared conditions shown on the diagonal. The open columns indicate the upper bound resulting from the weighting procedure. (D, G, and H) Correlation plots of normalized node degrees of the conditional network nodes. The Pearson correlation (r) is displayed for each plot. See also Figures S8 and S9.
Figure 6
Figure 6
Analysis of Super-hubs in Conditional Networks for Transcripts (A) Venn diagram depicting super-hubs (degree >100) common to the three networks. (B) GO term enrichment of the identified super-hubs. The counts are provided, together with the FDR obtained with Fisher's exact test based on all nodes included in the networks.

References

    1. Amme S., Matros A., Schlesier B., Mock H.P. Proteome analysis of cold stress response in Arabidopsis thaliana using DIGE-technology. J. Exp. Bot. 2006;57:1537–1546. - PubMed
    1. Anjum N.A. Plant acclimation to environmental stress: a critical appraisal. Front. Plant Sci. 2015;6:445.
    1. Ashraf M., Ahmad M.S.A., Öztürk M., Aksoy A. Crop improvement through different means: challenges and prospects. In: Ashraf M., Öztürk M., Ahmad M.S.A., Aksoy A., editors. Crop Production for Agricultural Improvement. Springer Netherlands; 2012. pp. 1–15.
    1. Barakat A., Szick-Miranda K., Chang I.F., Guyot R., Blanc G., Cooke R., Delseny M., Bailey-Serres J. The organization of cytoplasmic ribosomal protein genes in the Arabidopsis genome. Plant Physiol. 2001;127:398–415. - PMC - PubMed
    1. Beine-Golovchuk O., Firmino A.A.P., Dabrowska A., Schmidt S., Erban A., Walther D., Zuther E., Hincha D.K., Kopka J. Plant temperature acclimation and growth rely on cytosolic ribosome biogenesis factor homologs. Plant Physiol. 2018;176:2251–2276. - PMC - PubMed