. 2020 Jul 15;12(7):1908.
doi: 10.3390/cancers12071908.

The Density and Length of Filopodia Associate with the Activity of Hyaluronan Synthesis in Tumor Cells

Affiliations

The Density and Length of Filopodia Associate with the Activity of Hyaluronan Synthesis in Tumor Cells

Heikki Kyykallio et al. Cancers (Basel). .

Abstract

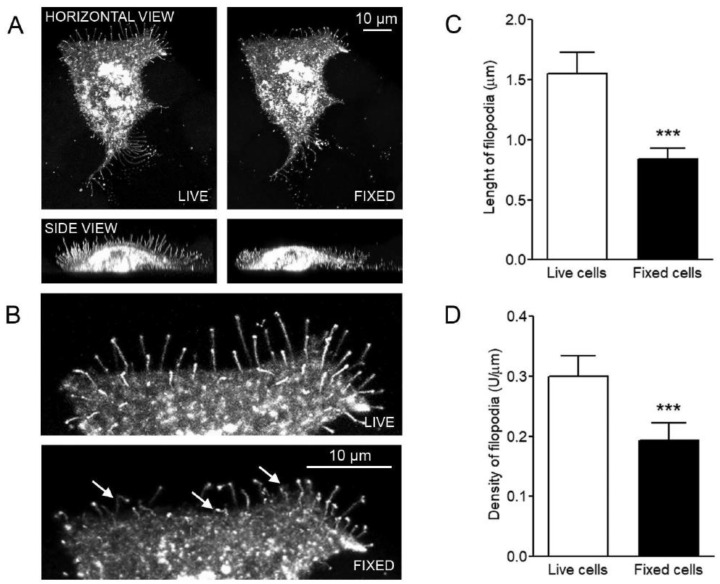
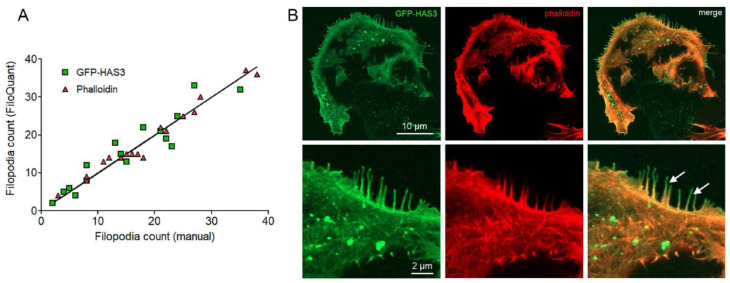
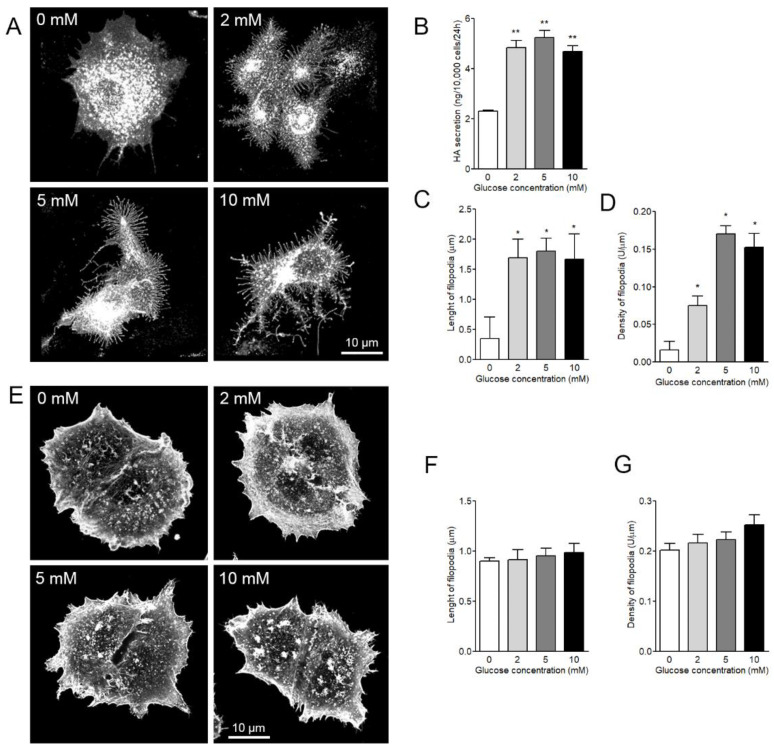
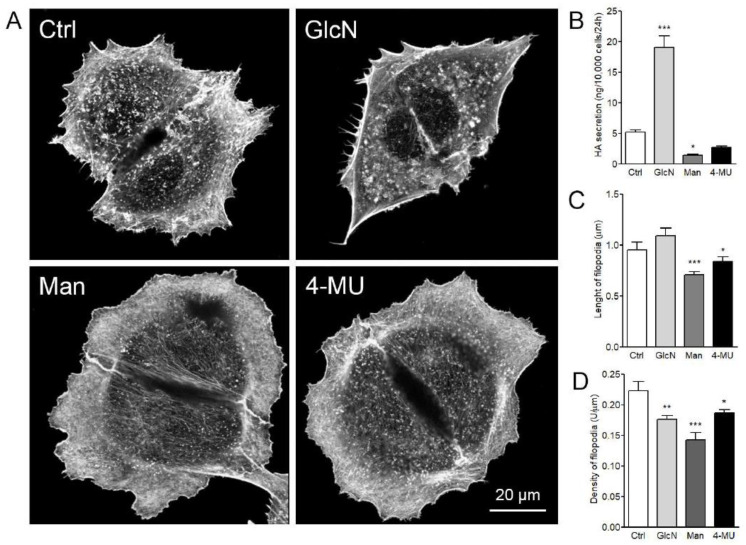
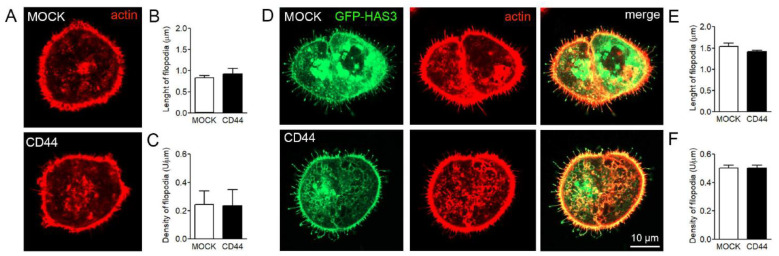
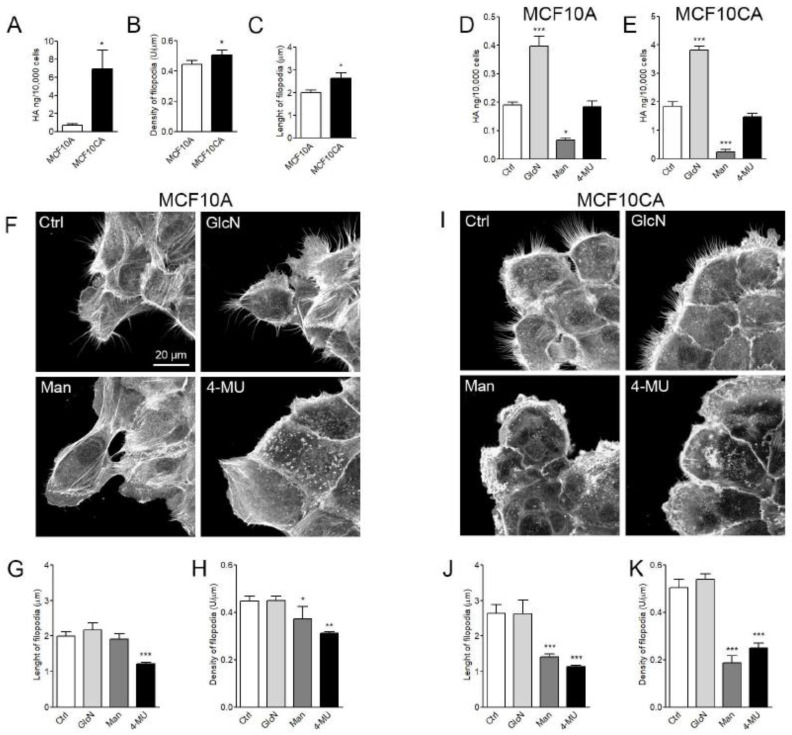
Filopodia are multifunctional finger-like plasma membrane protrusions with bundles of actin filaments that exist in virtually all cell types. It has been known for some time that hyaluronan synthesis activity induces filopodial growth. However, because of technical challenges in the studies of these slender and fragile structures, no quantitative analyses have been performed so far to indicate their association with hyaluronan synthesis. In this work we comprehensively address the direct quantification of filopodial traits, covering for the first time length and density measurements in a series of human cancer cell lines with variable levels of hyaluronan synthesis. The synthesis and plasma membrane binding of hyaluronan were manipulated with hyaluronan synthase 3 (HAS3) and hyaluronan receptor CD44 overexpression, and treatments with mannose, 4-methylumbelliferone (4-MU), and glucosamine. The results of this work show that the growth of filopodia was associated with the levels of hyaluronan synthesis but was not dependent on CD44 expression. The results confirm the hypothesis that abundance and length of filopodia in cancer cells is associated with the activity of hyaluronan synthesis.

Keywords: CD44; cancer; filopodia; hyaluronan; hyaluronan synthase.


Conflict of interest statement

The author declares no conflicts of interest.

Figures

Figure 1
Figure 1
Numbers and length of filopodia are decreased after fixation. (A) The same GFP-hyaluronan synthase 3 (HAS3) expressing cell before (live) and after fixation with 4% paraformaldehyde (fixed). (B) A higher magnification from one edge of the cell. FiloQuant measurement of (C) filopodia length and (D) relative density in live and fixed cells (n = 25 cells for both groups). *** p < 0.001. Unpaired t-test. Magnification bars = 10 µm.
Figure 2
Figure 2
Precision in filopodia detection with EGFP-HAS3 and phalloidin signal in fixed cells. (A) The amount of filopodia detected with FiloQuant analysis is plotted against the manually annotated filopodia number for each cell edge by using EGFP-HAS3 signal (green squares, R2 = 0.8964) and phalloidin signal (red inverted triangles, R2 = 0.9717). (B) Images illustrating EGFP-HAS3 signal and phalloidin signal; arrows in (B) point filopodia in the edge of MCF-7 cell expressing GFP-HAS3 (n = 16 cells for both groups).
Figure 3
Figure 3
Analysis of stable MCF-7 cells with inducible expression of GFP-HAS3 in fixed and phalloidin-stained cells. Examples of analyzed cells (A) without and (B) with induction of GFP-HAS3 expression by doxycycline. (C) The levels of hyaluronan synthesis, (D) the average density, and (E) the average length of filopodia without and with induction. Student’s t-test, * p < 0.05. ** p < 0.01 (n = 5 independent experiments with 16–28 cells/group in each experiment).
Figure 4
Figure 4
Both length and density of HAS3-induced filopodia are dependent on glucose levels. (A) Examples of live MCF-7 cells grown in different glucose concentrations. (B) The levels of hyaluronan secretion in different glucose concentrations and (C) FiloQuant analysis of the length and (D) density of filopodia in live cells. (E) Examples of fixed and phalloidin-stained MCF-7 cells grown in different glucose concentrations. FiloQuant analysis on the (F) length and (G) density of fixed and phalloidin-stained cells grown in the same concentrations of glucose. One-way ANOVA, * p < 0.05, ** p < 0.01, as compared to control. (n = 5 independent experiments with 18–30 cells/group in each experiment).
Figure 5
Figure 5
Effect of glucosamine, mannose, and 4-methylumbelliferone (4-MU) treatments on the formation of HAS3-induced filopodia. (A) Examples of analyzed GFP-HAS3 expressing fixed and phalloidin-stained MCF-7 cells with different treatments are shown in and (B) analysis of hyaluronan secretion, (C) length, and (D) density of filopodia. One-way ANOVA, * p < 0.05, ** p < 0.01, *** p < 0.001, as compared to control (n = 5 independent experiments with 16–28 cells/group in each experiment).
Figure 6
Figure 6
Effect of CD44 expression on filopodia length and density in MKN74 cells. (A) Examples of fixed and phalloidin-stained MKN74-MOCK and MKN74-CD44 cells and (B) average length and (C) density of filopodia. The effect of GFP-HAS3 expression on the filopodia of MKN74 cell lines was studied by transient transfections, followed by fixation and phalloidin staining. (D) Examples of analyzed cells and the (E) average length and (F) density of filopodia are shown (n = 3 independent experiments with 14–41 cells/group in each experiment).
Figure 7
Figure 7
Hyaluronan (HA) secretion and filopodial growth in MCF10A and MCF10CA breast cancer cell lines. (A) HA secretion levels, (B) density, and (C) length of filopodia of fixed and phalloidin-stained MCF10 cell lines. Effect of different treatments on hyaluronan secretion of (D) MCF10A and (E) MCF10CA cells. (F) Examples of MCF10A cell cultures and (I) MCF10CA cell cultures after different treatments. (G) Average length and (H) density of filopodia in MCF10A cells, and (J) length and (K) density of filopodia in MCF10CA cells after different treatments. Ctrl = control, GlcN = glucosamine (2 mM), Man = mannose (20 mM), and 4-MU = 4-methylumbelliferone (1 mM). Student’s t-test was utilized to compare the cell lines (A–C) and one-way ANOVA compared the treatments (D, E, G, H, J and K). * p < 0.05, ** p < 0.01, *** p < 0.001 (n = 5 independent experiments with 18–43 cells/group in each experiment).

References

    1. Chhabra E.S., Higgs H.N. The many faces of actin: Matching assembly factors with cellular structures. Nat. Cell Biol. 2007;9:1110–1121. doi: 10.1038/ncb1007-1110. - DOI - PubMed
    1. Mattila P.K., Lappalainen P. Filopodia: Molecular architecture and cellular functions. Nat. Rev. Mol. Cell Biol. 2008;9:446–454. doi: 10.1038/nrm2406. - DOI - PubMed
    1. Sato Y., Nagatoshi K., Hamano A., Imamura Y., Huss D., Uchida S., Lansford R. Basal filopodia and vascular mechanical stress organize fibronectin into pillars bridging the mesoderm-endoderm gap. Development. 2017;144:281–291. doi: 10.1242/dev.141259. - DOI - PubMed
    1. Sagar, Pröls F., Wiegreffe C., Scaal M. Communication between distant epithelial cells by filopodia-like protrusions during embryonic development. Development. 2015;142:665–671. doi: 10.1242/dev.115964. - DOI - PubMed
    1. Khurana S., George S.P. The role of actin bundling proteins in the assembly of filopodia in epithelial cells. Cell Adhes. Migr. 2011;5:1–12. doi: 10.4161/cam.5.5.17644. - DOI - PMC - PubMed