

doi: 10.1016/j.it.2020.06.011.
Epub 2020 Jun 29.
Using Serology with Models to Clarify the Trajectory of the SARS-CoV-2 Emerging Outbreak
Affiliations
- PMID: 32680648
- PMCID: PMC7323642
- DOI: 10.1016/j.it.2020.06.011
Item in Clipboard
Using Serology with Models to Clarify the Trajectory of the SARS-CoV-2 Emerging Outbreak
Trends Immunol.
2020 Oct.
No abstract available
Figures
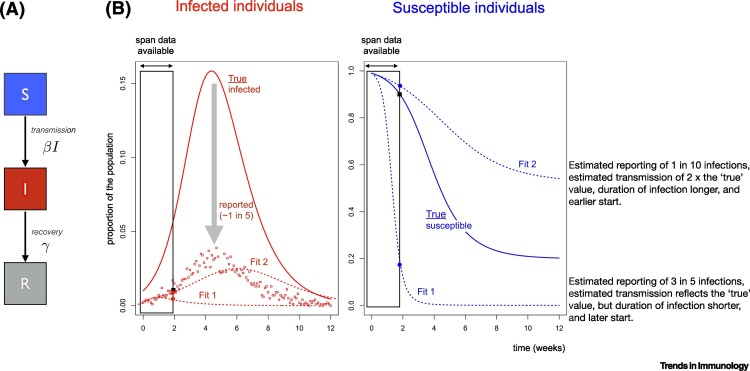
Grounding Mathematical Models of Infection Using Serology. (A) A classic Susceptible–Infected–Recovered model, where individuals start as susceptible (S, assumed to initially reflect everyone for SARS-CoV-2), become infectious (I) at a rate defined by the encounter rate between susceptible and infectious individuals, and the rate of infection on encounter (defined by the parameter β; and then eventually recover (R, at rate γ). (B) Resulting trajectories of infections (left) with β = 2 and γ = 1 week (solid line, ‘true’ cases), and the associated observed cases (points), simulated from a binomial distribution around this line with probability of being reported of ρ = 0.2. If we assume that only case data (points) are available, and only for the first 2 weeks of the pandemic (indicated by ‘span data available’, i.e., here, the scenario considered reflects an early phase of the pandemic), then several different parameter sets (denoted as Fit1 and Fit2) are compatible with the data. Compatibility can be measured via any metric describing the distance between the observed cases (points) and the projected numbers of reported cases (dashed lines). However, the two different parameter sets yield different longer term trajectories (dashed lines, higher curve Fit2 corresponds to β = 4, γ = 0.6 ρ = 0.01 with a starting point 1 week earlier than the simulated ‘true’ start of the outbreak, and the lower curve Fit1 corresponds to β = 2, γ = 1.5 ρ = 0.6 and a starting point 1 week later than the ‘true’ fit). Different parameter sets can yield similar projections of numbers of cases through time as a function of the assumed time of the start of the outbreak (difficult to know with precision), the case reporting rate, and parameters such as the magnitude of transmission and duration of infection. Yet, in the same time frame (early time span), these different parameter sets yield different proportions of susceptible individuals (right hand plot, solid line: ‘true’ values based on the hypothetical simulated example (solid line in the first panel); dashed lines: the two different estimates, Fit1 and Fit2). While the differences between numbers of cases for the different scenarios is largely overlapping, the proportions susceptible are different, and thus, information on serology could be important for grounding model fitting because it provides clear discrimination between the different models described here. (Note that for simplicity, we assume SIR, dynamics, with no exposed class, and short term strong immunity). See https://labmetcalf.shinyapps.io/serol1/ to explore the dynamics.
References
MeSH terms
Substances
LinkOut - more resources
Full Text Sources
Miscellaneous
