. 2020 Aug 15;205(4):1147-1156.
doi: 10.4049/jimmunol.2000397. Epub 2020 Jul 17.

Isoform- and Cell Type-Specific Roles of Glycogen Synthase Kinase 3 N-Terminal Serine Phosphorylation in Liver Ischemia Reperfusion Injury

Affiliations

Isoform- and Cell Type-Specific Roles of Glycogen Synthase Kinase 3 N-Terminal Serine Phosphorylation in Liver Ischemia Reperfusion Injury

Ming Ni et al. J Immunol. .

Abstract

Glycogen synthase kinase 3 (Gsk3) α and β are both constitutively active and inhibited upon stimulation by N-terminal serine phosphorylation. Although roles of active Gsk3 in liver ischemia reperfusion injury (IRI) have been well appreciated, whether Gsk3 N-terminal serine phosphorylation has any functional significance in the disease process remains unclear. In a murine liver partial warm ischemia model, we studied Gsk3 N-terminal serine mutant knock-in (KI) mice and showed that liver IRI was decreased in Gsk3αS21A but increased in Gsk3βS9A mutant KI mice. Bone marrow chimeric experiments revealed that the Gsk3α, but not β, mutation in liver parenchyma protected from IRI, and both mutations in bone marrow-derived cells exacerbated liver injuries. Mechanistically, mutant Gsk3α protected hepatocytes from inflammatory (TNF-α) cell death by the activation of HIV-1 TAT-interactive protein 60 (TIP60)-mediated autophagy pathway. The pharmacological inhibition of TIP60 or autophagy diminished the protection of the Gsk3α mutant hepatocytes from inflammatory cell death in vitro and the Gsk3α mutant KI mice from liver IRI in vivo. Thus, Gsk3 N-terminal serine phosphorylation inhibits liver innate immune activation but suppresses hepatocyte autophagy in response to inflammation. Gsk3 αS21, but not βS9, mutation is sufficient to sustain Gsk4 activities in hepatocytes and protect livers from IRI via TIP60 activation.


Figures

Figure 1:
Figure 1:
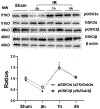
Liver Gsk3 α and β N-terminal serine phosphorylation profiles in response to IR. Liver tissues were harvested after 90m ischemia and 0-, 1-, or 6-hour reperfusion, as described in the Materials and Methods. Total tissue proteins were analyzed by Western blots with anti-phosphorylated Gsk3αS21, Gsk3βS9, total Gsk3 α and β and β-actin antibodies (upper panel). Average ratios of phosphorylated vs. total Gsk3 α and β were plotted (lower panel). Representative results of 2 independent experiments.
Figure 2:
Figure 2:
Liver IRI in Gsk3αS21A and/or Gsk3βS9A single and double mutant KI mice. WT and Gsk3 mutant KI mice were subjected to liver IR experiments, as described in the Materials and Methods. Liver IRI and inflammatory responses were evaluated at both 6h and 24h post reperfusion. (a) Average sALT levels and Suzuki scores of different experimental groups; (b) Representative liver histological pictures (Scale bar=200μM), (c) Average gene expression levels (ratios of target gene/HPRT) of different experiment groups. n=4-6/group. Representative results of 2 separate experiments. *p<0.05
Figure 3:
Figure 3:
Liver IRI in Gsk3αS21A mutant KI bone marrow chimeric mice. WT or Gsk3α mutant KI bone marrow chimeric mice, including WT-WT, WT-αKI, and αKI-WT, were generated and subjected to liver IR experiments, as described in the Materials and Methods. Liver injuries and inflammatory responses were evaluated at 6h post reperfusion. (a) Average sALT levels and Suzuki scores of different experimental groups, (b) Representative liver histological pictures, (Scale bar=200μM) (c) Average levels of inflammatory cytokine/chemokine gene expressions (ratios of target gene/HPRT) in different experimental groups. n=4-6/group. Representative results of 2 separate experiments. *p<0.05
Figure 4:
Figure 4:
TNF-α cytotoxicity in primary hepatocytes. Primary hepatocytes were isolated from WT and Gsk3α or β mutant KI mice, as described in the Materials and Methods. Cytotoxicity was induced by incubating cells with TNF-α in the presence of actinomycin D (ActD). Cell death was measured by LDH assay. Gsk3 inhibitor SB216763 or autophagy inhibitor 3-MA were added prior to the addition of ActD/TNF-α. Average percentages of cell death of different experimental groups were plotted. Representative results of at least 3 experiments. *p<0.05
Figure 5:
Figure 5:
Autophagy signaling pathways in primary hepatocytes in response to TNF-α. Primary hepatocytes were isolated from WT and Gsk3 α and β mutant KI mice, as described in the Materials and Methods. Cells were either unstimulated (-) or stimulated with TNF-α for 30m, 2h and 6h. Total cellular proteins were prepared and analyzed by Western blotting. Representative Western blots of phosphorylated forms and/or total of Gsk3α/β, TIP60, AMPK, S6K and LC3B I/II. Representative results of 3 independent experiments.
Figure 6:
Figure 6:
Hepatocyte autophagy induction by TNF-a, oxidative and ER stress. Primary hepatocytes were isolated from WT and Gsk3α or β mutant KI mice. Autophagy was induced by ER stressor Thapsigargin (Tg) or H2O2 or TNF-a, as described in the Materials and Methods. Autophagy was detected by labeling cells with CYTO-ID® Green Detection Reagent. Cell nuclei were stained with DAPI. Labeled cells were analyzed by fluorescent microscopy. (a) Representative images of autophagic vacuoles in control- and stimulated- hepatocytes of WT and Gsk3α or β mutant. Mean fluorescent intensity (MFI) of different experimental groups were plotted. (b) Hepatocytes were incubated with TNF-α in the absence or presence of a TIP60 inhibitor NU9056 (NU). Autophagy vacuoles and cell nuclei were detected as above. Representative images and MFI of different experimental groups were shown. Representative results of 3 separate experiments. Scale bar=100μM, *p<0.05.
Figure 7:
Figure 7:
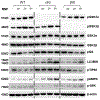
Autophagy signaling pathways in liver IRI. WT and Gsk3α or β mutant KI mice were subjected to liver IR experiments, as described in the Materials and Methods. Sham and IR (harvested at 6h post reperfusion) livers were analyzed by Western blotting. Representative Western blots of phosphorylated forms of TIP60, AMPK, S6K and total LC3B I/II and β-actin. Representative results of 3 independent experiments.
Figure 8:
Figure 8:
Liver autophagy induction by IR. Tissue sections were prepared from either sham or IR livers in WT or Gsk3a mutant KI mice treated with or without 3-MA, as described in the Materials and Methods. Autophagosomes were detected by electron microscopy. Representative images of each experimental groups were shown. Scale bar=20μM.
Figure 9:
Figure 9:
Inhibition of autophagy or TIP60 increases liver IRI in Gsk3α mutant KI, but not WT mice. WT and Gsk3a mutant KI mice were pre-treated with 3-MA or TIP60 inhibitor TH1834 (TIP60i) prior to the onset of liver IR, as described in the Materials and Methods. Liver IRI was evaluated at 6h post reperfusion. (a, c) Average serum ALT levels and Suzuki scores, and (b, d) Representative liver histological pictures of different experimental groups were shown. Representative results of at least 2 experiments. Scale bar=200μM, *p<0.05.
Figure 10.
Figure 10.
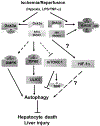
Gsk3 regulates multiple intracellular signaling pathways in hepatocytes in response to IR. Hypoxia and inflammatory stimuli trigger the N-terminal inhibitory phosphorylation of Gsk3α/β during liver IR, leading to decreased activation of TIP60 (S86) and AMPKα (T172), increased activation of mTORC1, and possibly higher levels of HIF-1α. These pathways are involved in autophagy and pathogenesis of liver IRI. Gsk3α S21A mutation spares the kinase from this inhibitory phosphorylation and sustains its kinase activity, leading to higher TIP60, AMPK, and lower mTORC1 activation. Gsk3β S9A mutation, on the other hand, is not sufficient to sustain its kinase activity in stimulation cells due to other inactivation mechanisms, e.g., S398 phosphorylation, ADP ribosylation, etc.

References

    1. Kaczorowski DJ, Tsung A, and Billiar TR. 2009. Innate immune mechanisms in ischemia/reperfusion. Front Biosci (Elite Ed) 1: 91–98. - PubMed
    1. Zhai Y, Busuttil RW, and Kupiec-Weglinski JW. 2011. Liver ischemia and reperfusion injury: new insights into mechanisms of innate-adaptive immune-mediated tissue inflammation. American journal of transplantation : official journal of the American Society of Transplantation and the American Society of Transplant Surgeons 11: 1563–1569. - PMC - PubMed
    1. Tsung A, Hoffman RA, Izuishi K, Critchlow ND, Nakao A, Chan MH, Lotze MT, Geller DA, and Billiar TR. 2005. Hepatic ischemia/reperfusion injury involves functional TLR4 signaling in nonparenchymal cells. J Immunol 175: 7661–7668. - PubMed
    1. Zhai Y, Shen X. d., O’Connell R, Gao F, Lassman C, Busuttil RW, Cheng G, and Kupiec-Weglinski JW. 2004. Cutting Edge: TLR4 Activation Mediates Liver Ischemia/Reperfusion Inflammatory Response via IFN Regulatory Factor 3-Dependent MyD88-Independent Pathway. The Journal of Immunology 173: 7115–7119. - PubMed
    1. Wu HS, Zhang JX, Wang L, Tian Y, Wang H, and Rotstein O. 2004. Toll-like receptor 4 involvement in hepatic ischemia/reperfusion injury in mice. Hepatobiliary Pancreat Dis Int 3: 250–253. - PubMed

Publication types

MeSH terms