. 2020 Jul 17;11(1):3598.
doi: 10.1038/s41467-020-17325-y.

A rare variant of African ancestry activates 8q24 lncRNA hub by modulating cancer associated enhancer

Affiliations

A rare variant of African ancestry activates 8q24 lncRNA hub by modulating cancer associated enhancer

Kaivalya Walavalkar et al. Nat Commun. .

Abstract

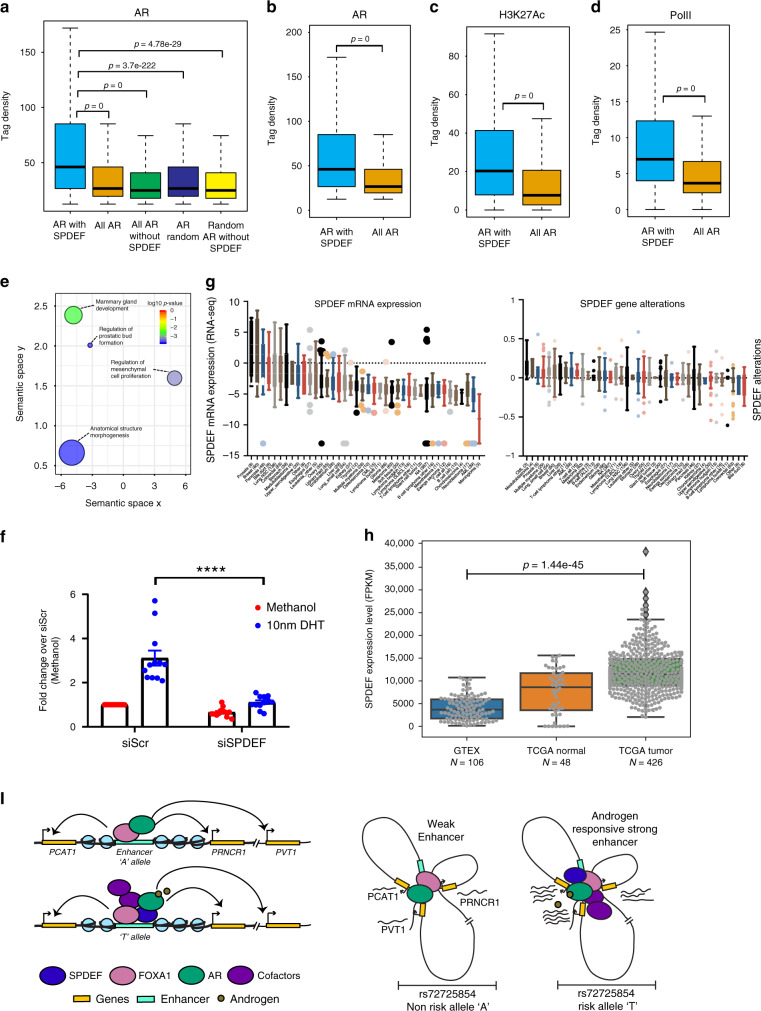
Genetic variation at the 8q24 locus is linked with the greater susceptibility to prostate cancer in men of African ancestry. One such African ancestry specific rare variant, rs72725854 (A>G/T) (~6% allele frequency) has been associated with a ~2-fold increase in prostate cancer risk. However, the functional relevance of this variant is unknown. Here we show that the variant rs72725854 is present in a prostate cancer-specific enhancer at 8q24 locus. Chromatin-conformation capture and dCas9 mediated enhancer blocking establish a direct regulatory link between this enhancer and lncRNAs PCAT1, PRNCR1 and PVT1. The risk allele ('T') is associated with higher expression of PCAT1, PVT1 and c-myc in prostate tumors. Further, enhancer with the risk allele gains response to androgen stimulation by recruiting the transcription factor SPDEF whereas, non-risk alleles remain non-responsive. Elevated expression of these lncRNAs and c-myc in risk allele carriers may explain their greater susceptibility to prostate cancer.


Conflict of interest statement

The authors declare no competing interests.

Figures

Fig. 1
Fig. 1. rs72725854 lies in a prostate cancer-specific enhancer.
a UCSC genome browser snapshot at rs72725854 region and its linked SNP rs114798100 showing ChIP-seq tracks for H3K27Ac, PolII, AR, Med1, and FOXA1. b Graph showing DHS signal around the rs72725854 region in various cell lines. c Genome browser snapshots show ChIP-seq signal of FOXA1 in prostate tumor, LNCaP cells; DHS and H3K27ac in LNCaP and prostate epithelial cells (PrEC). d IGV genome browser snapshot shows ATAC-seq signal around rs72725854 region in seven prostate adenocarcinoma tumor samples with two replicates each from TCGA.
Fig. 2
Fig. 2. Risk allele sensitizes the enhancer to androgens.
a The graph depicts relative luciferase activity over Renilla for the empty plasmid and the plasmid harboring the rs72725854 enhancer region in LNCaP cells. b The graph depicts the fold change in reporter activity of empty plasmid, “G” and “T” allele over “A” allele in LNCaP cells. Error bars denote SEM from multiple biological replicates (n > 3) in a and b. c UCSC genome browser snapshot around the rs72725854 region with ChIP-seq tracks for AR in tumors, healthy individuals and LNCaP cells and, FOXA1 in tumors and LNCaP cells. d The graph depicts the relative change over Renilla for the empty plasmid and plasmids harboring the different alleles “A”, “G”, and “T” of rs72725854 enhancer in LNCaP cells grown in charcoal stripped media for three days including the treatment with methanol or 10 nM DHT for 16 h. Error bars denote SEM from multiple biological replicates (n > 3). e q-RT PCR analysis showing eRNA expression at rs72725854-harboring enhancer upon 10 nM DHT treatment for 16 h in LNCaP cells. Error bars denote SEM from three biological replicates. p-values were calculated by Student’s two-tailed unpaired t-test in a, b, d, and e ****p < 0.0001, nsp > 0.05. Source data are provided as a Source Data file.
Fig. 3
Fig. 3. The enhancer physically interacts with lncRNA promoters.
a The TAD structure overlaid with gene annotations at the 8q24 region as seen from the HiC data in LNCaP cells. b Plots show 4C on the enhancer viewpoint using 4C-ker pipeline. c 4C plots from PCAT1 promoter viewpoint and d long-range interaction from 4C at PVT1 viewpoint, note the interactions marked by arrows. Tracks below the 4C plots in bd show the ChIP-seq signal of AR and H3K27ac at the regions. e Comparative HiC in LNCaP and T47D showing the differential interactions at the 8q24 locus in the two cell lines. The red pixels show higher interactions in LNCaP and the blue ones show higher interactions in T47D, the heatmap is overlaid with gene annotations and TADs boundaries. 4C data are provided as source data file.
Fig. 4
Fig. 4. The enhancer transcriptionally regulates the lncRNA hub.
a Expression level of PCAT1 is plotted against the DHS intensity at rs72725854 regions across eight cell lines from ENCODE data. b Expression level of PCAT1 is plotted against the nascent-RNA signal derived from GRO-seq in LNCaP and MCF7 cell lines. c q-RT-PCRs show the relative fold changes of pre-mRNAs of various lncRNAs and MYC upon constitutive CRISPR blocking of the rs72725854 region with scr or specific gRNAs in LNCaP cells using dCas9-KRAB. Error bars denote SEM from three biological replicates. d, e Expression of PCAT1, PVT1, and MYC in patient tumor samples with different alleles of rs72725854 namely; AA, AT, and TT at pan-cancer level (from PCAWG) (d) and in prostate adenocarcinomas (from PCAWG) (e). Each dot represents a sample and the color indicates relative copy number status of the gene (0 is neutral, 1 is amplified, 2 is high-level amplified, −1 is deleted, −2 is deep deletion). The boxplots in d and e depict the minima (Q1-1.5*IQR), first quartile, median, third quartile, and maxima (Q3 + 1.5*IQR). f The survival analysis of prostate cancer patients exhibiting genetic alteration (copy number or mutations) vs. no alteration in PCAT1 (top), PVT1 (center) and MYC (bottom) genes irrespective of the genotype at rs72725854. The number of patients at each time interval in the cases with alteration (with) and the cases without alteration (without) of the respective gene is given below each plot. The data shown here were obtained from three different prostate cancer cohorts (see “Methods” and Supplementary Fig. 3f). p-values were calculated by Student’s two-tailed unpaired t-test in c. *p < 0.05, **p < 0.01 and nsp > 0.05. The p-values in f were calculated by log-rank test. Source data are provided as a Source Data file.
Fig. 5
Fig. 5. Risk allele increases prostate cancer risk by gain of SPDEF.
a Position weight matrix analysis shows a gain of strong motif of SPDEF in the risk allele “T” of rs72725854. b EMSA showing differential affinities of the risk “T” and non-risk “A” alleles of rs72725854 for SPDEF. The experiment was performed thrice. c The graph depicting FLAG-SPDEF ChIP-qPCRs on plasmids harboring different alleles of rs72725854, PCAT1 intron, PVT1 promoter, and two negative controls in LNCaP cells overexpressing 3xFLAG-SPDEF. d Immunoblot with anti-SPDEF, FLAG, and GAPDH antibodies showing the levels of SPDEF and GAPDH proteins upon overexpression and the knockdown of the SPDEF protein by 3xFLAG-SPDEF and on-target siRNA pools, respectively. The experiment was performed thrice. e Reporter assays show the alterations in activities of non- risk and risk alleles upon specific knockdown of SPDEF. f Reporter assays show the alterations in reporter activities of non-risk and risk alleles upon SPDEF overexpression. g Reporter assays show the change in the luciferase activity in a dose-dependent manner when the percentage of the plasmid with the “T” allele increases over “A” allele in the pool of “A” and “T” alleles. h Competition reporter assays show the alterations in reporter activity of “T allele-Luc” upon dose-dependent (0, 50, 150, 250, 350 ng) overexpression of “A (Non-Luc)” or “T(Non-Luc)” plasmids. i Graph depicting qPCR signals on the “A” and “T” plasmids in DNase I hypersensitivity assays performed in LNCaP cells (n = 2). Error bars denote SEM from three biological replicates in c, n > 3 replicates in eh. p-values were calculated by Student’s two-tailed unpaired t-test in c, e, f and g. *p < 0.05, **p < 0.01, ***p < 0.001, ****p < 0.0001, nsp > 0.05. Source data are provided as a Source Data file.
Fig. 6
Fig. 6. SPDEF collaborates with AR to induce prostate-specific genes.
a Tag density plots show the relative levels of AR on various combinations of AR and SPDEF peaks mentioned on X axis. Tag density plots suggest a higher density of AR (b) H3K27ac (c), and PolII (d) occupancy on the AR-SPDEF co-occurring peaks as compared to all AR peaks. The boxplots in ad depict the minima (Q1-1.5*IQR), first quartile, median, third quartile and maxima (Q3 + 1.5*IQR). p-values were calculated by Wilcoxon two-sided rank sum test in ad. e GO term analysis on genes nearby SPDEF-AR co-occurring peaks indicates that these regions are involved in the development programs including prostate. Position of GO terms on the X and Y axis represents the relative closeness between GO terms based on GO graph structure. Size of circles represents the frequency of a particular GO term in the GO database. Color of the circle represents multiple test corrected p-value, see legend on the top right. f Reporter assays showing the change in DHT response of the “T” allele upon SPDEF knockdown. Error bars denote SEM from n > 3 biological replicates. p-value was calculated by Student’s two-tailed unpaired t-test (****p < 0.0001). g SPDEF RNA expression and alterations across different cell lines from CCLE data sets. h SPDEF RNA expression levels plotted across different data sets, prostate normal tissue from GTEx, prostate adenocarcinomas and adjacent normal tissues from TCGA. p-value was calculated using Wilcoxon two-sided rank sum test. i Model depicts that the rs72725854 region functions like an enhancer even in the non-risk allele. The enhancer exhibits closer proximity to the lncRNA genes PCAT1, PRNCR1, and PVT1. Enhancer with risk allele recruits SPDEF, which in turn brings AR-activating machinery in response to DHT, resulting in the hyper-activation of the enhancer. Full enhancer activation robustly induces expression of target lncRNAs and MYC promoters that are already in 3D proximity. lncRNA and MYC activation potentially predisposes these individuals to prostate cancer. Source data are provided as a Source Data file.

References

    1. Freedman ML, et al. Admixture mapping identifies 8q24 as a prostate cancer risk locus in African-American men. Proc. Natl Acad. Sci. USA. 2006;103:14068–14073. - PMC - PubMed
    1. Haiman CA, et al. Multiple regions within 8q24 independently affect risk for prostate cancer. Nat. Genet. 2007;39:638–44. - PMC - PubMed
    1. Matejcic M, et al. Germline variation at 8q24 and prostate cancer risk in men of European ancestry. Nat. Commun. 2018;9:4616. - PMC - PubMed
    1. de Bakker PI, et al. Transferability of tag SNPs in genetic association studies in multiple populations. Nat. Genet. Nov. 2006;38:1298–303. - PubMed
    1. Han Y, et al. Prostate cancer susceptibility in men of African ancestry at 8q24. JNCI. 2016;108:djv431. - PMC - PubMed

Publication types

Substances