. 2020 Jul 17;11(1):3588.
doi: 10.1038/s41467-020-17339-6.

Tumors induce de novo steroid biosynthesis in T cells to evade immunity

Affiliations

Tumors induce de novo steroid biosynthesis in T cells to evade immunity

Bidesh Mahata et al. Nat Commun. .

Abstract

Tumors subvert immune cell function to evade immune responses, yet the complex mechanisms driving immune evasion remain poorly understood. Here we show that tumors induce de novo steroidogenesis in T lymphocytes to evade anti-tumor immunity. Using a transgenic steroidogenesis-reporter mouse line we identify and characterize de novo steroidogenic immune cells, defining the global gene expression identity of these steroid-producing immune cells and gene regulatory networks by using single-cell transcriptomics. Genetic ablation of T cell steroidogenesis restricts primary tumor growth and metastatic dissemination in mouse models. Steroidogenic T cells dysregulate anti-tumor immunity, and inhibition of the steroidogenesis pathway is sufficient to restore anti-tumor immunity. This study demonstrates T cell de novo steroidogenesis as a mechanism of anti-tumor immunosuppression and a potential druggable target.


Conflict of interest statement

In the last three years, S.A.T has consulted for Genentech and Roche, and is a member of Scientific Advisory Boards at Biogen, GlaxoSmithKline and Foresite Labs. The remaining authors declare no competing interests.

Figures
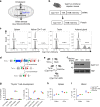
Fig. 1
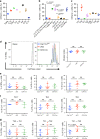
Fig. 1. Generation of a de novo steroidogenesis reporter and conditional knockout mice.
a. Schematic of de novo steroidogenesis pathway.  Cyp11a1 is the first and a key rate-limiting enzyme of the pathway. b. Cyp11a1-reporter mice synthesize a fusion protein that self-cleaves due to presence of a T2A peptide and dissociates into Cyp11a1 and H2B-mCherry. c Cyp11a1-mCherry reporter mice report Cyp11a1 expression accurately. Single-cell suspensions of tissues and naïve splenic CD4+ T cells were analyzed by flow cytometry. Gating: All cells>Singlets>Live cells>Cyp11a1-mCherry. Representative of three independent experiments; each experiment contains 3–4 mice. d, e Generation of a Cyp11a1 conditional knockout (cKO) mice. Schematic presentation of the The targeting allele (d) and T cell-specific Cyp11a1 cKO (Cd4Cre;Cyp11a1fl/fl) generation (e). f Cyp11a1 knockout efficiency of Cre recombinase in T cells. Splenic naïve T helper cells from cKO (Cd4-Cre;Cyp11a1fl/fl) mice or control mice (wild type and Cd4-Cre) were activated under Th2 differentiation condition, and analyzed for Cyp11a1 protein expression by western blot. TATA-binding protein (TBP) used as loading control. g Normal thymic development of T cells in Cyp11a1 cKO. Thymus was harvested from Cyp11a1 cKO and control (Cd4-Cre and Cyp11a1fl/fl) mice, dissociated into single-cell suspension, stained with fluorescent conjugated anti-CD4, CD8, B220, CD45, CD25, and CD44 antibodies, and analyzed by flow cytometry. Gating: all cells>Singlets>Live cells>CD45+B220>CD4, CD8 (left panel). CD4+CD8+ cells represent double positive (DP) stage, CD4+CD8 and CD4CD8+ cells represent single positive (SP) stage, CD4CD8 cells represent double negative (DN) stage. DN cells of the left panel were gated to show CD25 and CD44 expression to identify DN1 (CD25CD44+), DN2 (CD25+CD44+), DN3 (CD25+CD44), and DN4 (CD25CD44). Error bars represent mean with s.d., N = 4 biologically independent animals. (h, i). Flow cytometric analysis shows normal distribution of Cyp11a1 cKO T cells (CD4+ and CD8+) in the peripheral blood and spleen. Error bars represent mean with s.d., N = 4 biologically independent animals.
Fig. 2
Fig. 2. Analysis of Cyp11a1-expressing T cells using Cyp11a1 reporter and cKO mice.
a Splenic naïve CD4+ T cells from Cyp11a1-mCherry reporter mice were purified by negative selection; activated in the anti-CD3e/anti-CD28 antibody coated plates in the presence of cytokines for 3 days, rested for 2 days, restimulated 6 h, and Cyp11a1-mCherry expression was analyzed by flow cytometry. N = 3 (except IL33 where N = 2). b IL12 inhibits Cyp11a1 expression. Splenic naïve CD4+ T cells from Cyp11a1-mCherry reporter mice were activated as mentioned above (a) for 5 days and Cyp11a1-mCherry expression was analyzed by flow cytometry. N = 6. c Splenic naïve CD4+ and CD8+ T cells from Cyp11a1-mCherry reporter mice were activated in vitro under Th1, Th2, Th9, Th17, Tfh, Treg, Tc1, and Tc2 differentiation conditions (activation 3 days, resting 2 days), and Cyp11a1-mCherry expression was analyzed by flow cytometry. N = 6 (Tc1, Tc2), N = 4 (Th1, Th9, Tfh), and N = 5 (Treg, Th17). d Splenic naïve CD4+ T cells were purified from Cyp11a1 cKO, Cd4-Cre, and Cyp11a1fl/fl mice, stained with CellTrace Violet, activated in vitro, and cell proliferation was determined by a flow cytometric dye decay assay. Representative cell proliferation profiles are shown in the left panel and a comparison of the cell division index is shown in right panel. N = 9. e Splenic naïve CD4+ T cells were activated in vitro in the absence of any exogenous cytokine or cytokine-neutralizing antibody, and cytokine expression was determined by flow cytometry. N = 6. f Splenic naïve CD4+ T cells were activated in vitro under Th17 or Th2 differentiation conditions, and cell type-specific signature cytokine expression was determined by flow cytometry. N = 3 (Th17), N = 6 (Th2). g Splenic naïve CD4+ T cells were activated in vitro under Th1 or Th2 differentiation condition. After 3 days Th1 cells were allowed to differentiate under Th2-polarizing conditions (Th1 > Th2), and Th2 cells were allowed to differentiate under Th1-polarizing conditions (Th2 > Th1). Th1 or Th2-specific cytokine expression was determined by flow cytometry. N = 6. All error bars in this figure represent mean with s.d. P-value was calculated using unpaired two-tailed t-test. Representative of three independent experiments. N represents biologically independent animals.
Fig. 3
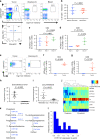
Fig. 3. Tumors induce Cyp11a1 expression in T cells in vivo.
a B16-F10 cells were injected subcutaneously into the Cyp11a1-reporter mice. After 12 days brachial lymph node (LN), blood, and tumor tissues were analyzed by flow cytometry. Gating strategy: Singlets>Live cells>CD45,Cyp11a1-mCherry. N = 5. CD45+Cyp11a1-mCherry+ cells were further gated to show T helper cell (CD4+CD3e+) expression of Cyp11a1. b Splenic cells were purified from tumor-bearing Cyp11a1-reporter mice, and restimulated in vitro using PMA/ionomycin and analyzed by flow cytometry. N = 9. c, d B16-F10 cells were injected subcutaneously into the Cyp11a1-mCherry reporter mice. After 5, 7, and 12 days tumor tissues were analyzed by flow cytometry to detect the CD4+ T cells (c), CD8+ T cells (d) N = 4. All cell>Singlets>Live cell>CD45+>CD4+CD3e+ or CD8+CD3e+. eg EO771 cells were injected into the mammary fat pad of Cyp11a1-reporter mice. After 15 days, tumor tissues and tumor-draining LN were analyzed by flow cytometry to detect the Cyp11a1-mCherry expression in CD4+ T cells (e, f) CD8+ T cells (g). Gating: All cell>Singlets>Live cell>CD45+>CD4+TCRb+ or CD8+TCRb+. e Representative FACS profile of Cyp11a1+CD4+ T cells. f, g Representative graphical presentation of one experiment showing Cyp11a1-expressing CD4 and CD8 T cells. N = 4. h B16-F10 tumor-infiltrating leukocytes (TIL) and splenocytes were purified from tumor-bearing mice on post-inoculation day-12, cultured for 48 h, and the supernatant was analyzed by ELISA to measure pregnenolone. N = 12, pooled analysis of three independent experiments. i Metastasized lungs were harvested 10 days post-B16-F10 intravenous injection in C57BL/6 mice, dissociated into single-cell suspension, cultured for 48 h, and the supernatant was analyzed by ELISA. Naïve uninfected lungs (normal lung) were used as control. N = 6, pooled analysis of two independent experiments. j Hierarchical clustering of steroidogenic genes and IL4 mRNA expression across 44 melanoma patient samples (GEO: GSE19234). k Schematics showing glucocorticoid synthesis pathway. l Frequency distribution histogram showing CYP11A1 mRNA expression (normalized read counts, log10 scale) across 22 melanoma patients’ tumor-infiltrating CD4+ T cells (EGAD00001000325). Individual data points for CYP11A1 expression are shown in Supplementary Fig. 3i. All error bars in this figure represent mean with s.d. P-values were calculated by unpaired two-tailed t-test. N represents biologically independent animals.
Fig. 4
Fig. 4. Revealing gene expression identity of intratumoral Cyp11a1+ T cells by scRNAseq.
a, b UMAP visualization of the tumor-infiltrating T cells (a) with annotations of the clusters (b). Tc1 represents type-1 CD8+ T cells, Tc2 represents type-2 CD8+ T cells, and Th2 represents type-2 CD4+ T cells. c, d mCherry protein expression accurately reports Cyp11a1 mRNA expression. Cyp11a1-mCherry protein expression according to the flow cytometry (FACS) data (c). Cyp11a1 mRNA expression in the scRNA-seq data (d). e Expression of cell-type-specific signature genes that were used to annotate the clusters. f Determination of Cyp11a1 locus control region. Open chromatin regions were identified by ATAC-seq of T helper cells. In vitro generated Th2 and Th17 cells were used as positive control. Naïve and Th1 cells were used as negative control. Gata3 ChIP-seq data were analyzed to determine the binding site. The open chromatin region where Gata3 occupy is highlighted blue and considered as locus control region.
Fig. 5
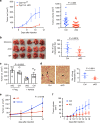
Fig. 5. Ablation of T cell steroidogenesis restricts experimental tumor growth and metastasis.
a Left-panel: B16-F10 subcutaneous tumor growth curve assessed in T cell-specific Cyp11a1 cKO (cKO) and Cd4-Cre control mice. N = 5. Representative of four independent experiments. Right panel: graphical presentation of end-point tumor volume. N = 20 (ctrl), 23 (cKO). Pooled data of four independent experiments. Each point represents an individual animal. Error bars represent mean ± s.e.m., unpaired two-tailed t-test. b Left panel: Representative photograph of pulmonary metastatic foci produced 10 days after tail vein injection of B16-F10 cells in cKO and control (Cre and WT) mice. N = 5. Right panel: graphical presentation of the numbers of lung metastatic foci. N = 14 (ctrl), 16 (cKO), pooled data of three independent experiments, each point represents an individual animal, error bars represent mean with s.d. Unpaired two-tailed t-test. c cKO and Cd4-Cre control mice were injected with B16-F10 cells. Pregnenolone or vehicle (DMSO) applied topically at the primary tumor site every 48 h. Tumor volume was measured at the end-point at day 12. N = 5. Each point represents an individual animal. Error bars represent mean ± s.e.m. P-value was calculated by one-way ANOVA with Tukey Post hoc test. d Representative hematoxylin and eosin stained histologic photograph of pulmonary metastatic foci produced 10 days after tail vein injection of EO771 cells in Cyp11a1 cKO and Cyp11a1fl/fl mice. Graphical presentation of the numbers of lung metastatic foci (right panel). N = 10. Error bars represents mean with s.d. Unpaired two-tailed t-test. Representative of two independent experiments. e B16-F10 cells were injected subcutaneously in C57BL/6 mice with or without Cyp11a1 inhibitor aminoglutethimide (AG). AG treatment was continued with a 48-h interval. N = 5. Error bars represent mean ± s.e.m. Two-way ANOVA. Representative of two independent experiments. f EO771 cells were injected into the mammary fat pad in C57BL/6 mice with or without Cyp11a1 inhibitor AG. AG treatment was continued with a 48-h interval. N = 5. Error bars represent mean ± s.e.m. One experiment. In this figure, N represents biologically independent animals.
Fig. 6
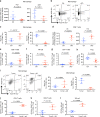
Fig. 6. Inhibition of T cell steroidogenesis stimulates anti-tumor immunity.
ah Comparing Cyp11a1 cKO and Cd4-Cre control mice with B16-F10 cells injected subcutaneously. Representative of three independent experiments. a Tumor-infiltrating macrophages (LinCD11b+) were purified by cell sorting at day 12. Arg1 and Tgfβ1 mRNA expression was quantified by RT-qPCR, with mRNA expression level normalized by Gapdh mRNA expression. N = 6. b, c Tumor-infiltrating macrophages (LinCD11b+F4/80+) analyzed by flow cytometry at day 12 to examine iNOS and Arg1 expression. Representative FACS profile of the expression (b). Representative graphical representation of one experiment (c). N = 5. d Tumor-infiltrating CD3e+CD8+ T cells purified by cell sorting at day 12, reactivated ex vivo, and Ifnγ and Tnfα mRNA expression quantified by RT-qPCR, with mRNA expression level normalized by Rplp0 expression. N = 6. e Cytotoxic T-lymphocyte degranulation assay. CD107a/LAMP1 expression on tumor-infiltrating CD8+ T cells was analyzed by flow cytometry after 12 days post-inoculation of B16-F10 cells. N = 8 (ctrl), 9 (cKO) Gating: All cells>singlets>live cells>CD8+ T cell>CD107a. f NK cell degranulation assay by measuring CD107a/LAMP1 expression on tumor-infiltrating NK cells. N = 8 (ctrl), 9 (cKO). Gating: All cells>singlets>live cells>NK cells>CD107a. g CD4+ T cell degranulation assay by measuring CD107a/LAMP1 expression on CD4+ T cells. N = 8. Gating: All cells>singlets>live cells>CD4+ T cell>CD107a. h Flow cytometric analysis to show the changes in B16-F10 subcutaneous tumor-infiltrating Treg (CD4+CD3e+FoxP3+) populations upon Cyp11a1 deletion. N = 9. il Comparing immunophenotype in Cyp11a1 inhibitor, AG, treated and untreated mice with B16-F10 cells injected subcutaneously. All are representative of two independent experiments. i Representative FACS profile to show iNOS and Arg1 expression in tumor-infiltrating CD45+LinCD11b+F4/80+ macrophages (left panel). Graphical presentation the iNOS and Arg1 expression of a representative experiment (right panel). N = 5. jl CD107a/LAMP1 expression on CD4+ T cells (j), CD8+ T cells (k) and NK cells (l) was analyzed by flow cytometry after 12 days post-inoculation of B16-F10 cells. N = 4 (ctrl), 3 (cKO). Gating: All cells>singlets>live cells>CD4+ or CD8+ T or NK cells>CD107a. In this figure, all error bars represent mean with s.d. P-value was calculated by unpaired two-tailed t-test. N represents biologically independent animals.
Fig. 7
Fig. 7. Graphical abstract of the discovery.
T cell-mediated de novo steroidogenesis in the tumor microenvironment promotes tumor growth by inhibiting anti-tumor immunity, in part by inducing M2 phenotype in macrophages and suppressing T and NK cell function. Genetic deletion of Cyp11a1 or pharmacologic inhibition of Cyp11a1 activity stimulates anti-tumor immunity by increasing the number of M1 macrophages and functional T cells, and decreasing the number of regulatory T cells, M2 macrophages.

References

    1. Miller WL, Auchus RJ. The molecular biology, biochemistry, and physiology of human steroidogenesis and its disorders. Endocr. Rev. 2011;32:81–151. - PMC - PubMed
    1. Miller WL. Steroidogenesis: unanswered questions. Trends Endocrinol. Metab. 2017;28:771–793. - PubMed
    1. Belelli D, Lambert JJ. Neurosteroids: endogenous regulators of the GABA(A) receptor. Nat. Rev. Neurosci. 2005;6:565–575. - PubMed
    1. Slominski A, et al. Steroidogenesis in the skin: implications for local immune functions. J. Steroid Biochem. Mol. Biol. 2013;137:107–123. - PMC - PubMed
    1. Vacchio MS, Papadopoulos V, Ashwell JD. Steroid production in the thymus: implications for thymocyte selection. J. Exp. Med. 1994;179:1835–1846. - PMC - PubMed

Publication types

Substances