. 2020 Jul 17;10(1):11885.
doi: 10.1038/s41598-020-68568-0.

Experimental determination and ray-tracing simulation of bending losses in melt-spun polymer optical fibres

Affiliations

Experimental determination and ray-tracing simulation of bending losses in melt-spun polymer optical fibres

Birgit Lustermann et al. Sci Rep. .

Abstract

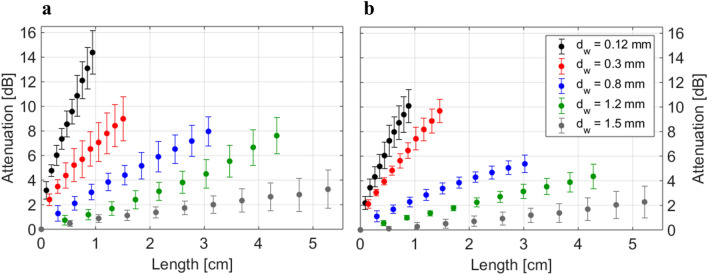
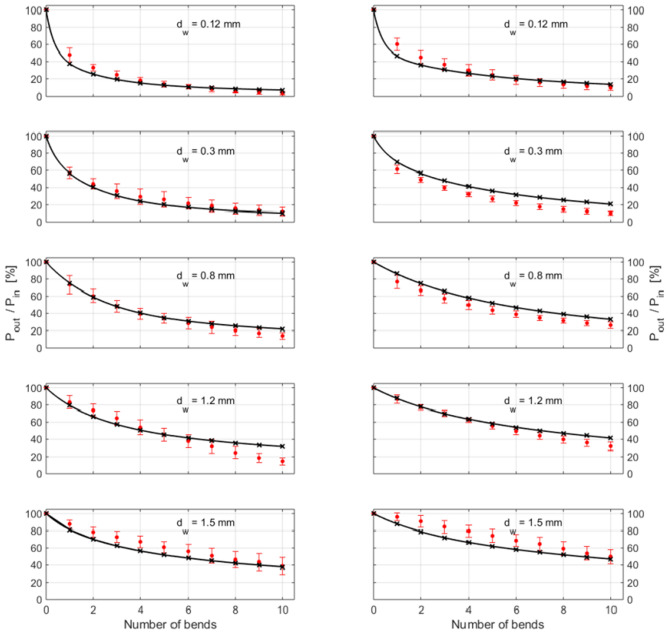
The damping properties and specifically the bend losses of polymer optical fibres (POFs) have so far only been documented by experimental work, investigating bending parameters such as bending radius, length, and distance of the bends. Even though damping mechanisms and causes are well-known, no simple, generally valid formula exists. Here, a simulation technique is shown that allows producing an optical model for any bending geometries of melt-spun polymer optical fibres. The developed model takes all relevant loss mechanisms into account, especially regarding the scattering losses at the interface of core and cladding as well as those of the cladding-air interface. The latter is caused by interfacial roughness for which experimental data have been obtained by atomic force microscopy measurements. To show the validity of the simulation, the model is compared to experimental results for several fibres and a variety of geometries. The variance between model and experimental data is low (S < 4.6%). The model not only contributes to improving the understanding of the optical properties of POFs, but it also has direct applicability to the design of photonic textile sensors for medicine, where the fibres are incorporated with small bending radii.


Conflict of interest statement

The authors declare no competing interests.

Figures

Figure 1
Figure 1
Attenuation D of POFs 1143 (a) and 1144 (b) as a function of fibre length for different diameters of the bending cylinder dw. Data are shown as mean ± standard deviation (n = 10).
Figure 2
Figure 2
Exemplary atomic force microscopy (AFM) analysis of fibre 1143 at one location. (a) Full range AFM image (left: height, right: amplitude). (b) Zoom-in of the height and amplitude AFM images in the indicated (5 × 10) µm2 section. The depicted height mode AFM images were further treated by a median of differences row alignment. (c) PSD along x- and y-directions for fibre 1143, together with the corresponding ABC-fit curves. The data for fibre 1144 may be found in Figure S1.
Figure 3
Figure 3
Measured data for the straight fibres (red circles: mean with standard deviation, n = 10) compared to simulation results for various values of the rms roughness of the core-cladding interface Sq = [0 … 25] nm (blue dashed lines). The solid black line represents the best interpolation between the simulation for Sq = 10 nm and Sq = 15 nm based on a least-square fit for the respective fibre: 1143 (a), 1144 (b).
Figure 4
Figure 4
(a) Ray-tracing model with 10 bends (not to scale). (b) Ray paths within a bent fibre for several entry points with the same polar angle θ.
Figure 5
Figure 5
Comparison of measured and simulated data for all bending radii, for both fibres (left: fibre 1143; right: fibre 1144). Circles with error bars: measured data (n = 10); crosses: ray-tracing results; solid lines: fitting according to Eq. (4).
Figure 6
Figure 6
Comparison of the experimental bend losses (red circles: mean with s.d., n = 10; red line only to guide the eye) of fibre 1143 for three wire diameters dw with models incorporating different loss mechanisms. Pink line: model incorporating only Fresnel losses; green line: model incorporating Fresnel losses and core absorption; brown line: model incorporating Fresnel losses and core and cladding absorption; blue line: model incorporating all previous mechanisms plus the scattering at the core-cladding interface; black line: complete model incorporating all 5 loss mechanisms.

References

    1. Kröplin P, et al. In: Polymer Optical Fibres, Ch.11. Bunge C-A, Gries T, Beckers M, et al., editors. Sawston: Woodhead Publishing; 2017. pp. 349–400.
    1. Quandt BM, et al. Body-monitoring and health supervision by means of optical fiber-based sensing systems in medical textiles. Adv. Healthcare Mater. 2015;4:330–355. doi: 10.1002/adhm.201400463. - DOI - PubMed
    1. Quandt BM, Boesel LF, Rossi RM. POF in healthcare: solutions, applications and implications—a perspective. Polym. Int. 2018;67:1150–1154. doi: 10.1002/pi.5511. - DOI
    1. Quandt BM, et al. Body-monitoring with photonic textiles: a reflective heartbeat sensor based on polymer optical fibers. J. R. Soc. Interface. 2017;14:20170060. doi: 10.1098/rsif.2017.0060. - DOI - PMC - PubMed
    1. Reifler F, et al. Polymer optical fibers for textile applications—bicomponent melt spinning from cyclic olefin polymer and structural characteristics revealed by wide angle X-ray diffraction. Polymer. 2014;55:5695–5707. doi: 10.1016/j.polymer.2014.08.071. - DOI