. 2020 Jul 17;10(1):11913.
doi: 10.1038/s41598-020-68639-2.

Ascites-induced compression alters the peritoneal microenvironment and promotes metastatic success in ovarian cancer

Affiliations

Ascites-induced compression alters the peritoneal microenvironment and promotes metastatic success in ovarian cancer

Marwa Asem et al. Sci Rep. .

Abstract

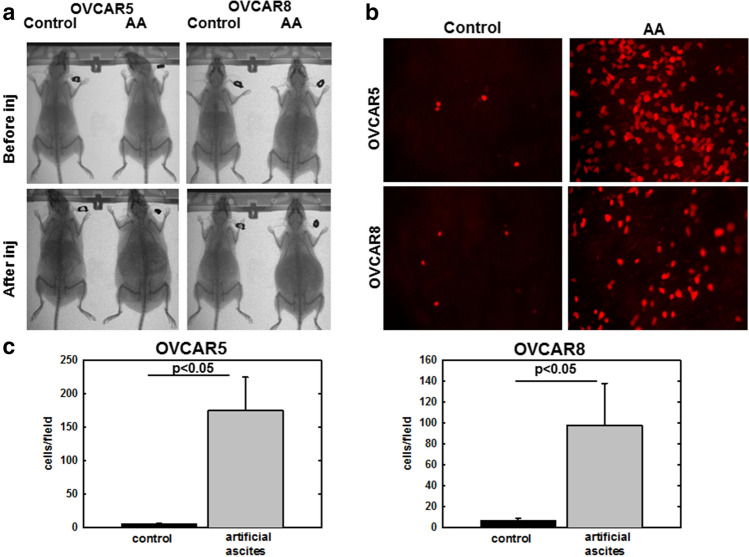
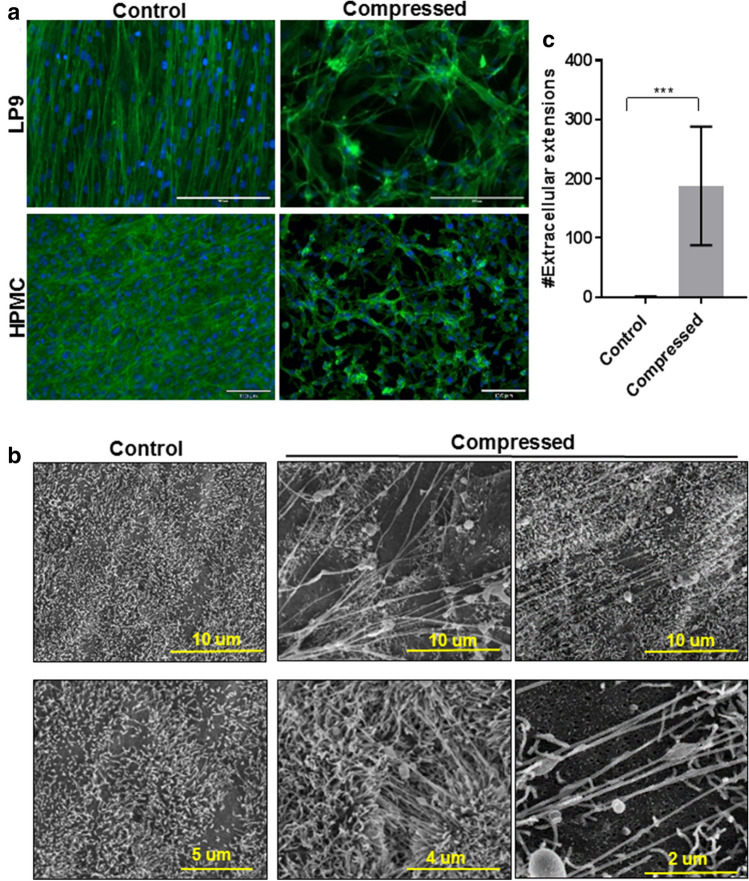
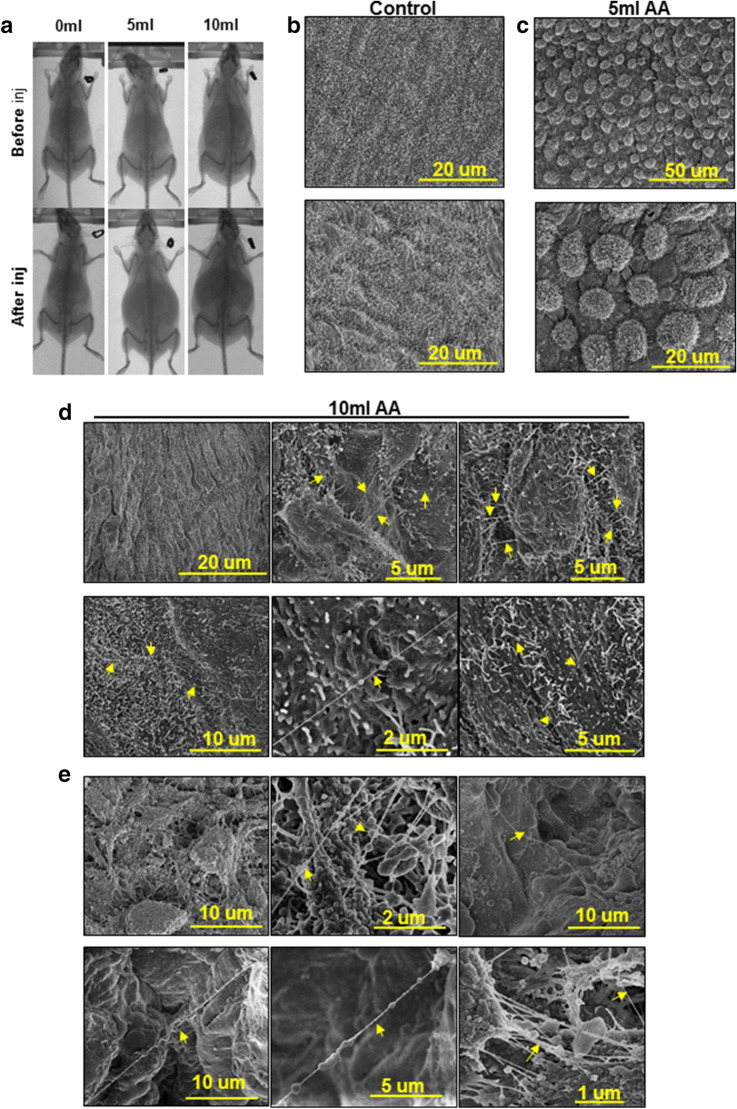
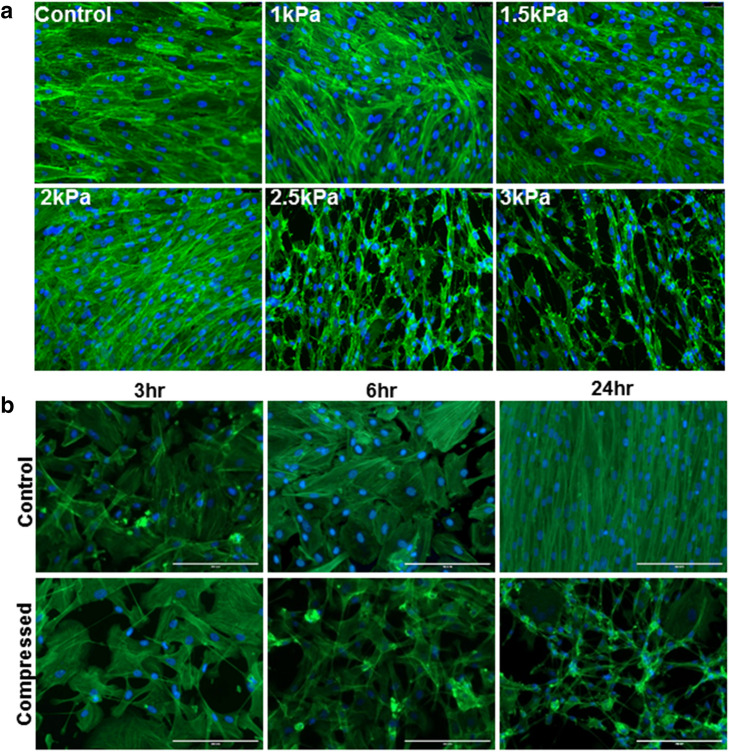
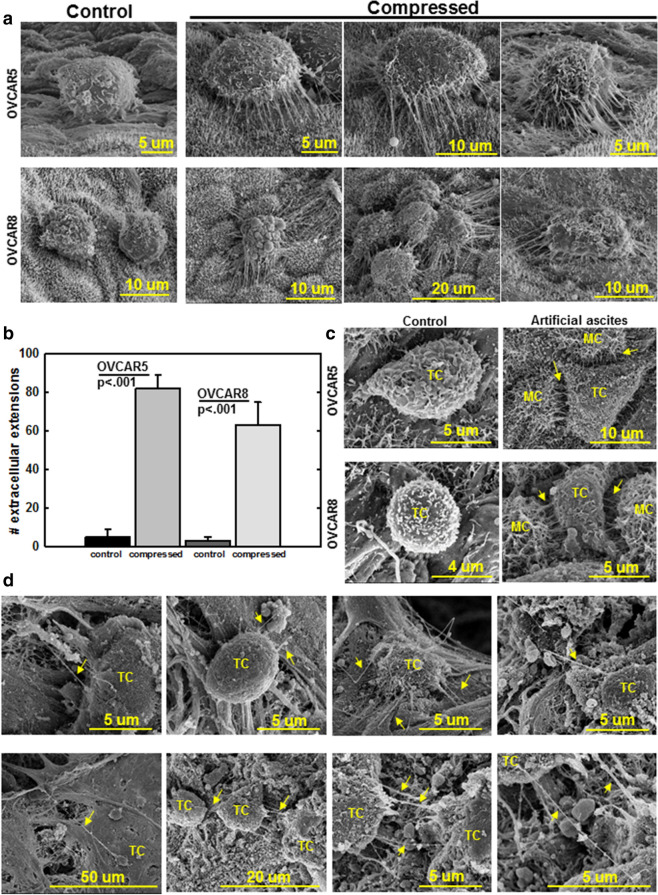
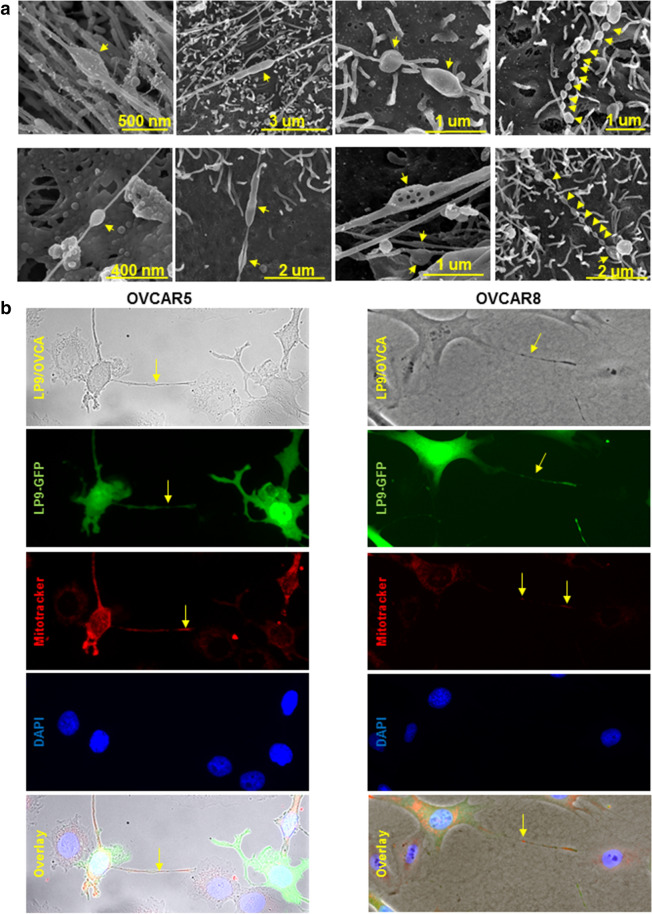
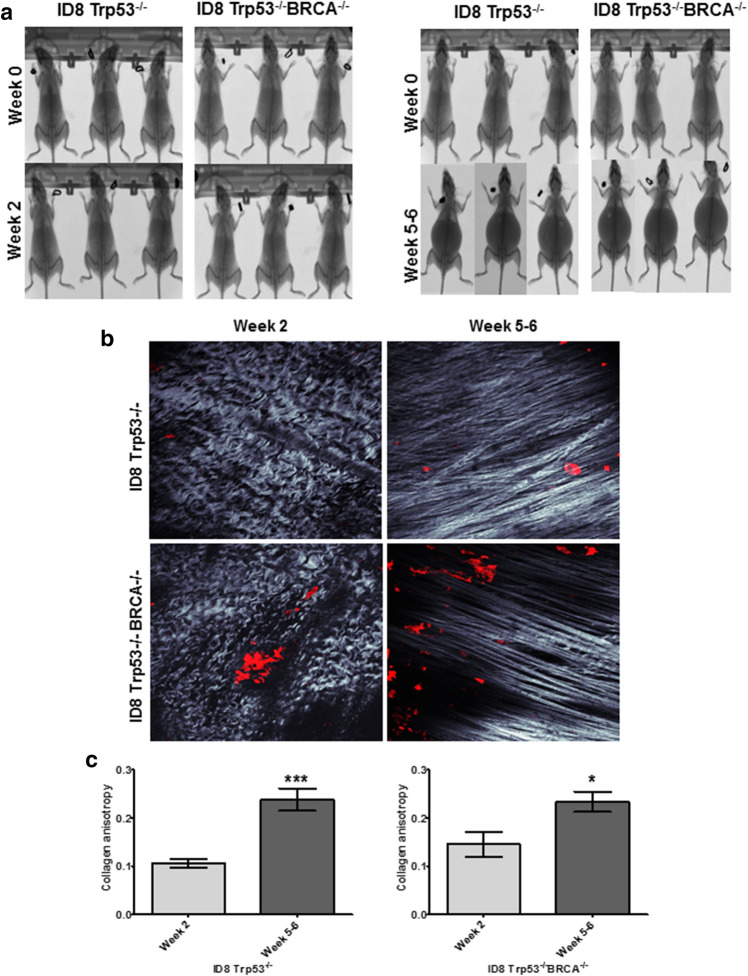
The majority of women with recurrent ovarian cancer (OvCa) develop malignant ascites with volumes that can reach > 2 L. The resulting elevation in intraperitoneal pressure (IPP), from normal values of 5 mmHg to as high as 22 mmHg, causes striking changes in the loading environment in the peritoneal cavity. The effect of ascites-induced changes in IPP on OvCa progression is largely unknown. Herein we model the functional consequences of ascites-induced compression on ovarian tumor cells and components of the peritoneal microenvironment using a panel of in vitro, ex vivo and in vivo assays. Results show that OvCa cell adhesion to the peritoneum was increased under compression. Moreover, compressive loads stimulated remodeling of peritoneal mesothelial cell surface ultrastructure via induction of tunneling nanotubes (TNT). TNT-mediated interaction between peritoneal mesothelial cells and OvCa cells was enhanced under compression and was accompanied by transport of mitochondria from mesothelial cells to OvCa cells. Additionally, peritoneal collagen fibers adopted a more linear anisotropic alignment under compression, a collagen signature commonly correlated with enhanced invasion in solid tumors. Collectively, these findings elucidate a new role for ascites-induced compression in promoting metastatic OvCa progression.


Conflict of interest statement

The authors declare no competing interests.

Figures

Figure 1
Figure 1
Artificial ascites model of compression enhances OvCa cell adhesion to peritoneum in vivo. (A) MicroCT Scans showing C57Bl/6 female mice injected i.p. with 1 mL (control) or 5 mL (artificial ascites, or AA) PBS containing 106 RFP-tagged OVCAR5 or OVCAR8 cells, as indicated, for 5 or 8 h, respectively. (B) Mice were sacrificed, peritoneal tissue was collected and images of adherent cells to peritoneum were obtained using Echo Revolve fluorescent microscope at × 20 magnification. (C) Adherent cells were quantified using ImageJ. All experiments in were performed as triplicates with three independent biological replicates per cell line. All results are presented as mean ± s.e.m. and P-values were calculated using a Student’s two-tailed t-test. P < 0.05 is statistically significant.
Figure 2
Figure 2
Compression alters peritoneal mesothelial morphology and surface ultrastructure in vitro and ex vivo. (A) LP9 human peritoneal mesothelial cells or primary human mesothelial cells (HPMC) were cultured in control or compressed conditions using a Flexcell Compression Plus System (~ 3 kPa; ~ 22 mmHg) for 24 h. Cells were fixed with 4% PFA buffer and stained with Phalloidin488 and DAPI. Cells were imaged with Leica DM5500 fluorescence microscope at × 20 magnification. Scale bar, 200, 130 µm. (B) Murine peritoneal explants were maintained ex vivo under control or compressed conditions (~ 3 kPa; ~ 22 mmHg) for 1 h. Explants were fixed and processed for imaging by FEI-Magellan 400 Field Emission Scanning Electron Microscope. Scale bar, 10, 5, 4, 2 µm (C) Tunneling nanotubes (TNT) were quantified using ImageJ. Three mice were included in each group with 10 images analyzed for each mouse. All results are presented as mean ± s.e.m. and P-values were calculated using a Student’s two-tailed t-test. Triple asterisk indicates significant p-value < 0.01.
Figure 3
Figure 3
Artificial ascites model of compression alters peritoneal mesothelial cell morphology and surface ultrastructure in vivo. (A) C57Bl/6 female mice were injected i.p. with 5 or 10 mL PBS to model artificial ascites. MicroCT images of mice were taken before and after PBS injection. Peritoneal explants were collected from (B) control mice, (C) mice with 5 mL of artificial ascites, or (D) mice with 10 ml of artificial ascites. Explants were fixed and processed for imaging using a FEI-Magellan 400 Field Emission Scanning Electron Microscope. Yellow arrows indicate TNT. (E) Human peritoneal samples from women with ovarian cancer with ascites (n = 3) were fixed and processed for imaging of the mesothelial surface using a FEI-Magellan 400 Field Emission Scanning Electron Microscope. Yellow arrows indicate TNT.
Figure 4
Figure 4
Evaluation of threshold parameters for compression-induced formation of nanoscale cell surface projections. (A) LP9 human peritoneal mesothelial cells were cultured atop type I collagen and subjected to a gradient of compressive force (1–3 kPa as indicated; 7.5–22.5 mmHg) for 24 h. Cells were fixed with 4% PFA buffer and stained with Phalloidin488 and DAPI. Cells were imaged with Leica DM5500 fluorescence microscope at × 20 magnification. Scale bar, 130 µm (B) LP9 cells cultured as described above were compressed at 3 kPa (~ 22 mmHg) for the time points indicated. Cells were fixed with 4% PFA buffer, stained with Phalloidin488 and DAPI and imaged with Leica DM5500 fluorescence microscope at 20 × magnification. Scale bar, 200 µm.
Figure 5
Figure 5
Compression enhances the formation of nanoscale projections between OvCa cells and peritoneal MCs. (A) OVCAR5 or OVCAR8 cells were added atop the mesothelial surface of murine peritoneal explants ex vivo followed by compression (~ 3 kPa; ~ 22 mmHg) for 30 min. The peritoneal explants were fixed and processed for imaging by FEI-Magellan 400 Field Emission Scanning Electron Microscope. (B) Quantification of nanotubes formed between OVCAR5 or OVCAR8 cells and murine peritoneal mesothelial surface. (C) C57Bl/6 female mice were injected i.p. with 1 mL (control) or 10 ml (artificial ascites) PBS containing 106 OVCAR5 or OVCAR8 cells in an in vivo artificial ascites experiment. Peritoneal explants were collected, fixed and processed for imaging by FEI-Magellan 400 Field Emission Scanning Electron Microscope. TC tumor cell, MC: mesothelial cell. (D) Human peritoneum samples containing OvCa metastases were fixed and processed for imaging by FEI-Magellan 400 Field Emission Scanning Electron Microscope. TC tumor cell, MC mesothelial cell. Yellow arrows refer to TNT.
Figure 6
Figure 6
Compression-induced nanotubes adopt distinct morphologies and participate in mitochondria transport between LP9 mesothelial cells and OvCa cells. (A) High magnification scanning electron micrographs of TNT formed under compression (~ 3 kPa; ~ 22 mmHg) in murine peritoneal explants. The peritoneal explants were compressed ex vivo for 1 h, fixed and processed for imaging using a FEI-Magellan 400 Field Emission Scanning Electron Microscope. Yellow arrows refer to distensions in the nanotubes. (B) GFP-tagged LP9 human peritoneal mesothelial cells were incubated with MitoTracker red to label mitochondria, then co-cultured with OVCAR5 or OVCAR8 cells under compression (~ 3 kPa; ~ 22 mmHg) for 24 h and stained with DAPI. Cells were imaged with Leica DM5500 fluorescence microscope at × 20 magnification. Top panel: phase image showing LP9 and OVCAR cells; second panel: GFP-tagged LP9 peritoneal MC; third panel: MitoTracker red showing labeled mitochondria in LP9 cells and extracellular projections; fourth panel: DAPI-stained nuclei of both LP9 and OVCAR cells; fifth panel: overlay. Yellow arrows denote nanotubes or labeled mitochondria transferred in nanotubes.
Figure 7
Figure 7
Ascites accumulation in vivo correlates with enhanced collagen anisotropy. (A) C57Bl/6 female mice were injected i.p. with 5 × 106 RFP-tagged ID8-Trp53−/− or ID8-Trp53−/− BRCA−/− syngeneic murine OvCa cells as indicated. MicroCT images were procured at time of injection (week 0) and time of sacrifice (week 2 or week 5–6 post-injection, as indicated). (B) The parietal peritoneum was dissected and prepared for combined fluorescence/SHG microscopy as described in Methods. Shown are representative examples from each cohort to show collagen fiber alignment (grey) and metastatic lesions (RFP-tagged cancer cells, red). (C) Collagen anisotropy was quantified using ImageJ. All results are presented as mean ± s.e.m. and P-values were calculated using a Student’s two-tailed t-test.

References

    1. Torre LA, et al. Ovarian cancer statistics, 2018. CA Cancer J Clin. 2018;68(4):284–296. - PMC - PubMed
    1. Ahmed N, Stenvers KL. Getting to know ovarian cancer ascites: opportunities for targeted therapy-based translational research. Front Oncol. 2013;3:256. - PMC - PubMed
    1. Parsons SL, Lang MW, Steele RJ. Malignant ascites: a 2-year review from a teaching hospital. Eur. J. Surg. Oncol. 1996;22(3):237–239. - PubMed
    1. Shen-Gunther J, Mannel RS. Ascites as a predictor of ovarian malignancy. Gynecol. Oncol. 2002;87(1):77–83. - PubMed
    1. Penet MF, et al. Ascites volumes and the ovarian cancer microenvironment. Front. Oncol. 2018;8:595. - PMC - PubMed

Publication types

MeSH terms