. 2020 Jul 17;11(1):3586.
doi: 10.1038/s41467-020-17415-x.

AXL confers cell migration and invasion by hijacking a PEAK1-regulated focal adhesion protein network

Affiliations

AXL confers cell migration and invasion by hijacking a PEAK1-regulated focal adhesion protein network

Afnan Abu-Thuraia et al. Nat Commun. .

Abstract

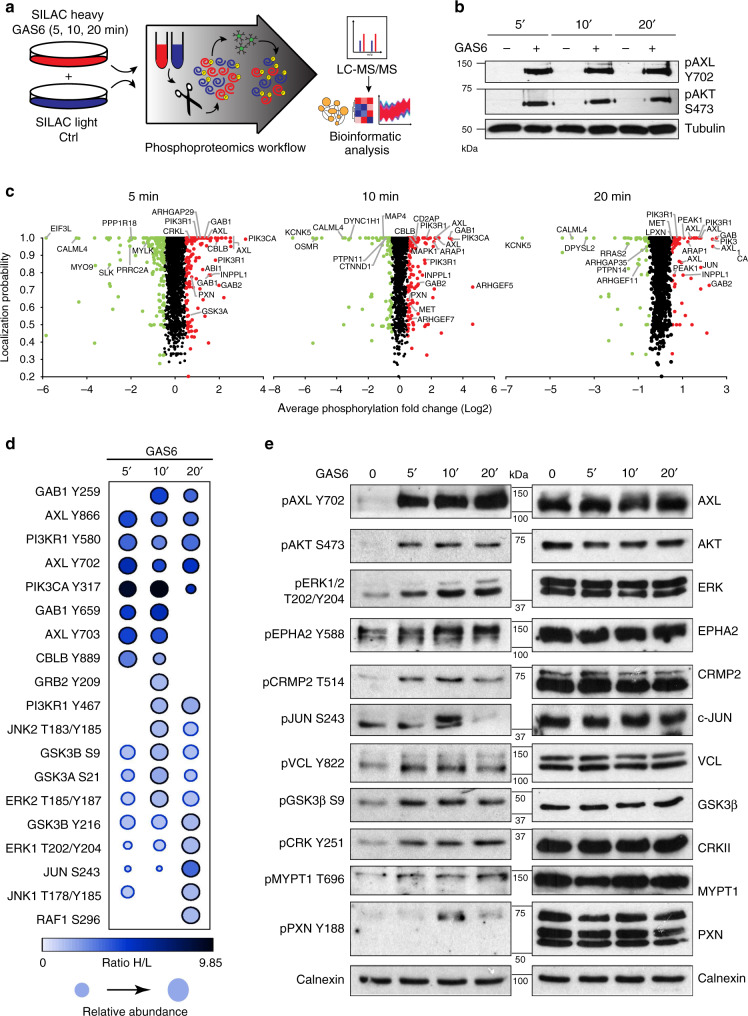
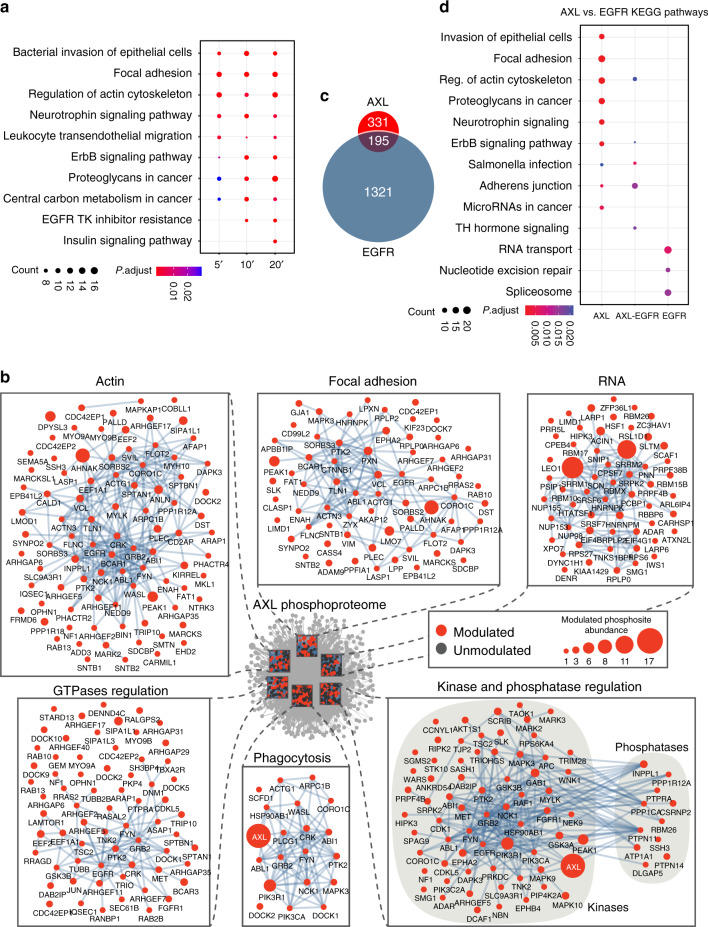
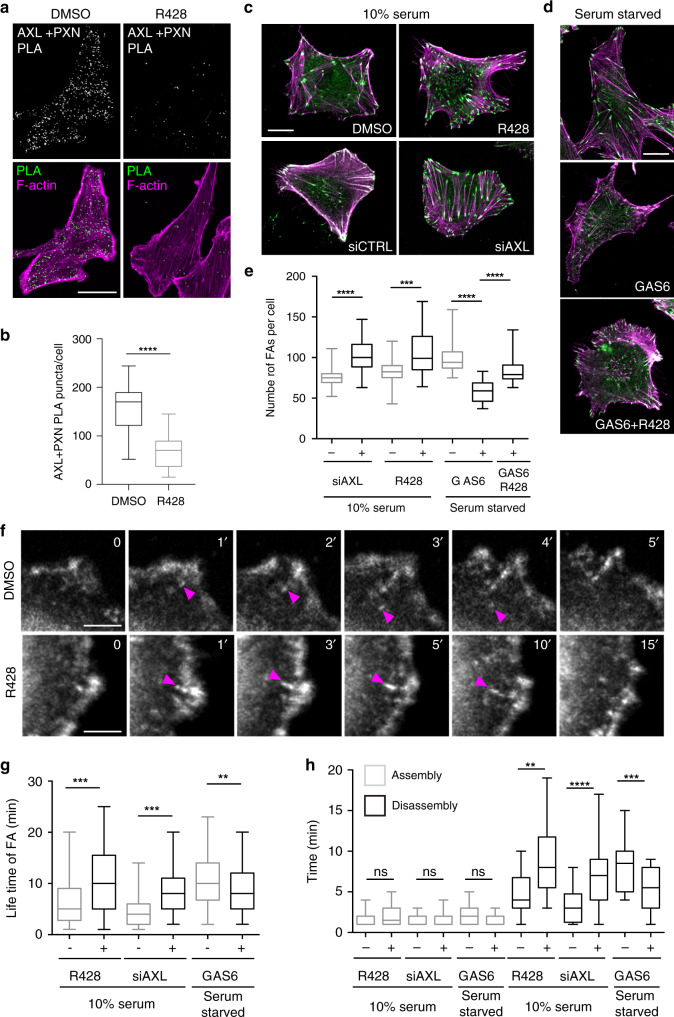
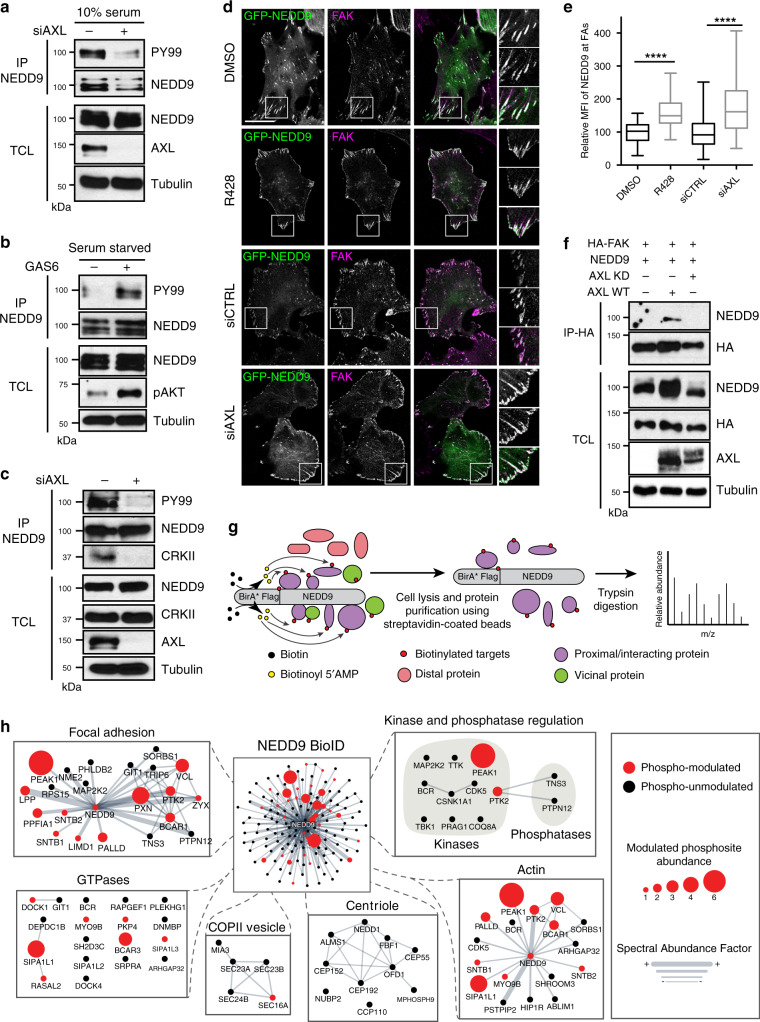
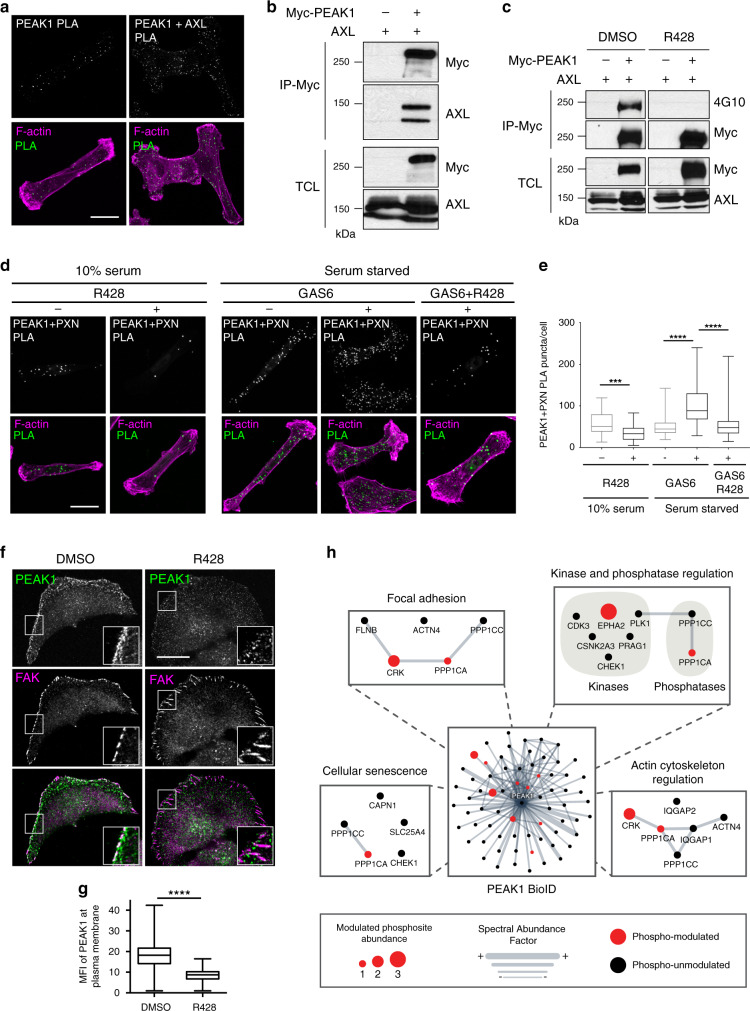
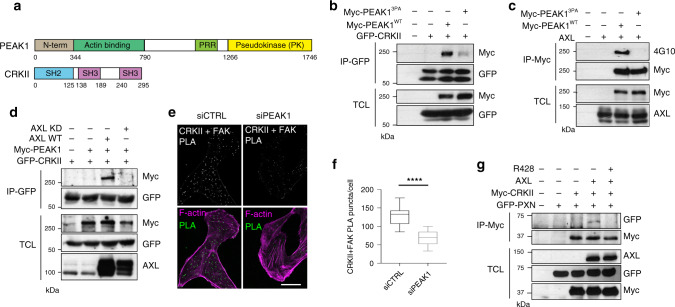
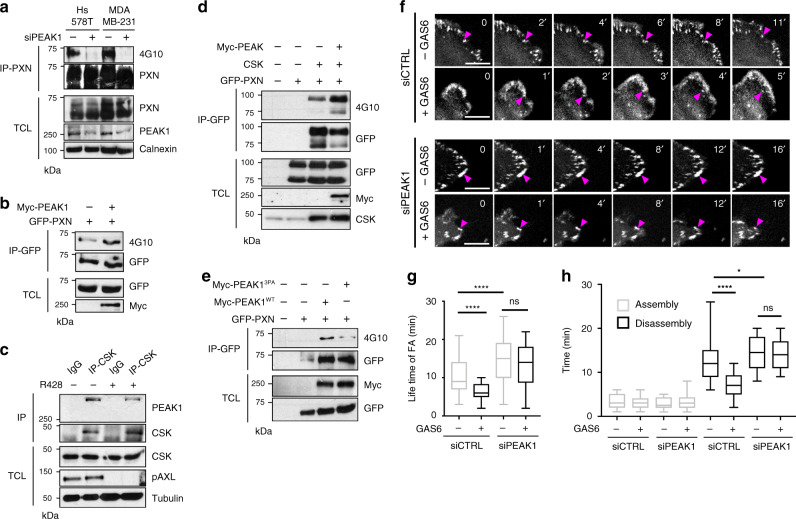
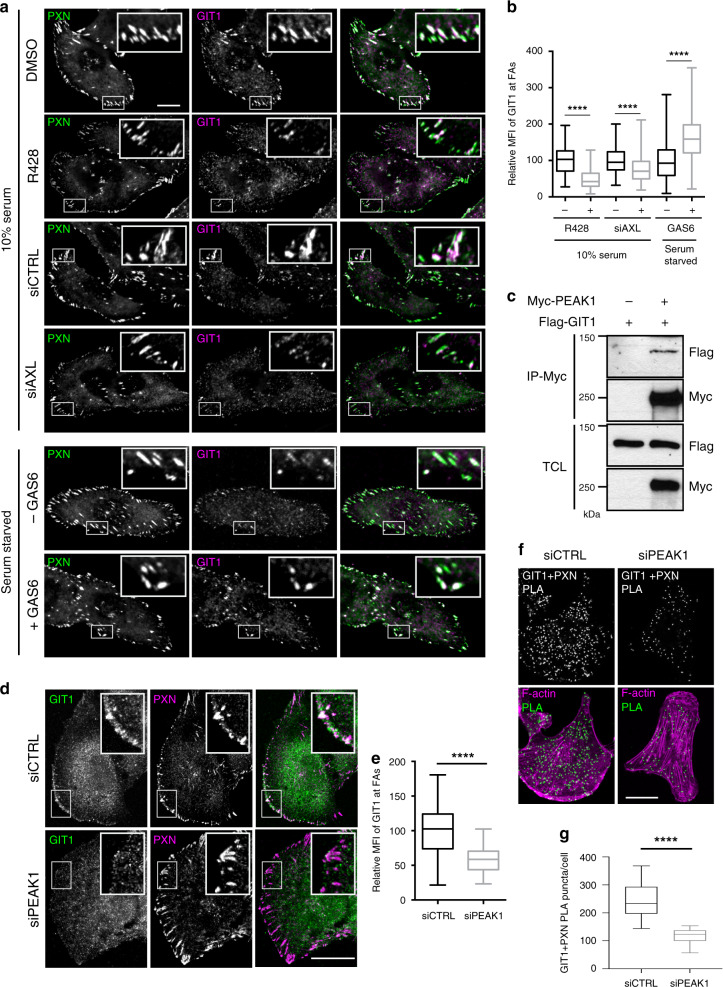
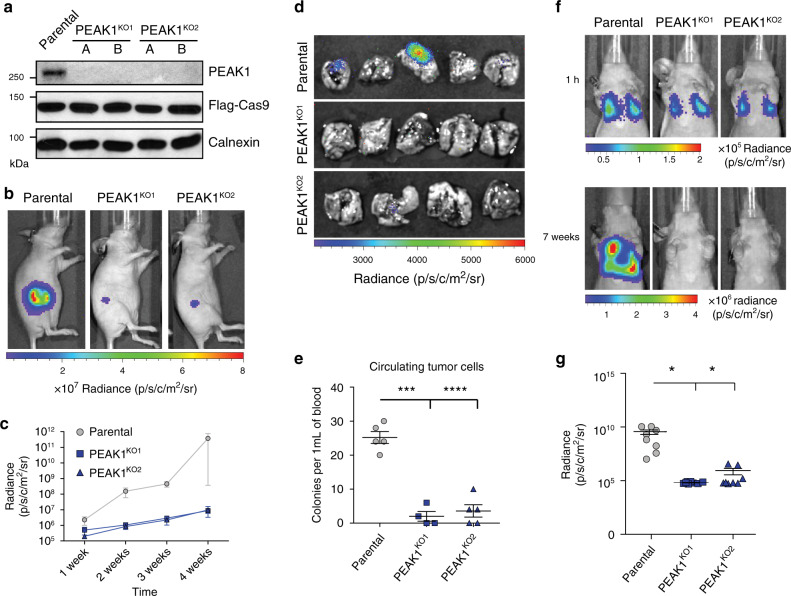
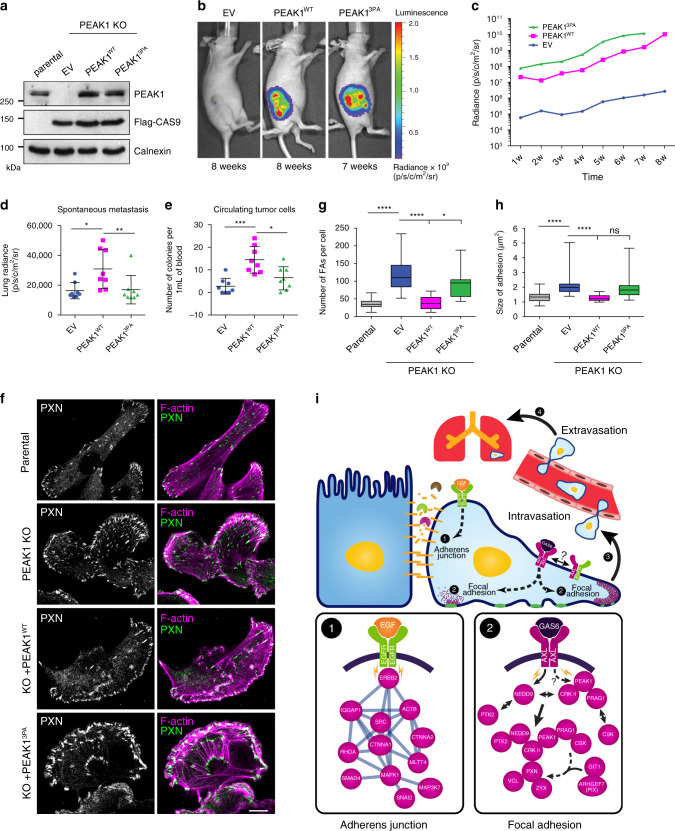
Aberrant expression of receptor tyrosine kinase AXL is linked to metastasis. AXL can be activated by its ligand GAS6 or by other kinases, but the signaling pathways conferring its metastatic activity are unknown. Here, we define the AXL-regulated phosphoproteome in breast cancer cells. We reveal that AXL stimulates the phosphorylation of a network of focal adhesion (FA) proteins, culminating in faster FA disassembly. Mechanistically, AXL phosphorylates NEDD9, leading to its binding to CRKII which in turn associates with and orchestrates the phosphorylation of the pseudo-kinase PEAK1. We find that PEAK1 is in complex with the tyrosine kinase CSK to mediate the phosphorylation of PAXILLIN. Uncoupling of PEAK1 from AXL signaling decreases metastasis in vivo, but not tumor growth. Our results uncover a contribution of AXL signaling to FA dynamics, reveal a long sought-after mechanism underlying AXL metastatic activity, and identify PEAK1 as a therapeutic target in AXL positive tumors.


Conflict of interest statement

The authors declare no competing interests.

Figures

Fig. 1
Fig. 1. Phosphoproteomic analyses of the receptor tyrosine kinase AXL in TNBC model.
a Schematic workflow of Hs578T cell labeling, treatment, and sample preparation for phosphopeptides enrichment and phosphoproteomic analyses. b Immunoblot analysis of SILAC-labeled Hs578T cell lysates collected at different time points demonstrates the phosphorylation of AXL and AKT following GAS6 stimulation. c Graphs of differential phosphopeptide abundances and phosphorylation probabilities in GAS6-treated cells vs. unstimulated cells. Phosphosites are deemed modulated if they exhibit SILAC ratios cutoffs of 1.5-fold increase or decrease, which is a phospho-modulation at a Log2 fold change ≥0.5 (phosphorylated—red circles) or ≤0.5 (dephosphorylated—green circles). d Dot plot representation of canonical phosphorylation sites regulated downstream of RTKs that were identified in our screen. Color of circle represents the phosphorylation level (ratio H/L) at 5-, 10- and 20-min. Border color of the circle depicts the significance of the modulation, whereas the size of the node indicates the relative abundance. The average of two ratios (H/L) was used to generate the relative abundance between different time points. e Lysates of Hs578T cells treated with GAS6 at three different time points were analyzed by immunoblotting for the phosphorylation status of known targets of receptor tyrosine kinase signaling.
Fig. 2
Fig. 2. High-resolution overview of AXL signaling revealed in TNBC cells.
a Dot plot representation of top ten significantly enriched KEGG pathways of GAS6-regulated phosphoproteins at three different time points of stimulation. Circle sizes represent the number of regulated phosphoproteins associated with the specific pathway, and the color of the circle represents the significant adjusted P value. b Protein–protein interaction network analysis of GAS6-modulated (red nodes) and unmodulated phosphoproteins (black nodes). Surrounding subnetworks in zoom boxes highlight the selected and relevant functions of modulated phosphoproteins. Node sizes represent the number of significantly modulated phosphosites. c A Venn diagram comparing the number of AXL phospho-modulated proteins detected vs. the EGFR phospho-modulated proteins. d Dot plot representation of the significantly enriched KEGG pathways of GAS6-regulated phosphoproteins and EGF-regulated phosphoproteins. Circle sizes represent the number of regulated phosphoproteins associated with the specific pathway, and the color of the circle represents the significant adjusted P value.
Fig. 3
Fig. 3. AXL localizes at focal adhesion (FA) sites and modulates their turnover.
a AXL localizes at FA sites. Representative confocal images of MDA-MB-231 cells treated either with DMSO or 1 μM R428. Proximity ligation assay (PLA) was used to analyze localization of AXL at PXN-positive FAs. Scale bar, 20 μm. b Quantifications of the number of PLA puncta per cell per condition. ****P < 0.0001. (n = 3 experiments, 15 cells per condition per experiment). c, d AXL modulates the number of FAs per cell. Representative confocal images of Hs578T cells treated with DMSO or 1 μM R428, transfected with 100 nM of siCTRL or siAXL (c), serum starved and treated with GAS6 for 20 min, or serum starved and treated with GAS6 and R428 (d). Cells were stained for PXN (green) and Phalloidin (magenta). Scale bar, 10 μm. e Quantification of the FA number per cell depicted in c, d. ***P = 0.0001, ****P < 0.0001 (n = 3 experiments with 30 cells per condition). f MDA-MB-231 GFP-PXN-expressing cells treated with DMSO or 1 μM R428 were imaged live by spinning disk microscopy for a period of 30 min to assess the dynamics of FA turnover. Magenta arrow heads point toward a FA that was followed for its assembly and disassembly times. Scale bar, 5 μm. g, h Quantification of FA lifetime (g) and their assembly and disassembly times (h) of cells depicted in f and MDA-MB-231 GFP-PXN-expressing cells treated with GAS6 for 30 min or transfected with 100 nM siAXL and imaged as mentioned in f. ***P < 0.0001 (g), **P = 0.00899 (g), **P = 0.000014 (h), ***P = 0.00009 (h), ****P = 0.000009 (h) (n = 3 experiments with 90 FAs followed per condition). Data are represented as boxplots where the middle line is the median, the lower and upper hinges correspond to the first and third quartiles, the upper whisker extends from the hinge to the largest value, and the lower whisker extends from the hinge to the smallest value (b, e, g, h). Two-tailed unpaired t test was used. Source data are provided as a Source data file.
Fig. 4
Fig. 4. AXL phosphorylates NEDD9 and regulates its localization at FAs.
a AXL knockdown decreases NEDD9 phosphorylation levels. MDA-MB-231 cells were transfected with 100 nM siAXL. Following anti-NEDD9 immunoprecipitation, NEDD9 phosphorylation levels was determined by western blotting. b AXL activation increases NEDD9 phosphorylation levels. Serum-starved MDA-MB-231 cells were treated with GAS6 for 20 min. Following anti-NEDD9 immunoprecipitation, NEDD9 phosphorylation levels were determined by western blotting. c AXL knockdown decreases NEDD9/CRKII complex formation. MDA-MB-231 were transfected with 100 nM siAXL. Following anti-NEDD9 immunoprecipitation, levels of CRKII binding to NEDD9 was determined by western blotting. d NEDD9 localization at FAs is regulated by AXL. Representative confocal images of Hs578T cells transfected with GFP-NEDD9, plated on coverslips, and either treated with DMSO or 1 μM R428 or transfected with 100 nM siAXL. Cells were then fixed and permeabilized and stained for GFP (green) and FAK (magenta). Boxes are used to depict the location of the zoomed images. Scale bar, 20 μm. e Quantification of mean fluorescence intensity (MFI) of NEDD9 at FAK-positive FAs shown in d. Data are represented as boxplots where the middle line is the median, the lower and upper hinges correspond to the first and third quartiles, the upper whisker extends from the hinge to the largest value, and the lower whisker extends from the hinge to the smallest value. Two-tailed Mann–Whitney test was used. ****P < 0.0001 (15 cells per condition per experiment). Source data are provided as a Source data file. f AXL kinase activity regulates NEDD9 complex formation with FAK. Lysates of 293T cells expressing the indicated plasmids were subjected to anti-HA FAK immunoprecipitation. Co-immunoprecipitates were detected via western blotting. g Schematic workflow of the proximity-dependent biotinylation (BioID) proteomics approach performed with NEDD9 in Flp-InTM T-RExTM 293 cells. NEDD9 is fused to the promiscuous BirA* biotin ligase that can label the protein environment of the bait. h Network layout of the NEDD9 BioID dataset. Surrounding subnetworks in zoom boxes exhibit selected and relevant functions, such as “FA” and “Actin” where NEDD9 seems to play a central role. Node sizes represent the relative amount of GAS6-modulated phosphosites. Edge thickness represents the relative protein abundance depicted by the SAF (Spectral Abundance Factor) metric. The color of the node indicates if a NEDD9 prey has been phospho-modulated or not in the GAS6 phosphoproteomic screen (see Fig. 2).
Fig. 5
Fig. 5. AXL interacts with PEAK1 and modulates its phosphorylation and localization.
a PEAK1 localizes with AXL in TNBC cells. Representative confocal images of MDA-MB-231 cells. PLA was used to analyze the proximity localization of PEAK1 and AXL. Scale bar, 20 μm. b PEAK1 interacts with AXL. Lysates of 293T cells expressing the indicated plasmids were used for anti-Myc immunoprecipitation. Levels of AXL is detected via western blotting. c PEAK1 is phosphorylated by AXL. Lysates of 293T cells expressing the indicated plasmids and treated or not with 1 μM R428 for 1 h were subjected to anti-Myc immunoprecipitation. Levels of Myc-PEAK1 tyrosine phosphorylation was detected via western blotting. d PEAK1 is localized at PXN FA sites. Representative confocal images of MDA-MB-231 cells treated with DMSO or 1 μM R428, GAS6, or GAS6 and R428. PLA was used to analyze proximity localization of PEAK1 at PXN-positive FAs. Scale bar, 20 μm. e Quantifications of the number of PLA puncta per cell per condition. ***P = 0.000014; ****P < 0.000001 (n = 3 experiments, 15 cells per condition per experiment). f PEAK1 recruitment to the cell membrane is AXL regulated. Representative confocal images of Hs578T cells treated with DMSO or 1 μM R428. Cells were stained for PEAK1 (green) and FAK (magenta). Boxes are used to depict the location of the zoomed images. Scale bar, 20 μm. g Quantification of mean fluorescence intensity (MFI) of PEAK1 at periphery of membrane shown in f. ****P < 0.0000001 (15 cells per condition per experiment). h Network layout of the PEAK1 BioID dataset. Surrounding subnetworks in zoom boxes exhibit selected and relevant functions, such as “FA” and “Actin” where PEAK1 seems to play a role. Node sizes represent the relative amount of GAS6-modulated phosphosites. Edge thickness represents the relative protein abundance depicted by the SAF (Spectral Abundance Factor) metric. The color of the node indicates if a PEAK1 prey has been phospho-modulated or not in the GAS6 phosphoproteomic screen (see Fig. 2). Data are represented as boxplots where the middle line is the median, the lower and upper hinges correspond to the first and third quartiles, the upper whisker extends from the hinge to the largest value, and the lower whisker extends from the hinge to the smallest value (e, g). Two-tailed Mann–Whitney test was used to calculate P value. Source data are provided as a Source data file.
Fig. 6
Fig. 6. CRKII/PEAK1 binding mediates PEAK1 phosphorylation by AXL and CRKII localization at FAs.
a Schematic of PEAK1 and CRKII domains. b CRKII binds PEAK1 proline-rich region (PRR). Lysates of 293T cells expressing the indicated plasmids were used for anti-GFP immunoprecipitation. Levels of Myc-PEAK1 is detected via western blotting. c Lysates of 293T cells transfected with the indicated plasmids were subjected to anti-Myc immunoprecipitation. Myc-PEAK1 phosphorylation levels were detected via western blotting. d Lysates of 293T cells transfected with the indicated plasmids were subjected to anti-GFP immunoprecipitation. Levels of Myc-PEAK1 were detected via western blotting. e PEAK1 regulates CRKII localization at FA sites. Representative confocal images of MDA-MB-231 cells transfected with either 100 nM siCTRL or siPEAK1. PLA was used to analyze proximity localization of CRKII at FAK-positive FAs. Scale bar, 20 μm. f Quantifications of the number of PLA puncta per cell per condition. ****P < 0.000001 (n = 3 experiments, 15 cells per condition per experiment). Data are represented as boxplots where the middle line is the median, the lower and upper hinges correspond to the first and third quartiles, the upper whisker extends from the hinge to the largest value, and the lower whisker extends from the hinge to the smallest value. Two-tailed Mann–Whitney test was used to calculate P value. Source data are provided as a Source data file. g AXL modulates CRKII binding to PXN. Lysates of 293T cells expressing the indicated plasmids were used for anti-Myc immunoprecipitation. Levels of GFP-PXN is detected via western blotting.
Fig. 7
Fig. 7. PEAK1 regulates FA turnover by PXN phosphorylation downstream of AXL.
a PXN phosphorylation is PEAK1 dependent in TNBC cells. Hs578T and MDA-MB-231 cells were transfected with 100 nM siCTRL or siPEAK1 and their lysates were used for anti-PXN immunoprecipitation. Phosphorylation levels of PXN was analyzed via western blotting. b PEAK1 expression increases PXN phosphorylation. Lysates of 293T cells expressing the indicated plasmids were used for anti-GFP immunoprecipitation. Levels of PXN phosphorylation is detected via western blotting. c PEAK1 interacts with CSK in an AXL-dependent manner. Lysates of MDA-MB-231 cells treated or not with 1 μM R428 were used for anti-CSK immunoprecipitation. PEAK1 levels in the IP were analyzed via western blotting. d Lysates of 293T cells transfected with the indicated plasmids were subjected to anti-GFP immunoprecipitation. GFP-PXN phosphorylation levels were detected via western blotting. e Lysates of 293T cells transfected with the indicated plasmids were subjected to anti-GFP immunoprecipitation. GFP-PXN phosphorylation levels were detected via western blotting. f MDA-MB-231 GFP-PXN-expressing cells transfected with 100 nM of siCTRL or siPEAK1 and treated with or without GAS6 were imaged live by spinning disk microscopy for a period of 30 min to assess the dynamics of FA turnover. Magenta arrow heads point toward an FA that was followed for its assembly and disassembly times. Scale bar, 5 μm. g, h AXL modulation of FA turnover is PEAK1 mediated. Quantification of assembly and disassembly time (g) and lifetime (h) of the FAs of GFP-PXN expressing MDA-MB-231 cells. ****P < 0.000001; *P = 0.0196 (n = 3 experiments with 90 FAs followed per condition). Data are represented as boxplots where the middle line is the median, the lower and upper hinges correspond to the first and third quartiles, the upper whisker extends from the hinge to the largest value, and the lower whisker extends from the hinge to the smallest value. Two-tailed Mann–Whitney test was used to calculate P value. Source data are provided as a Source data file.
Fig. 8
Fig. 8. AXL/PEAK1 complex regulates recruitment of FA disassembly complex.
a Representative confocal images of MDA-MB-231 cells treated with DMSO or 1 μM R428, transfected with 100 nM of siCTRL or siAXL, or serum starved and treated with GAS6 for 20 min. Cells were stained for PXN (green) and GIT1 (magenta). Boxes are used to depict the location of the zoomed images. Scale bar, 10 μm. b Quantification of mean fluorescence intensity (MFI) of GIT1 at PXN-positive FAs shown in a. ****P < 0.000001 (15 cells per condition per experiment). c PEAK1 interacts with GIT1. Lysates of 293T cells expressing the indicated plasmids were used for anti-Myc immunoprecipitation. Levels of Flag-GIT1 is detected via western blotting. d PEAK1 regulates GIT1 localization at FA sites. Representative confocal images of MDA-MB-231 cells transfected with either 100 nM siCTRL or siPEAK1. Cells were stained for GIT1 (green) and PXN (magenta). Scale bar, 20 μm. e Quantification of mean fluorescence intensity (MFI) of GIT1 at PXN-FAs shown in d. ****P < 0.000001 (15 cells per condition per experiment). f PEAK1 expression levels modulate GIT1 recruitment to FA sites. Representative confocal images of MDA-MB-231 cells transfected with 100 nM siCTRL or siPEAK1. PLA was used to analyze the proximity localization of GIT1 at PXN-FAs. Scale bar, 20 μm. g Quantifications of the number of PLA puncta per cell per condition. ****P < 0.000001 (n = 3 experiments, 15 cells per condition per experiment). Data are represented as boxplots where the middle line is the median, the lower and upper hinges correspond to the first and third quartiles, the upper whisker extends from the hinge to the largest value, and the lower whisker extends from the hinge to the smallest value (b, e, g). Two-tailed Mann–Whitney test was used to calculate P value. Source data are provided as a Source data file.
Fig. 9
Fig. 9. PEAK1 expression regulates tumor growth and metastasis of TNBC in vivo.
a Lysates of MDA-MB-231-Luc CRISPR PEAK1 knockout clones. b Representative in vivo bioluminescent images of mammary fat pad-injected mice with MDA-MB-231-Luc WT (parental) or CRISPR PEAK1 KO cells 4 weeks postinjection. c Bioluminescence quantification of tumor growth at different weeks postinjection of mice bearing parental (n = 5), PEAK1 KO1 (n = 5), or PEAK1 KO2 (n = 5). P < 0.0001. d Representative bioluminescent lung images of mice shown in b. For the lungs of the mice bearing CRISPR PEAK1 KO tumors, lungs were dissected once the tumor reached the size of the WT tumors. e Circulating tumor cells isolated from mice-bearing parental or PEAK1 KO mammary tumors. ***P = 0.000022; ****P = 0.000027 (n = 5 for each group). f PEAK1 regulates metastasis of TNBC cells in vivo. Representative in vivo bioluminescent images of tail vein-injected mice with parental or CRISPR PEAK1 KO cells 1 h and 7 weeks postinjection. g Bioluminescence quantification of lung metastases 7 weeks postinjection of mice bearing parental (n = 8), PEAK1 KO1 (n = 8), or PEAK1 KO2 (n = 8). *P = 0.0439. Data were analyzed from 5 mice (c, e) or 8 mice (g) for each group and expressed as mean ± s.e.m. Two-tailed unpaired t test was used (c, e, g). Source data are provided as a Source data file.
Fig. 10
Fig. 10. Uncoupling PEAK1 from AXL signaling leads to impaired metastasis.
a Lysates of rescued MDA-MB-231-Luc CRISPR PEAK1 knockout cells. b Representative in vivo bioluminescent images of fat pad-injected mice with MDA-MB-231-Luc PEAK1 knockouts rescued with EV, PEAK1 WT, or PEAK1 3PA mutant 8 and 7 weeks postinjection, respectively. c Bioluminescence quantification of tumor growth at different weeks postinjection of mice bearing PEAK1 KO rescued with EV (n = 8), PEAK1 WT (n = 8), or PEAK1 3PA (n = 8). d Bioluminescence quantification of the spontaneous metastases in the lungs measured ex vivo of the fat pad-injected mice shown in c when the tumors from PEAK1WT and PEAK13PA reached the same size (7–8 weeks postinjection). *P = 0.0299; **P = 0.0125. n = 8 for EV, n = 8 for PEAK1 WT, and n = 8 for PEAK1 3PA. e Circulating tumor cells isolated from mice-bearing EV PEAK1KO, PEAK1WT, or PEAK13PA rescued mammary tumors. *P = 0.0098, ***P = 0.0003 (n = 8 for each group). f Representative confocal images of parental MDA-MB-231 cells and PEAK1 KO cells rescued with EV, PEAK1 WT, or PEAK1 3PA. Cells were stained for PXN (green) and Phalloidin (magenta). Scale bar, 10 μm. g Quantification of the FA number per cell depicted in f. *P = 0.014; ****P < 0.000001 (n = 3 experiments with 30 cells per condition). h Quantification of the size of the adhesions quantified in g. ****P < 0.000001 (n = 3 experiments with 30 cells per condition). Data are represented as boxplots where the middle line is the median, the lower and upper hinges correspond to the first and third quartiles, the upper whisker extends from the hinge to the largest value, and the lower whisker extends from the hinge to the smallest value (g, h). Two-tailed Mann–Whitney test was used to calculate P value. Source data are provided as a Source data file. i Schematic model of AXL and EGFR signaling in a cancer cell, where EGFR modulates adherens junctions and AXL modulates the FA turnover. Upon EGF stimulation, EGFR induces the expression of MMPs to degrade the adherens junctions. Once cell–cell contact is lost, AXL activation by GAS6 or EGFR can lead to the modulation of FAs turnover at the rear or front end of the cell. In specific, AXL directly phosphorylates NEDD9 to recruit its complex formation with PTK2 (FAK) and CRKII. Simultaneously, AXL can phosphorylate PEAK1, in complex with PRAG1 and CRKII, and recruit PTK2/NEDD9/CRKII/PEAK1/PRAG1 to PXN-positive FAs. Upon PEAK1 phosphorylation, CSK is recruited to PEAK1/PRAG1 complex at FAs to induce tyrosine phosphorylation of PXN. In addition, PEAK1 can also recruit βPIX/GIT1 complex to PXN-positive FAs to induce FA disassembly and turnover.

References

    1. Steeg PS. Targeting metastasis. Nat. Rev. Cancer. 2016;16:201–218. - PMC - PubMed
    1. Bauer KR, Brown M, Cress RD, Parise CA, Caggiano V. Descriptive analysis of estrogen receptor (ER)-negative, progesterone receptor (PR)-negative, and HER2-negative invasive breast cancer, the so-called triple-negative phenotype: a population-based study from the California cancer Registry. Cancer. 2007;109:1721–1728. - PubMed
    1. Penault-Llorca F, Viale G. Pathological and molecular diagnosis of triple-negative breast cancer: a clinical perspective. Ann. Oncol. 2012;23(Suppl 6):vi19–vi22. - PubMed
    1. Anders CK, Carey LA. Biology, metastatic patterns, and treatment of patients with triple-negative breast cancer. Clin. Breast Cancer. 2009;9(Suppl 2):S73–S81. - PMC - PubMed
    1. Lamouille S, Xu J, Derynck R. Molecular mechanisms of epithelial-mesenchymal transition. Nat. Rev. Mol. Cell Biol. 2014;15:178–196. - PMC - PubMed

Publication types

MeSH terms

Grants and funding