Review
. 2020 Jul 17;11(1):84.
doi: 10.1186/s13244-020-00888-1.

Multiparametric MRI: practical approach and pictorial review of a useful tool in the evaluation of brain tumours and tumour-like lesions

Affiliations
Review

Multiparametric MRI: practical approach and pictorial review of a useful tool in the evaluation of brain tumours and tumour-like lesions

Vijay Sawlani et al. Insights Imaging. .

Abstract

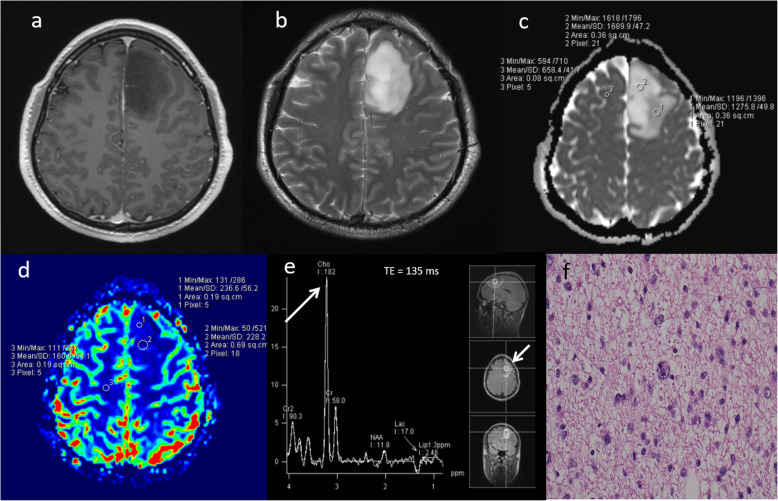
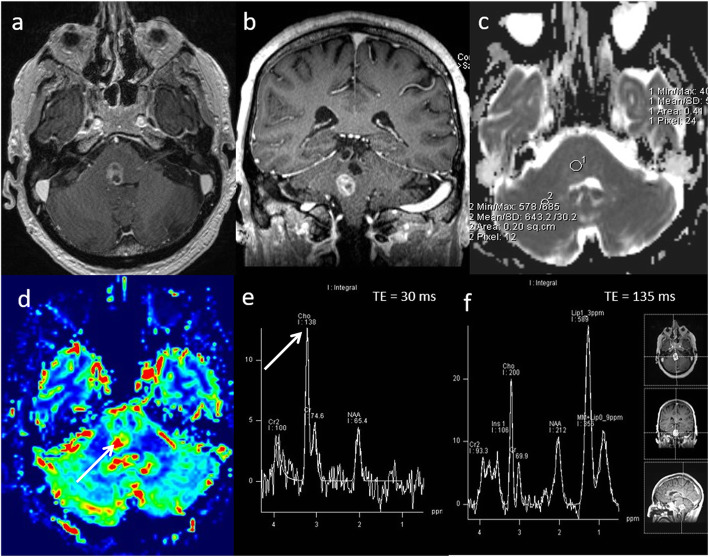
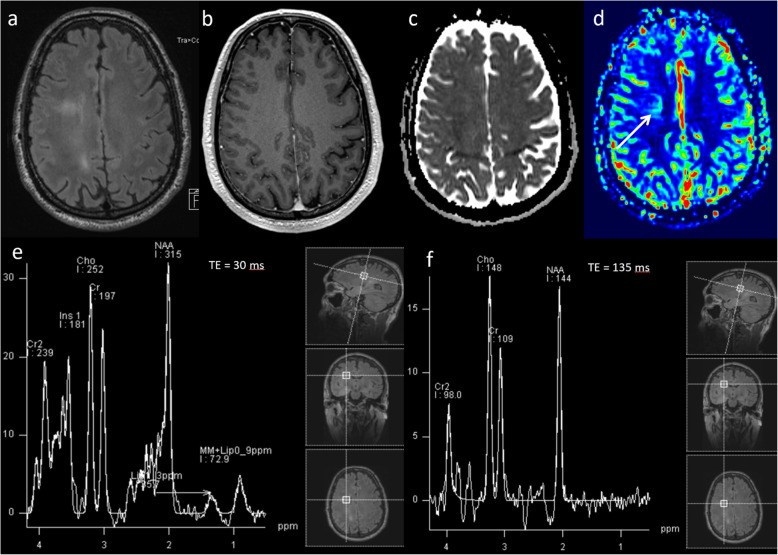
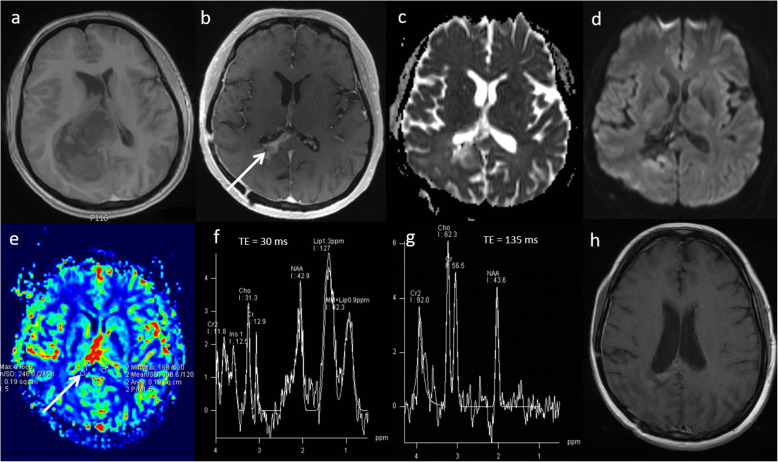
MRI has a vital role in the assessment of intracranial lesions. Conventional MRI has limited specificity and multiparametric MRI using diffusion-weighted imaging, perfusion-weighted imaging and magnetic resonance spectroscopy allows more accurate assessment of the tissue microenvironment. The purpose of this educational pictorial review is to demonstrate the role of multiparametric MRI for diagnosis, treatment planning and for assessing treatment response, as well as providing a practical approach for performing and interpreting multiparametric MRI in the clinical setting. A variety of cases are presented to demonstrate how multiparametric MRI can help differentiate neoplastic from non-neoplastic lesions compared to conventional MRI alone.

Keywords: Diffusion MRI; MR Spectroscopy; Multiparametric MRI; Neuroimaging; Perfusion MRI.


Conflict of interest statement

The authors declare that they have no competing interests.

Figures

Fig. 1
Fig. 1
Multiparametric MRI protocol for intracranial lesions
Fig. 2
Fig. 2
Lymphoma. Conventional MRI Findings: a, b Axial T2W and post-contrast T1W sequences show a large homogenously enhancing lesion in the left occipital lobe. c ADC map shows very low ADC (< 600 × 10−6 mm2 s−1) throughout the lesion. d PWI shows low perfusion throughout the lesion compared to normal-appearing contralateral white matter. e, f MRS shows very high Cho/Cr ratio (> 6, thick arrow) and very high lipid peaks in a non-necrotic appearing lesion (TE 30 ms and 135 ms, thin arrows). The low perfusion, very low ADC, very high lipid peak in a non-necrotic appearing lesion and high choline peak are characteristic of lymphoma. Histopathology confirmed a diffuse large B cell PCNSL
Fig. 3
Fig. 3
Low-grade glioma. Conventional MRI: (a) FLAIR, (b) T2W and (c) post-contrast T1W sequences show a diffuse abnormality in the left temporal lobe without contrast enhancement. d ADC map shows high ADC throughout the lesion (1300 × 10−6mm2s−1). e PWI shows low perfusion throughout the lesion (arrow) compared to normal-appearing white matter, and (f, g) MRS (TE 30 ms) shows slightly raised Cho/Cr ratio (1.0), slightly low NAA/Cr (1.1) and very high mI/Cr ratio (0.9, arrow). Lipid or lactate peaks are not significantly elevated. Multiparametric MRI appearances suggest no evidence of dedifferentiation. Stable appearances have been seen on follow-up imaging for over five years, confirming the lesion’s low-grade nature
Fig. 4
Fig. 4
Malignant transformation of low-grade glioma. ac T2W, FLAIR and post-contrast T1W sequences demonstrate non-enhancing signal abnormality in the left temporal lobe. Multiparametric MRI: d Heterogeneous ADC values throughout the lesion with focal areas of low ADC (lowest observed 940 × 10−6 mm2 s−1, arrow). e High rCBV throughout the lesion (arrow) compared to normal-appearing white matter (3.5). f Single-voxel spectroscopy shows very high Cho/Cr (2.3, arrow) and Cho/NAA ratios (3.1). g Histopathology from biopsy of the lesion shows low-grade diffuse astrocytoma with mild to moderately pleomorphic astrocytic cells in a fibrillary background. There was discrepancy of histological and genetic classification with morphological features of a low-grade glial neoplasm, but a convincing genetic profile of glioblastoma, overriding the morphological appearances. h Follow-up imaging 6 months later shows contrast enhancement indicating malignant transformation on conventional MRI
Fig. 5
Fig. 5
Targeting biopsy for a non-enhancing tumour. Conventional MRI: a, b Post-contrast T1W and T2W sequences demonstrate a large non-enhancing space occupying mass lesion without significant oedema. Multiparametric MRI: c, d Heterogeneous ADC and rCBV values throughout the lesion. e Multi-voxel MRS clearly shows focal area of very high Cho/Cr (3.1) and very small lactate peak. f Targeted biopsy taken from the area of highest choline peak (arrow). Histopathology shows anaplastic astrocytoma with moderately atypical astrocytic cells in a fibrillary background with a few abnormal mitoses (WHO grade III).
Fig. 6
Fig. 6
High-grade glioma. Conventional MRI: a, b Axial and coronal post-contrast T1W sequences, showing a well-defined lesion at the ponto-medullary junction. Multiparametric MRI: c ADC map demonstrates low ADC (590 × 10−6 mm2 s−1). d PWI shows high perfusion (rCBV 2.8, arrow). e, f MRS shows a high Cho/Cr ratio (2.9, arrow), low NAA/Cr ratio and presence of lipid peaks. MRI findings of a low ADC (< 1000 × 10−6 mm2 s−1), high rCBV (> 2) and high Cho/Cr ratio (> 1.8) are consistent with a high-grade glioma rather than a granuloma or abscess. The presence of high choline levels in the perilesional area (not shown) favour high-grade glioma over a metastatic lesion. In this patient, an initial biopsy was inconclusive and as a result of the multiparametric MRI findings, a decision to undergo further biopsy was overturned. The patient underwent radiotherapy for presumed glioblastoma
Fig. 7
Fig. 7
Gliomatosis cerebri. Conventional MRI: a, b Axial FLAIR and post-contrast T1W sequences, showing diffuse infiltrative non-enhancing deep white matter lesion. Multiparametric MRI: c ADC map demonstrates no areas of low ADC. d However, PWI shows a focal area of slightly raised perfusion in the right frontal centrum semiovale (arrow) compared to normal-appearing white matter. e, f MRS shows high mI/Cr ratio, slightly raised Cho/Cr ratio (1.2) and slightly low NAA/Cr ratio. Focal raised perfusion and choline area was chosen for the optimal site of biopsy
Fig. 8
Fig. 8
Glioblastoma—pseudoprogression. a Pre-operative T1-weighted image shows a right deep parietal region glioblastoma. b Conventional post-contrast T1-weighted image approximately 4 weeks after chemoradiotherapy treatment demonstrates a significant increase in the contrast-enhancing area (arrow). Multiparametric MRI at this timepoint demonstrates: c, d areas of high ADC (1186 × 10−6 mm2 s−1), (e) a low rCBV ratio (1.4, arrow) on PWI, (f, g) a low Cho/Cr ratio (1.4), a low Cho/NAA ratio and presence of lipid and lactate on MRS. Combination of parameters suggest pseudoprogression. h Clinical follow-up and conventional post-contrast T1W sequence at six months confirms a decrease in the amount of enhancing disease, indicating pseudoprogression
Fig. 9
Fig. 9
Glioblastoma—true progression. a Immediate post-operative contrast-enhanced T1-weighted scan following resection of a right fronto-parietal glioblastoma. b Conventional post-contrast T1-weighted image one month after chemoradiotherapy treatment demonstrates increase in the enhancing lesion size with associated oedema. Multiparametric MRI at this timepoint demonstrates: c, d areas of low ADC (903 × 10−6 mm2 s−1, arrow), (e) a high rCBV ratio (3.0, arrow) on PWI, (f, g) a high Cho/Cr ratio (2.3, arrow), high Cho/NAA ratio and presence of lipid/lactate on MRS. All parameters suggest a poor response and disease progression. h Six-month follow-up conventional post-contrast T1W sequence confirms an increase in enhancing disease, indicating true progression
Fig. 10
Fig. 10
Brain metastasis—treatment effect. Melanoma metastasis. a Enhancing lesion in the right basal ganglion on axial T1 post-contrast MRI. b, c Post-SRS T2W and post-contrast T1W images shows increase in lesion size and oedema. Multiparametric MRI demonstrates: (d) an intermediate rCBV ratio (< 2.1) on PWI, (e) a high ADC (1159 × 10−6 mm2 s−1) and (f) low Cho/Cr ratio (1.6) and very high lipids (arrow) suggesting necrosis. g Three-month follow-up post-contrast T1W scan showed regression of the lesion
Fig. 11
Fig. 11
Brain metastasis—recurrent tumour. Brain metastasis from primary breast carcinoma. a Brain metastasis in the right mesial frontal lobe motor area on axial T1-weighted post-contrast MRI. b Post-SRS scan at 29 weeks demonstrates increase in the lesion size with oedema. Multiparametric MRI demonstrates: (c) a borderline ADC (999 × 10−6 mm2/s), (d) a borderline rCBV ratio (1.9, arrow) on PWI and (e) highest Cho/Cr ratio of 3.6 (arrow) on multi-voxel MRS (TE = 30 ms). Two of the three parameters (DWI and MRS) suggest poor response and disease progression. f Surgical decision was taken to operate on the motor cortex and excision of right frontal tumour was performed. Histopathology demonstrates poorly differentiated metastatic adenocarcinoma with discernible focal ductal structures and tumour well demarcated from adjacent brain tissue
Fig. 12
Fig. 12
Abscess. Conventional MRI: a, b T2W and post-contrast T1W sequences demonstrate a ring-enhancing mass lesion in the left frontal lobe with surrounding oedema. c, d DWI and ADC sequences show low ADC (600 × 10−6 mm2 s−1, arrow) throughout the lesion. e PWI demonstrates significantly lower perfusion (arrow) than the contralateral white matter. f, g MRS shows high lipid as well as the presence of amino acid (0.9–1.0 ppm), acetate (1.92 ppm) and succinate peaks (2.42 ppm). These characteristic MRS findings in combination with the very low ADC and low perfusion are diagnostic of abscess. Diagnosis was confirmed on aspiration which revealed colonies of gram-positive cocci
Fig. 13
Fig. 13
Tuberculoma. Conventional MRI Findings: a, b Axial T2W and post-contrast T1W sequences show T2W hypointense confluent lesions in the right frontal lobe with extensive perilesional oedema and enhancement. Multiparametric MRI: c ADC map shows intermediate values (900 × 10−6 mm2 s−1), (d) PWI shows perfusion higher than the contralateral white matter, (e, f) MRS shows very high levels of lipid at 1.3 ppm (thin arrows), without any lactate. There is slightly elevated Cho/Cr ratio (1.5) on short TE MRS (thick arrow), moderately low NAA/Cr ratio and absence of mI. In this case of tuberculoma, the combination of a T2W hypointense lesion, raised rCBV, raised lipids and moderately increased Cho/Cr ratio helped to make the diagnosis. The patient commenced anti-tuberculosis treatment, and surgical intervention was avoided.
Fig. 14
Fig. 14
Neurosarcoidosis. Known case of systemic sarcoidosis. Conventional MRI Findings: a, b Axial and coronal T2W, (c) axial FLAIR and (d) post-contrast T1W sequences, showing a diffuse infiltrative lesion with enhancing foci in the right cerebellar peduncle extending to the brainstem, mimicking tumour. Multiparametric MRI: e DWI shows focal areas of low ADC. f PWI shows low perfusion in comparison to the contralateral side. g MRS with a short TE (30 ms) shows moderately high Cho/Cr ratio (< 2), near normal NAA/Cr and mI/Cr, presence of glutamate and glutamine at 2.4–2.6 ppm and large lipid peaks at 0.9 and 1.3 ppm suggesting necrosis. h MRS with a TE 135 ms shows slightly low NAA/creatine ratio and absence of lactate. In this case, the findings of low perfusion (< 2), absence of a lactate peak and presence of glutamine and glutamate favour an inflammatory aetiology such as neurosarcoidosis rather than a high-grade glioma. A tapering dose of oral prednisolone was commenced, during which neurological symptoms improved. Three-month follow-up MRI; (i) axial T2W, (j) post-contrast T1W, (k) FLAIR and (l) ADC sequences show near complete resolution of the lesion after treatment with steroids
Fig. 15
Fig. 15
Bickerstaff brainstem encephalitis. Conventional MRI Findings: (a) Axial T2W, (b, c) sagittal and coronal FLAIR and (d) axial post-contrast T1W sequences, show a diffuse high signal lesion in the pons with no enhancement post-contrast. Multiparametric MRI: e, f DWI shows high ADC throughout the lesion (> 1000 × 10−6 mm2 s−1). g, h MRS shows normal mI/Cr, normal Cho/Cr (arrow) and normal NAA/Cr ratios and minimally increased glutamine and glutamate peaks (2.3 and 2.4 ppm). PWI (not shown) had low rCBV compared to normal-appearing white matter. The lack of enhancement, low rCBV, high ADC and normal choline exclude glioma. These multiparametric MRI features in conjunction with an acute presentation favour an inflammatory lesion. Two-month follow-up imaging: (i) axial T2W, (j) FLAIR and (k) ADC sequences show lesion regression and normalisation of diffusion. In this case, CSF analysis revealed antiganglioside antibodies consistent with a diagnosis of Bickerstaff brainstem encephalitis
Fig. 16
Fig. 16
Tumefactive demyelination. Conventional MRI: a, b T2W and post-contrast T1W sequences reveals a large heterogeneous space occupying mass lesion and diffuse pattern of enhancement. Multiparametric MRI: c, d DWI and ADC images show high ADC centrally (> 1000 × 10−6 mm2 s−1) and a thin rim of low ADC reflecting advancing edge of demyelination (arrow). e MRS shows a high Cho/Cr ratio (6.4), near normal NAA/Cr ratio, high glutamate and glutamine (arrow), low mI/Cr ratio and the presence of lipid and lactate at 0.9 ppm and 1.3 ppm respectively. f The metabolic profile from the adjacent perilesional area also shows a similarly abnormal spectral pattern. PWI (not shown) demonstrated a low rCBV except in the anterior-superior component. The striking presence of glutamine and glutamate on MRS, the enhancement pattern and generally low perfusion favour an inflammatory lesion, as opposed to high-grade glioma or lymphoma. The patient made a recovery on methylprednisolone. One-month follow-up imaging: (g) Axial T2W, (h) post-contrast T1W and (i) ADC map shows significant improvement in mass effect, midline shift and overall volume of the lesion
Fig. 17
Fig. 17
Epidermoid-like lesion of the corpus callosum. Conventional MRI: a, b, e T2W, FLAIR and post-contrast T1W sequences show a lesion involving the splenium of the corpus callosum and right parietal lobe. Multiparametric MRI: c, d DWI and ADC images show restricted diffusion (arrow). f Very low perfusion on PWI (arrow). g MRS shows very high lipid (1.3 ppm, arrow), without an increase in choline. In this case, appearances are not typical for high-grade glioma as there is low perfusion and no significant increase in choline, and it is not typical for lymphoma as there is no contrast enhancement or raised choline. Biopsy was consistent with epidermoid-like lesion with no evidence of tumour

References

    1. Hall WA. The safety and efficacy of stereotactic biopsy for intracranial lesions. Cancer. 1998;82:1749–1755. - PubMed
    1. Malhotra HS, Jain KK, Agarwal A, et al. Characterization of tumefactive demyelinating lesions using MR imaging and in-vivo proton MR spectroscopy. Mult Scler. 2009;15:193–203. - PubMed
    1. Hourani R, Brant LJ, Rizk T, Weingart JD, Barker PB, Horská A. Can proton MR spectroscopic and perfusion imaging differentiate between neoplastic and nonneoplastic brain lesions in adults? AJNR Am J Neuroradiol. 2008;29:366–372. - PMC - PubMed
    1. Yang D, Korogi Y, Sugahara T, et al. Cerebral gliomas: prospective comparison of multivoxel 2D chemical-shift imaging proton MR spectroscopy, echoplanar perfusion and diffusion-weighted MRI. Neuroradiology. 2002;44:656–666. - PubMed
    1. Di Costanzo A, Scarabino T, Trojsi F, et al. Recurrent glioblastoma multiforme versus radiation injury: a multiparametric 3-T MR approach. Radiol Med. 2014;119:616–624. - PubMed

LinkOut - more resources