. 2020 Sep 9;107(5):891-908.e8.
doi: 10.1016/j.neuron.2020.06.021. Epub 2020 Jul 17.

Cell Type-Specific Transcriptomics Reveals that Mutant Huntingtin Leads to Mitochondrial RNA Release and Neuronal Innate Immune Activation

Affiliations

Cell Type-Specific Transcriptomics Reveals that Mutant Huntingtin Leads to Mitochondrial RNA Release and Neuronal Innate Immune Activation

Hyeseung Lee et al. Neuron. .

Abstract

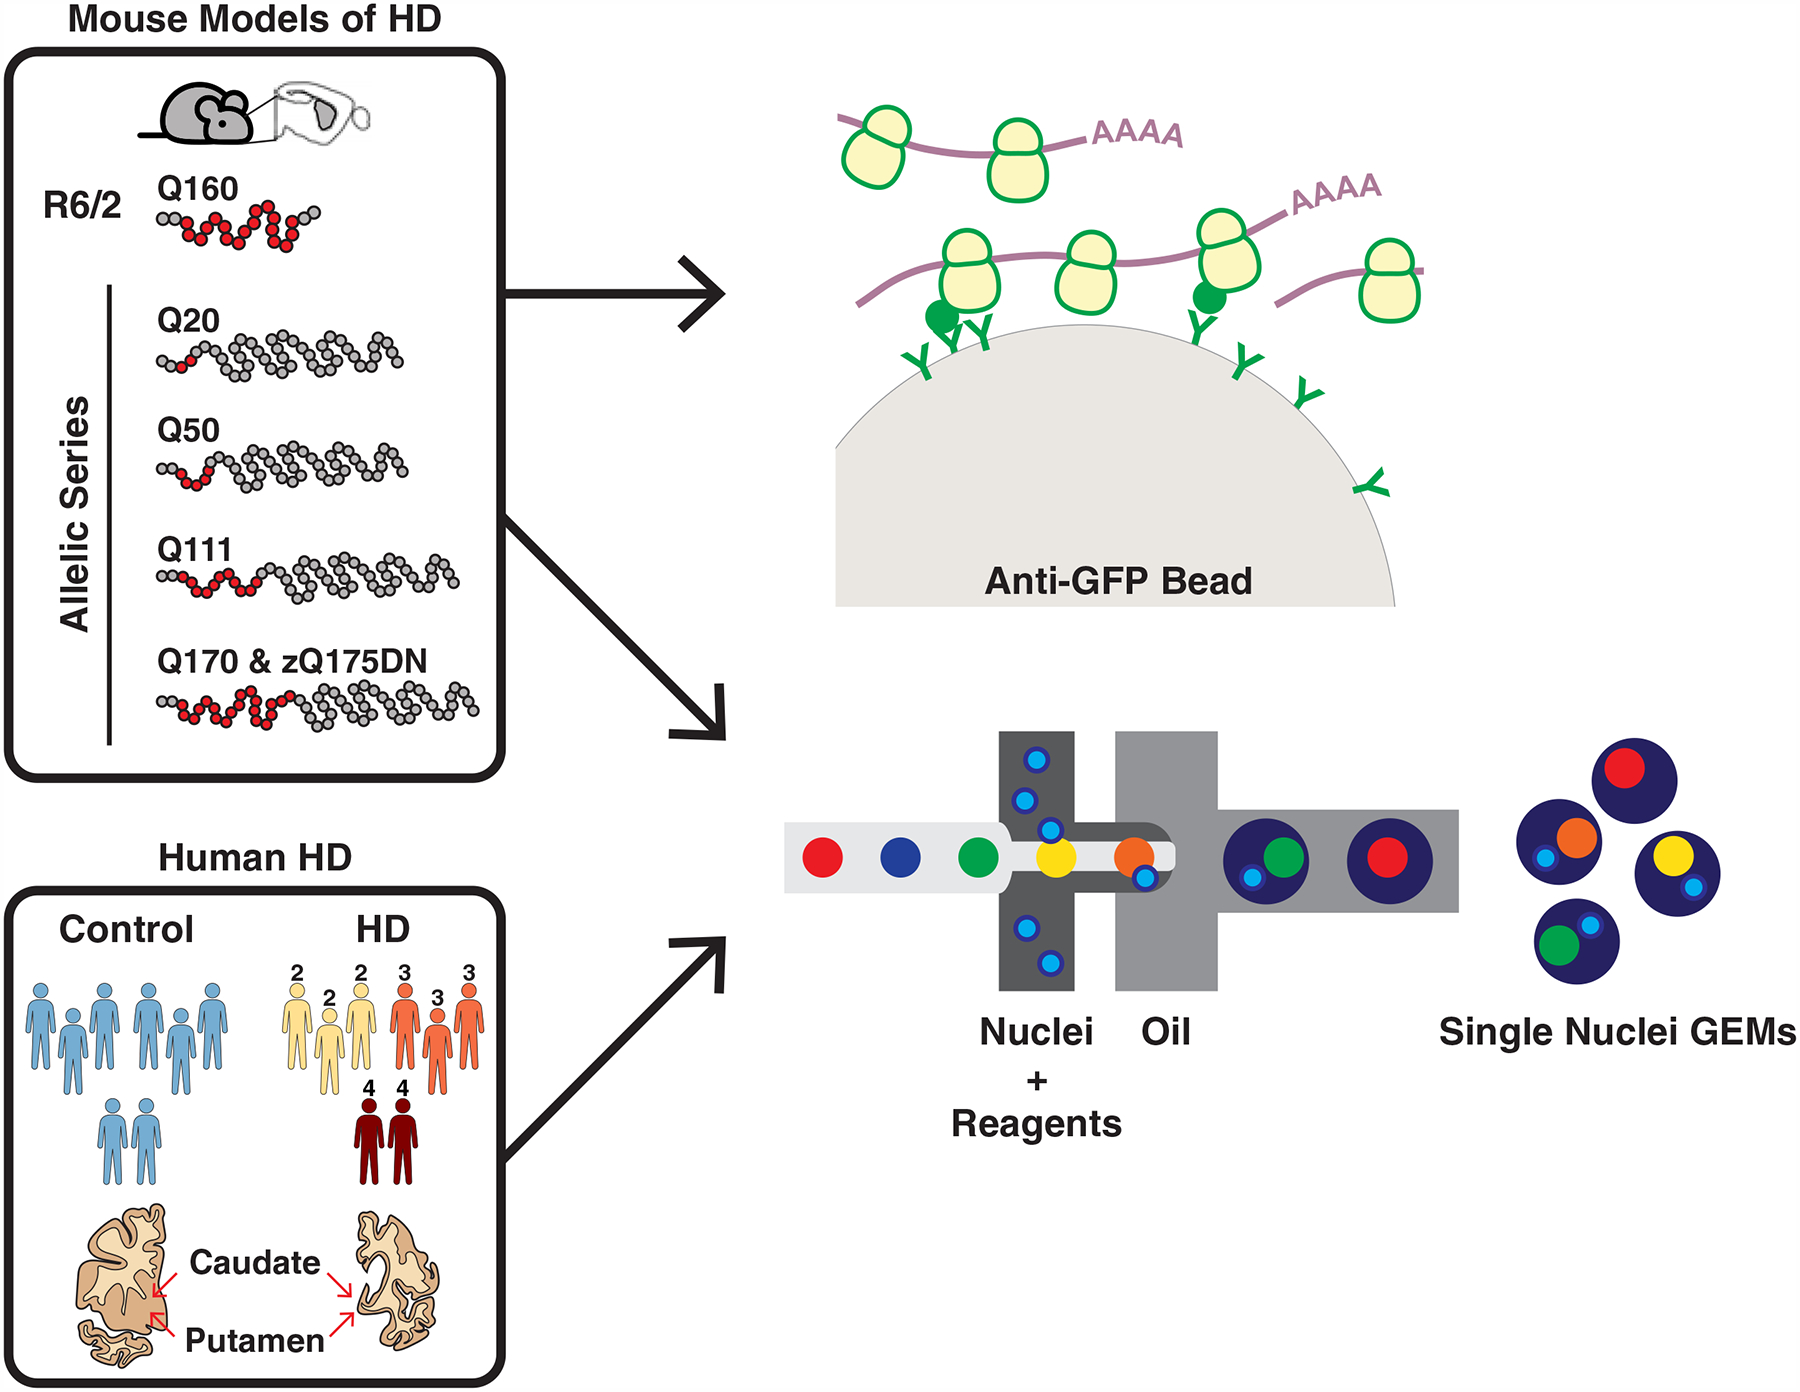
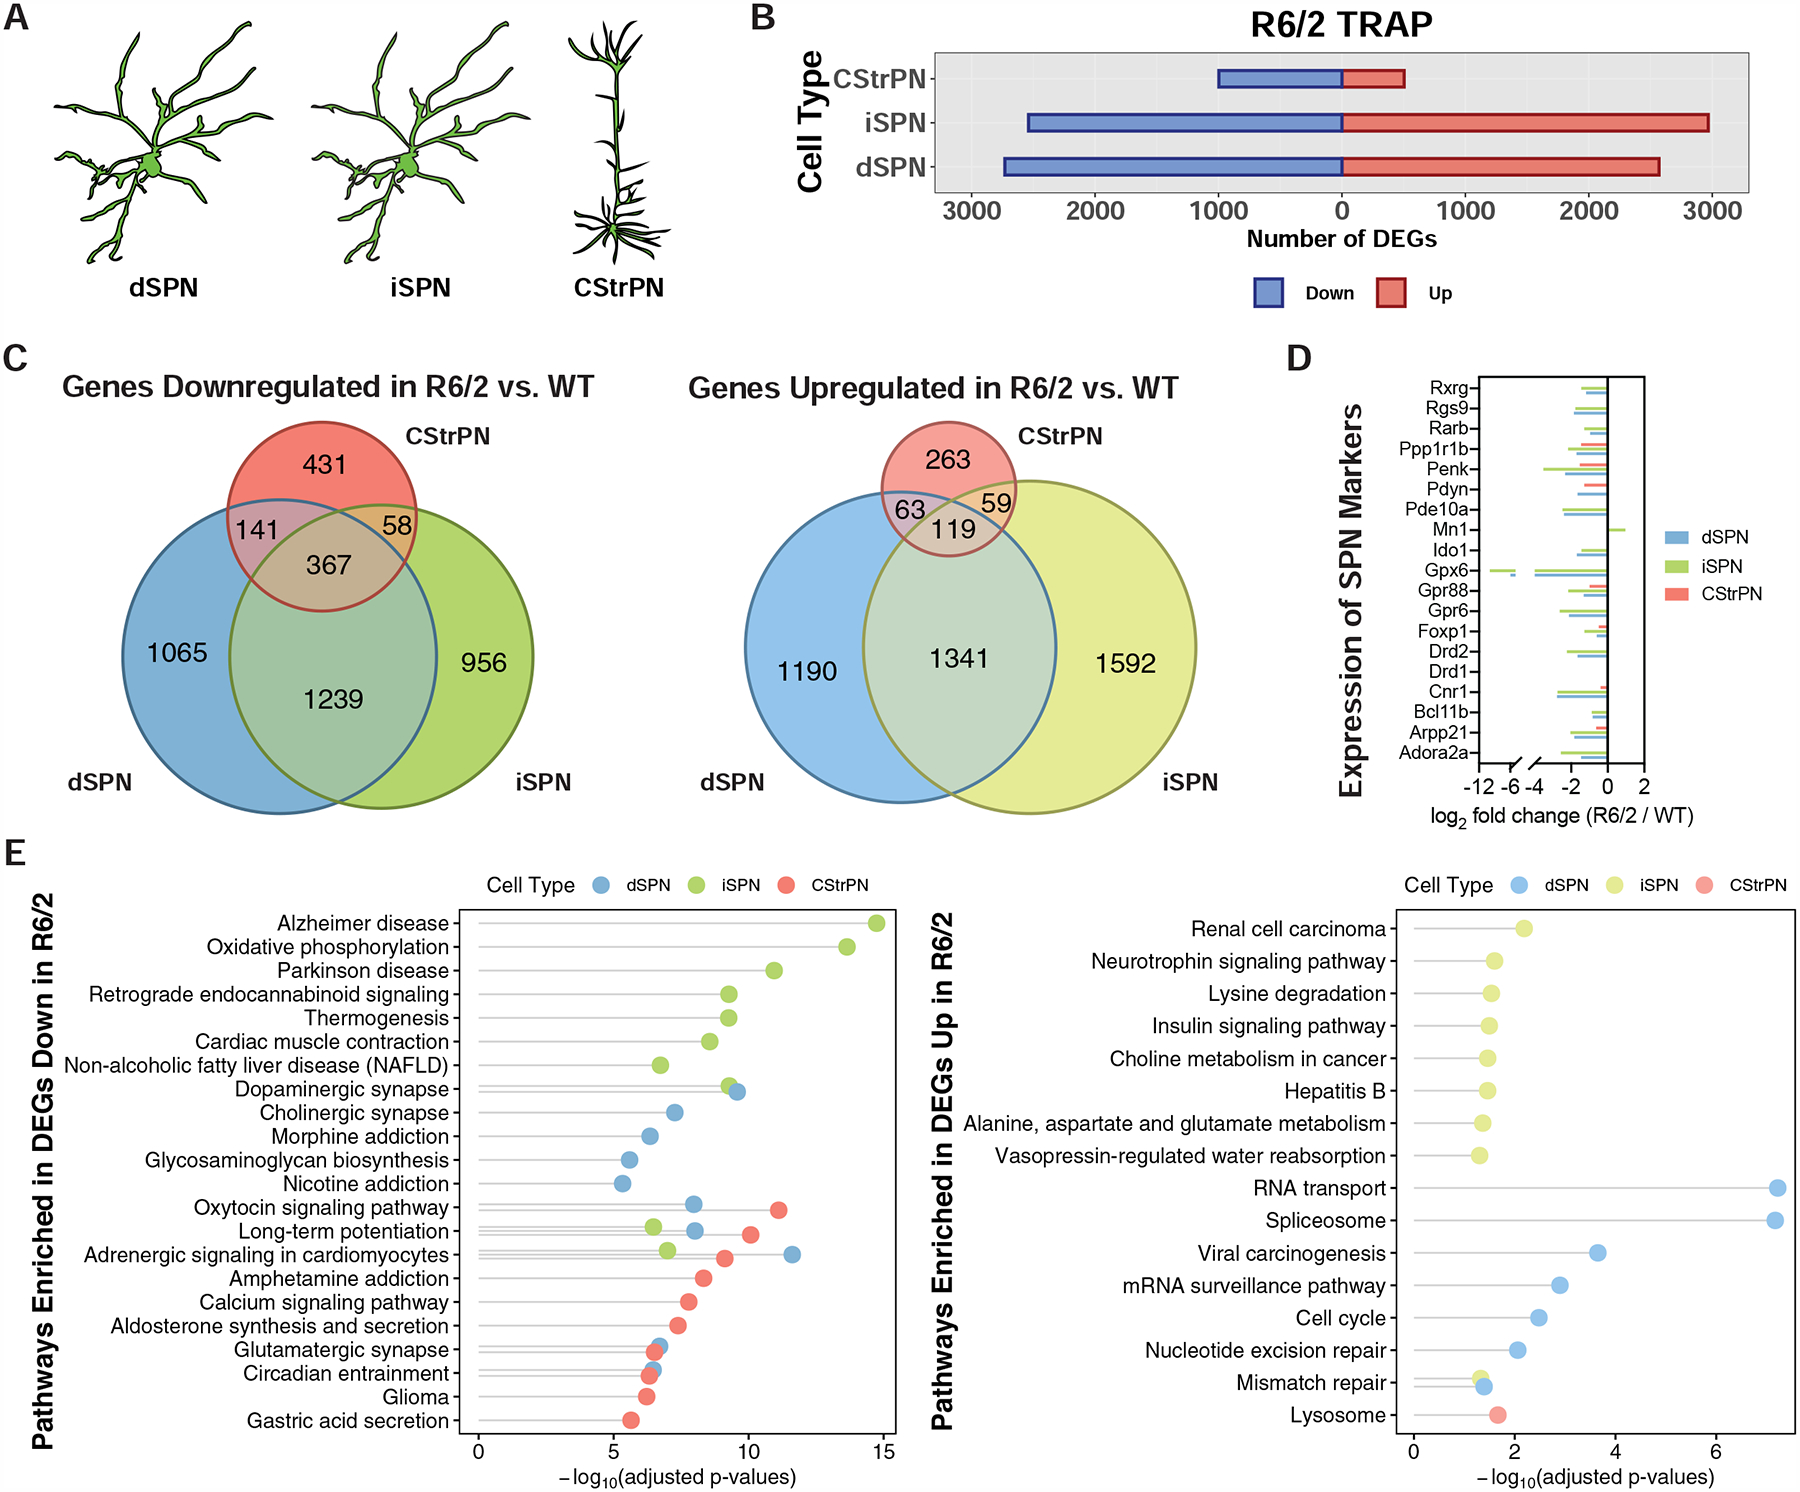
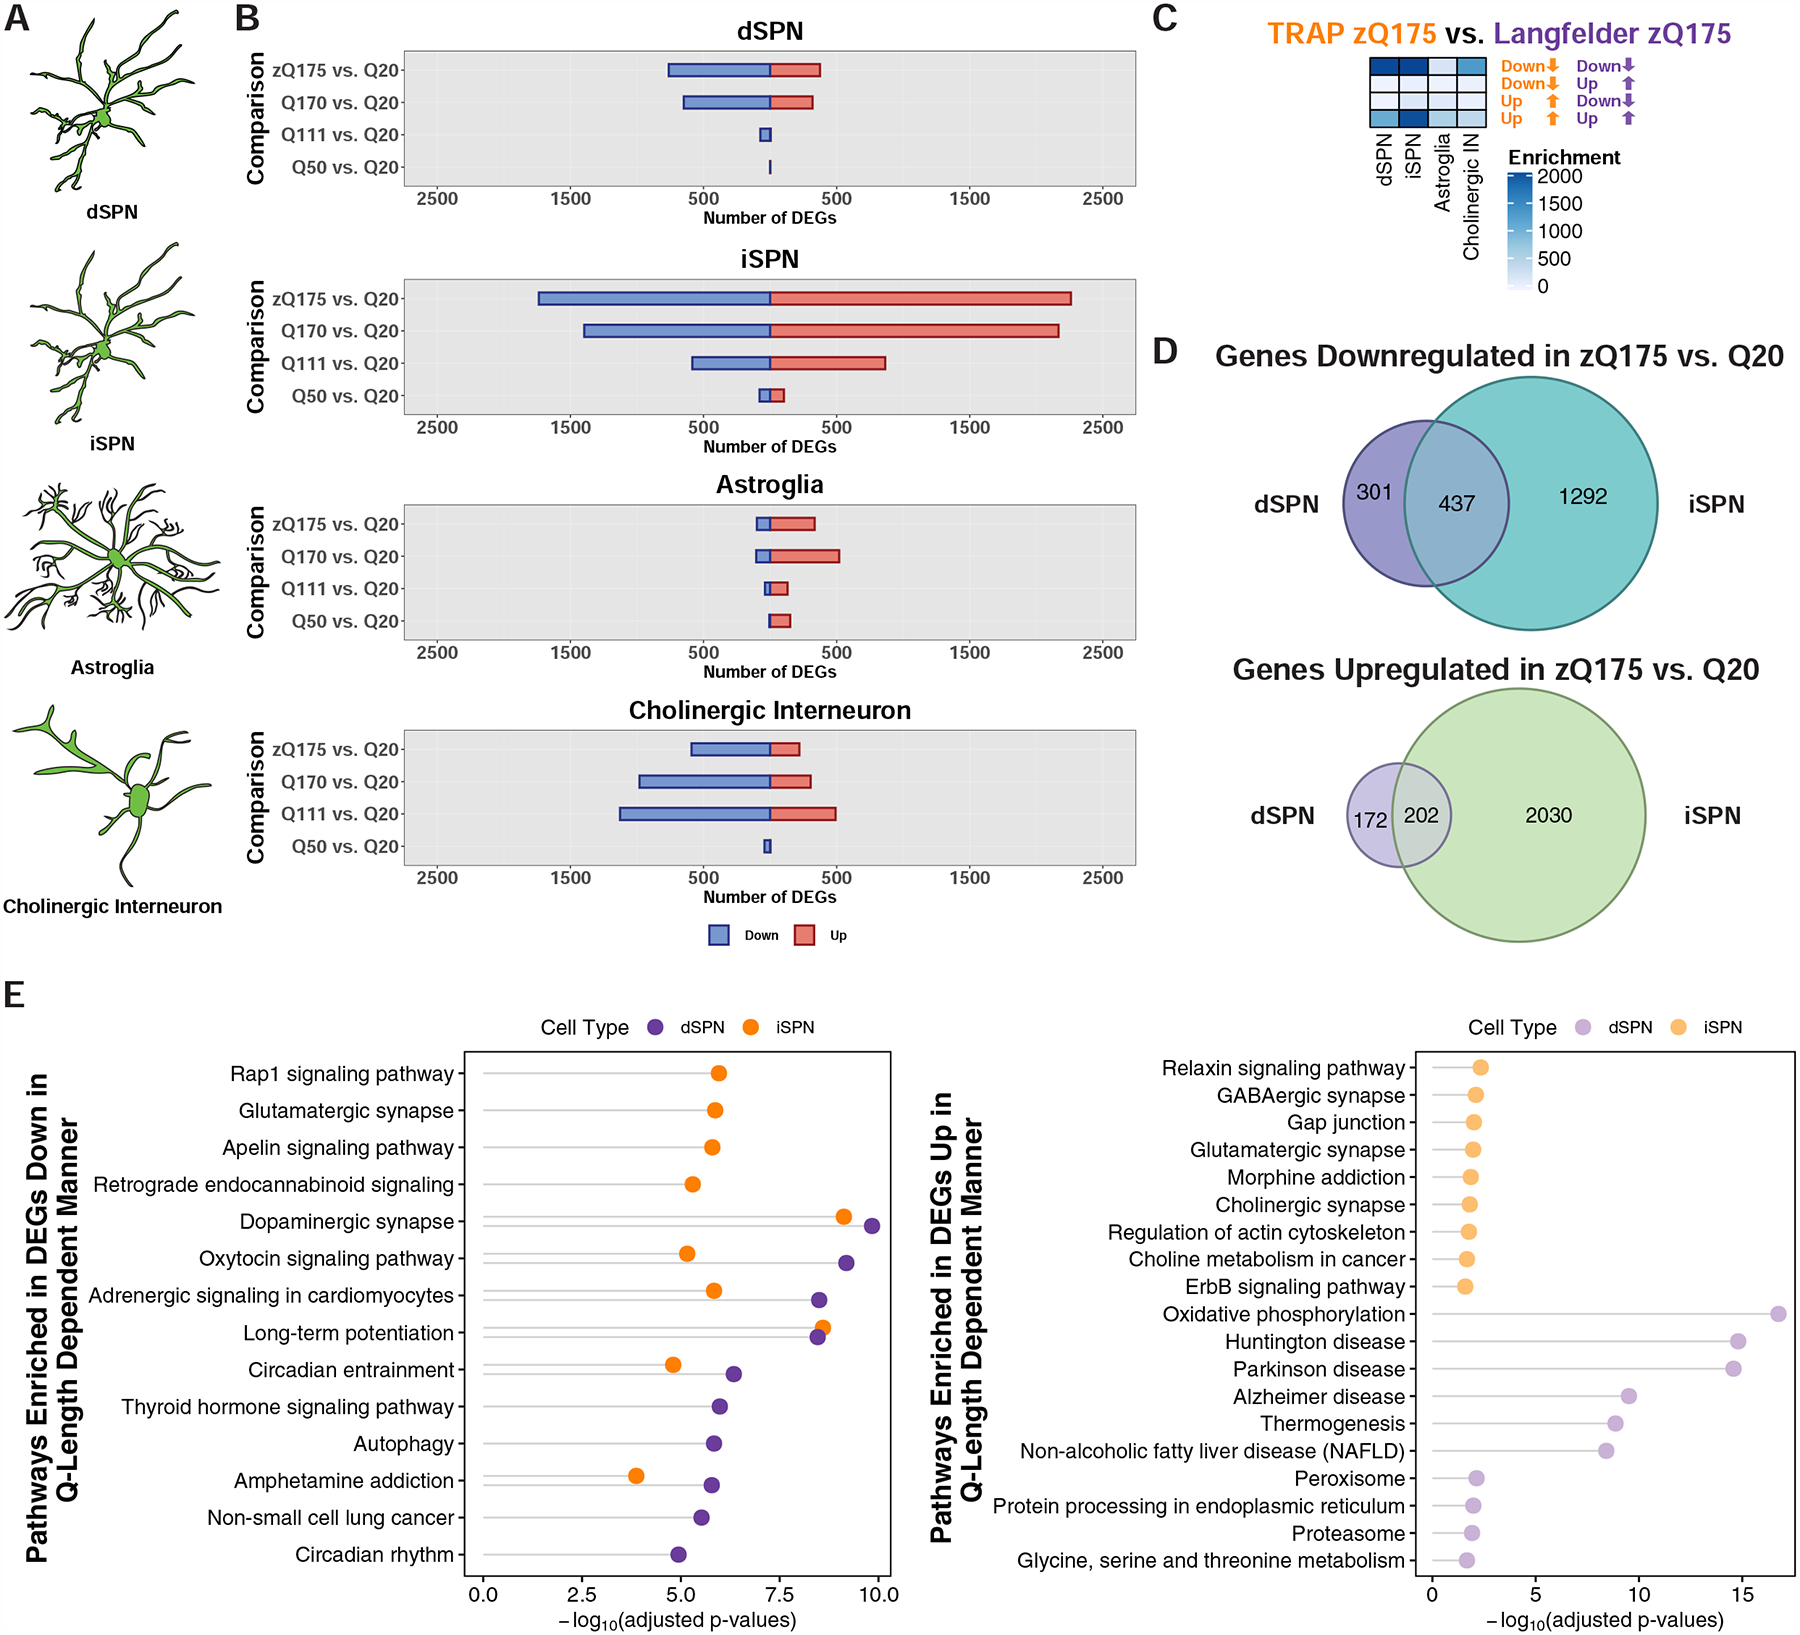
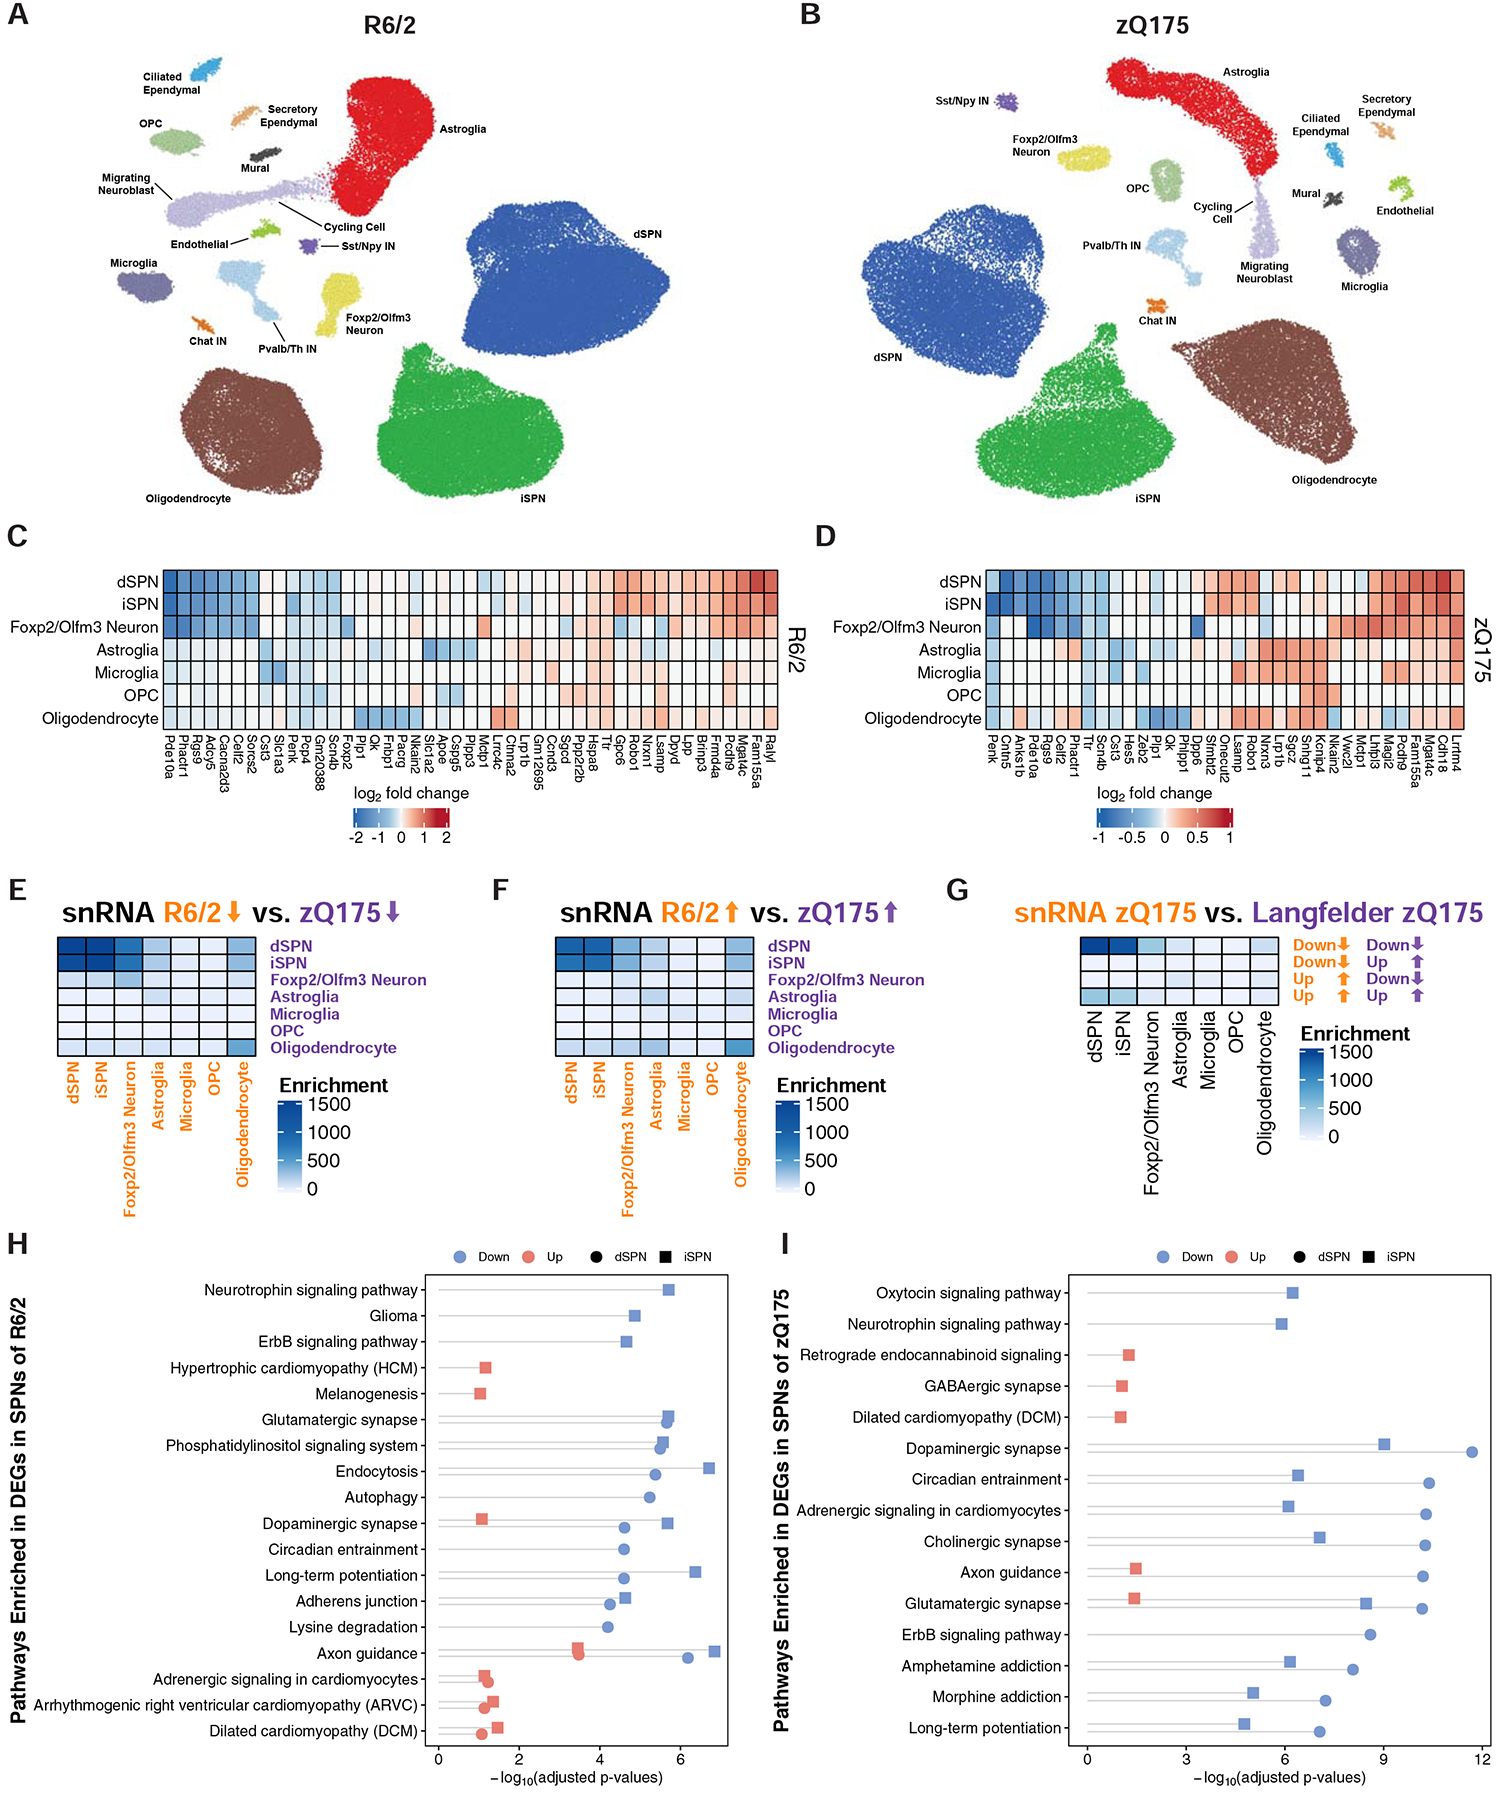
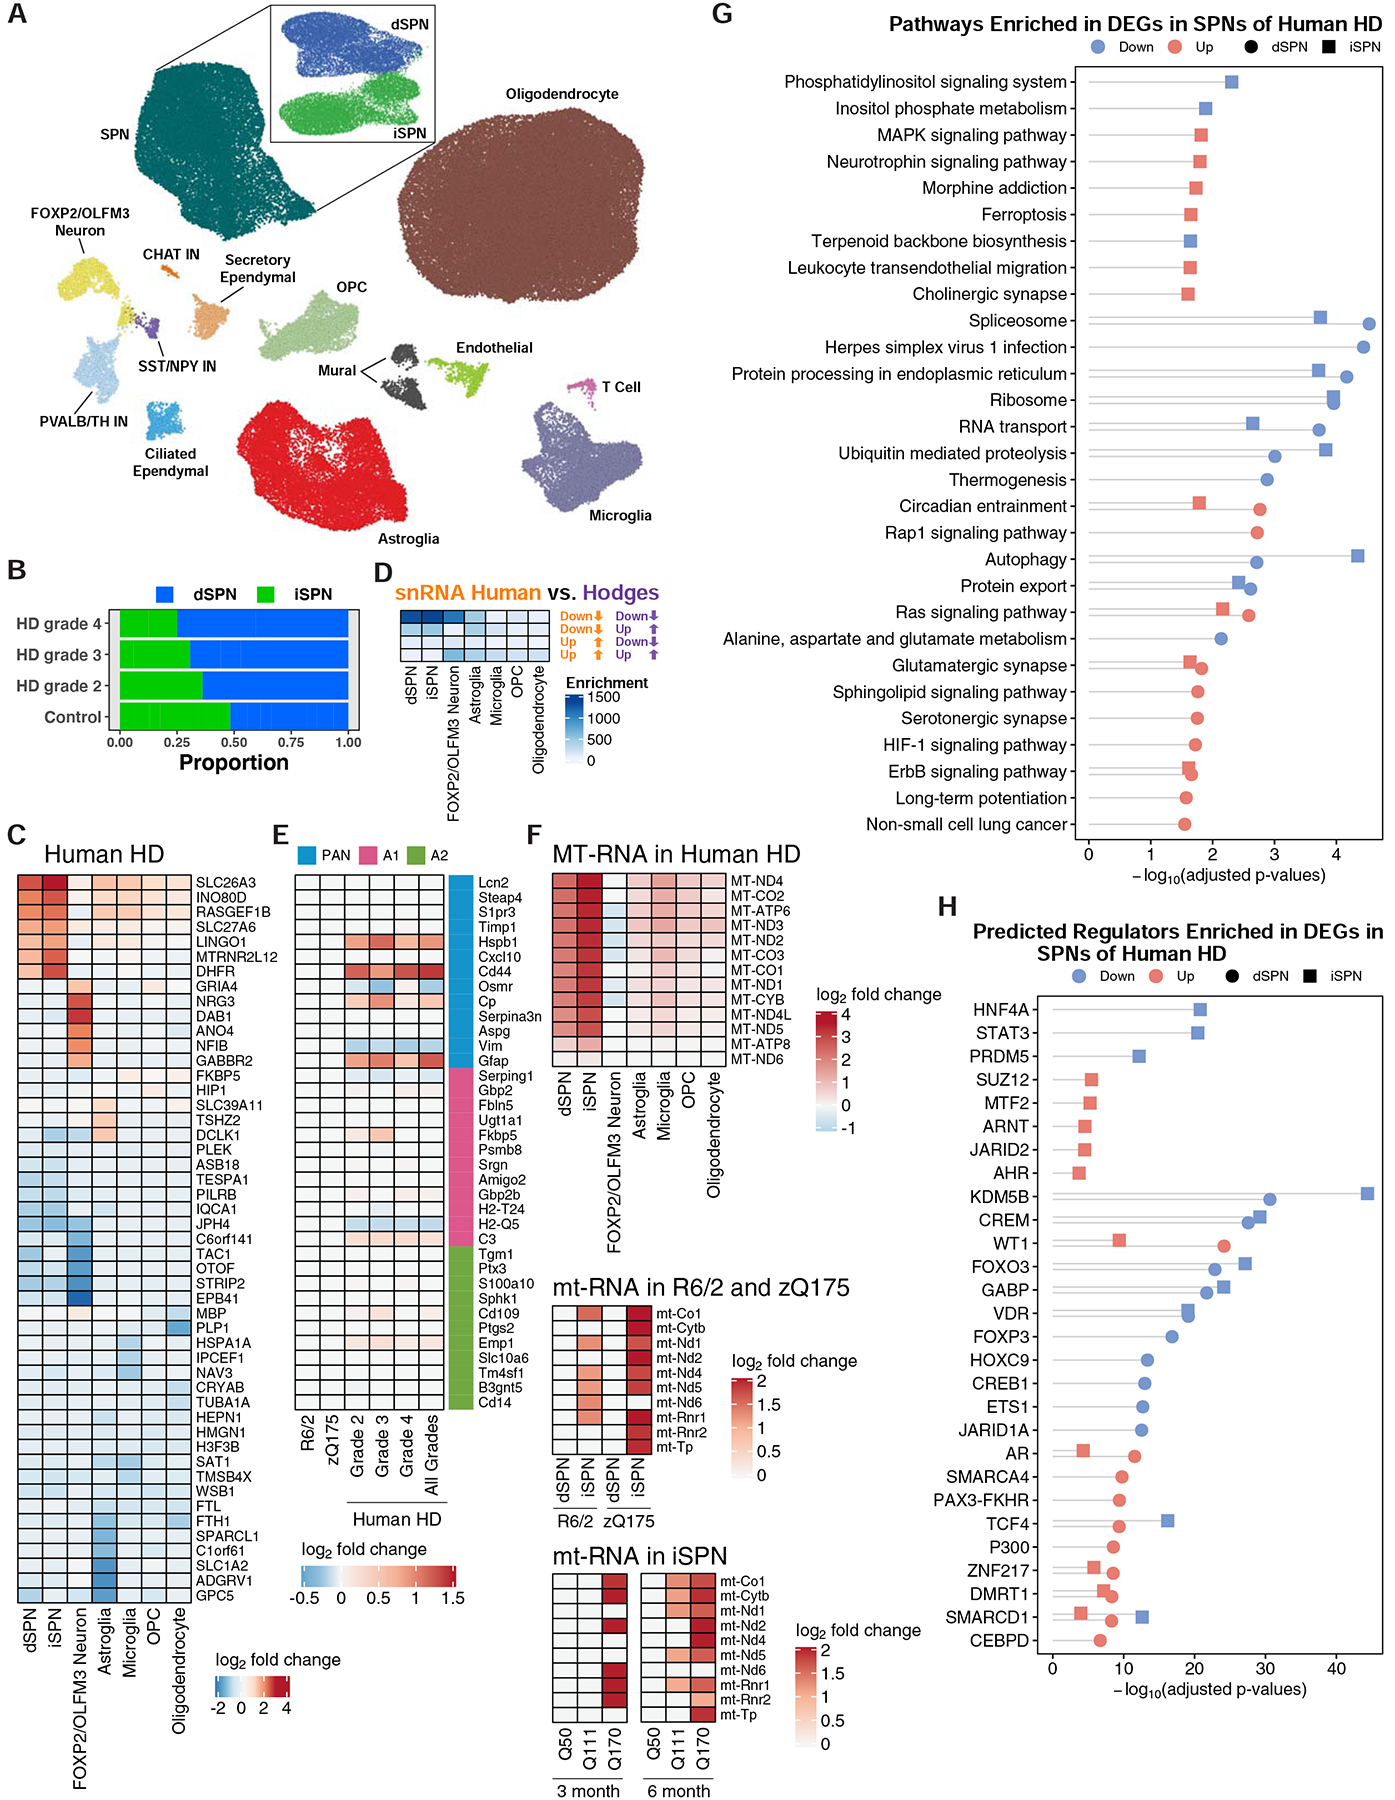
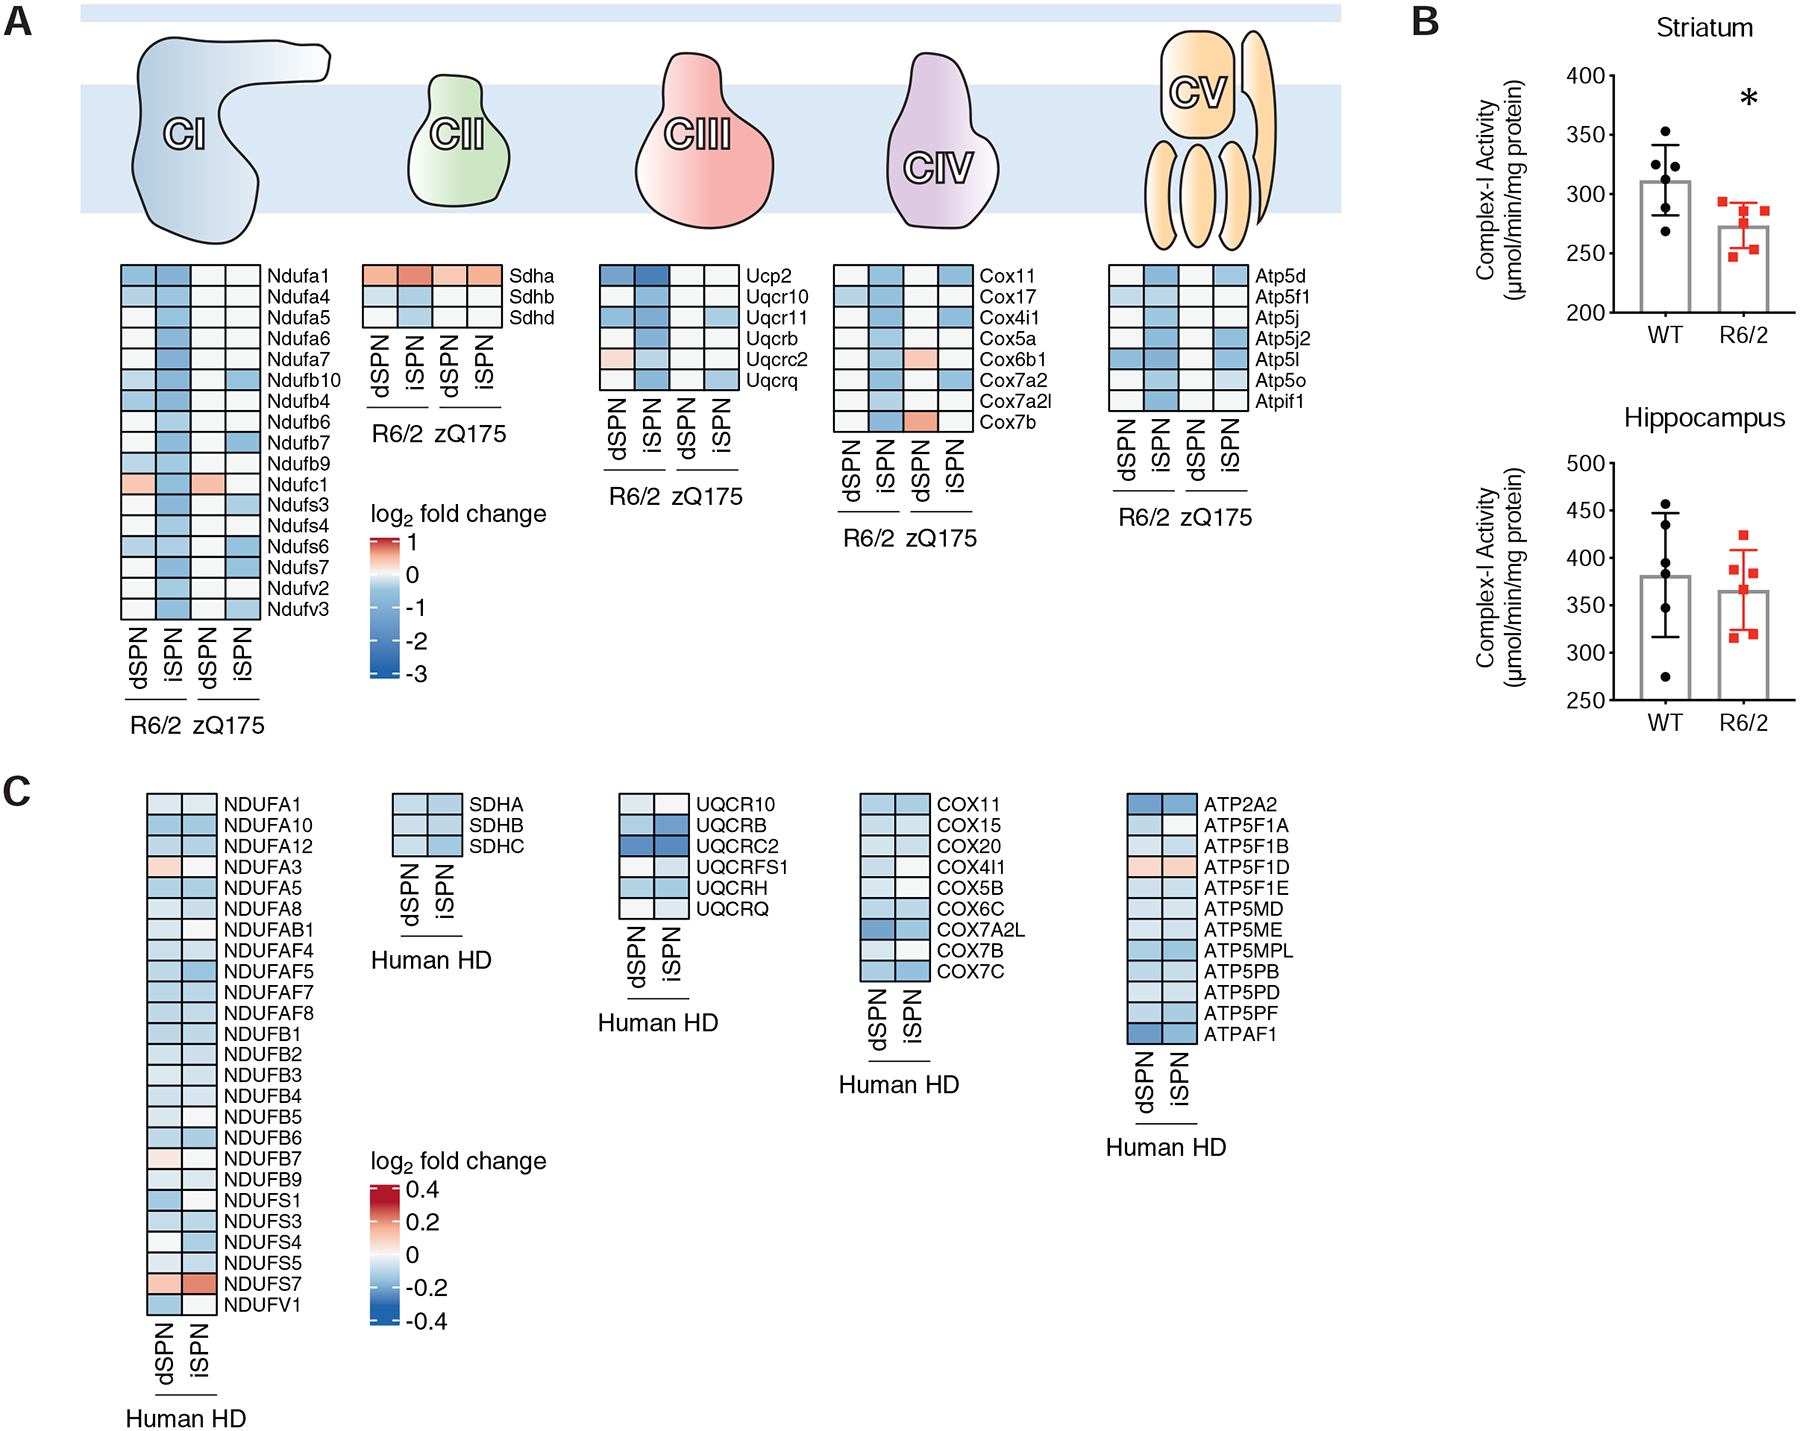
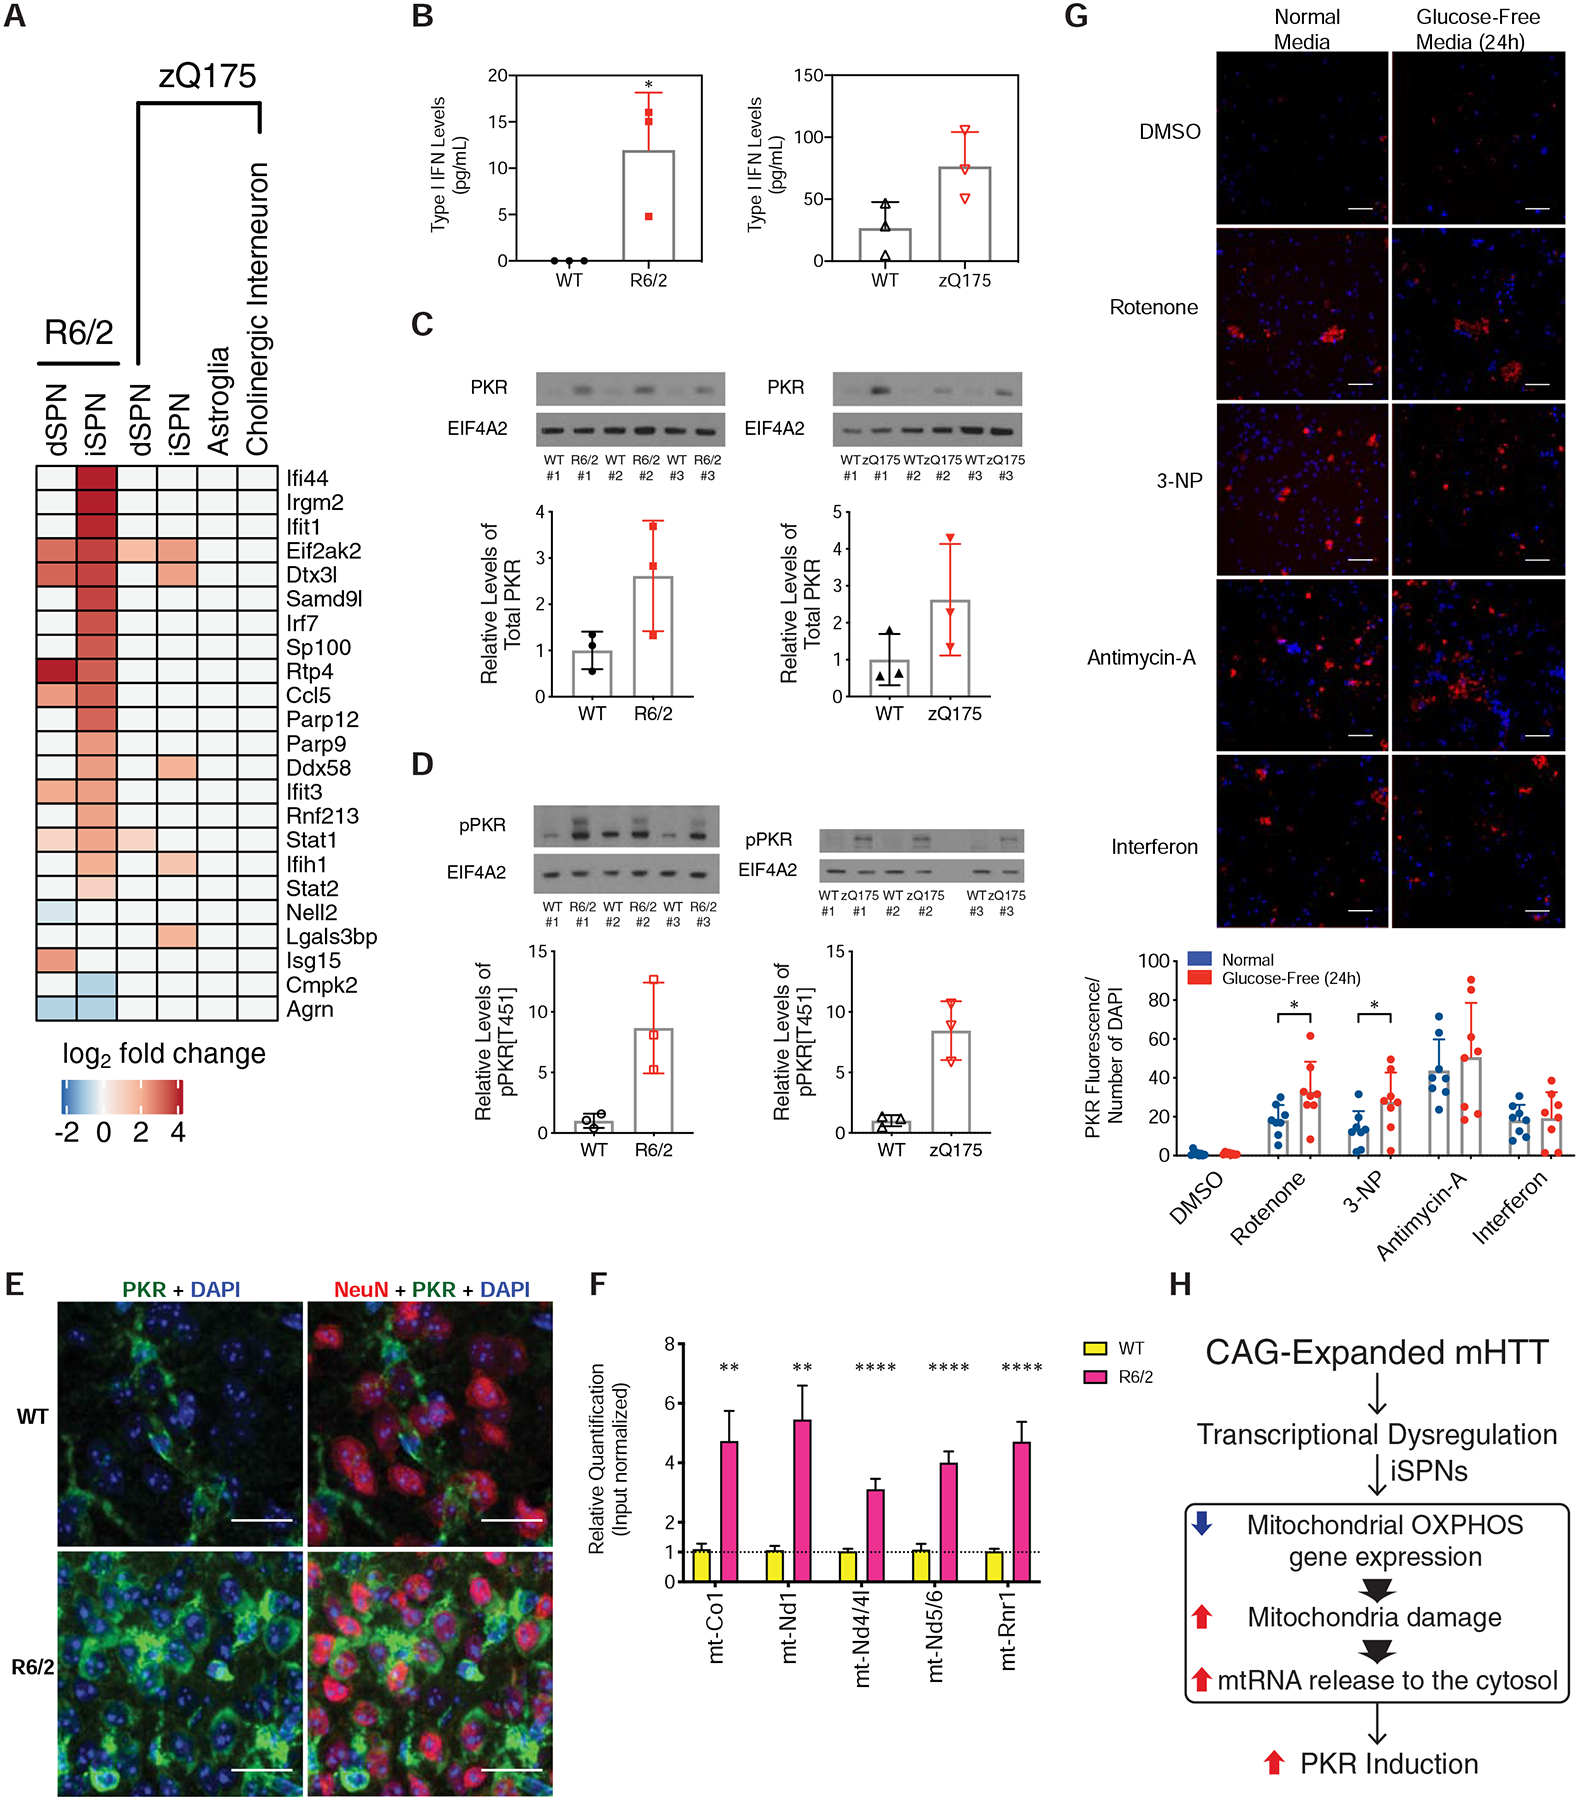
The mechanisms by which mutant huntingtin (mHTT) leads to neuronal cell death in Huntington's disease (HD) are not fully understood. To gain new molecular insights, we used single nuclear RNA sequencing (snRNA-seq) and translating ribosome affinity purification (TRAP) to conduct transcriptomic analyses of caudate/putamen (striatal) cell type-specific gene expression changes in human HD and mouse models of HD. In striatal spiny projection neurons, the most vulnerable cell type in HD, we observe a release of mitochondrial RNA (mtRNA) (a potent mitochondrial-derived innate immunogen) and a concomitant upregulation of innate immune signaling in spiny projection neurons. Further, we observe that the released mtRNAs can directly bind to the innate immune sensor protein kinase R (PKR). We highlight the importance of studying cell type-specific gene expression dysregulation in HD pathogenesis and reveal that the activation of innate immune signaling in the most vulnerable HD neurons provides a novel framework to understand the basis of mHTT toxicity and raises new therapeutic opportunities.


Conflict of interest statement

Declaration of Interests M.H. is a member of the Hereditary Disease Foundation’s Scientific Advisory Board, and T.V. and H.W. are employed by CHDI Management, Inc., as advisors to the CHDI Foundation, Inc.

Figures

Figure 1.
Figure 1.. Cell type-specific striatal gene expression profiling across HD and mouse models of HD.
The commonly used transgenic R6/2 exon 1 mHTT fragment HD model and the allelic series knockin mHtt (Q20, Q50, Q111, Q170, and zQ175DN) HD models were used for translating ribosome affinity purification (TRAP) profiling, which purifies mature, cytoplasmically localized mRNAs by immunoaffinity purification of GFP-tagged ribosome complexes in genetically defined cell types. The R6/2 and zQ175DN models were also used for single nuclear RNA-Sequencing (snRNA-Seq), which reports gene expression changes based on captured nuclear sequences. HD grade 2–4 patient and control caudate and putamen (striatal) tissue samples were also used for snRNA-Seq.
Figure 2.
Figure 2.. Cell type-specific analysis of gene expression changes in striatal spiny projection neurons (SPNs) and corticostriatal projection neurons (CStrPNs) of the R6/2 model of HD by TRAP.
(A) Schematic depicting the targeting of striatal dSPNs, striatal iSPNs, and cortical CStrPNs. (B) Number of genes that were differentially expressed at the translated mRNA level in dSPNs, iSPNs, and CStrPNs in the R6/2 model at 9-weeks of age. (C) Venn diagrams representing unique and common differentially expressed genes across the three cell types (left panel: downregulated genes; right panel: upregulated genes). (D) Plot showing downregulation of SPN marker genes in the dSPN, iSPN, and CStrPN TRAP data. (E) Enriched KEGG pathways of genes downregulated (left panel) and upregulated (right panel) across the three cell types, represented with Fisher’s exact test −log10-adjusted p-value.
Figure 3.
Figure 3.. Cell type-specific analysis of gene expression changes in striatal spiny projection neurons (SPNs), astroglia, and cholinergic interneurons of the allelic series knockin models of HD by TRAP.
(A) Schematic depicting the targeting of striatal dSPNs, iSPNs, astroglia, and cholinergic interneurons. (B) Number of genes that were differentially expressed at the translated mRNA level in each of the cell types indicated at 6-months of age. (C) Overlap of the zQ175DN model downregulated and upregulated genes identified by cell type-specific TRAP and bulk RNA-Seq from the cited Langfelder et al. study. Overlaps were assessed using Fisher’s exact test and −log10-adjusted p-values are reported in the heatmap. (D) Venn overlap analysis of differentially expressed genes in the zQ175DN vs. Q20 comparisons between dSPNs and iSPNs (top panel: downregulated; bottom panel: upregulated). (E) KEGG pathway enrichment analysis of genes downregulated (left) and upregulated (right) in dSPNs and iSPNs from the linear regression analysis of CAG-length dependent changes, represented with Fisher’s exact test −log10-adjusted p-value.
Figure 4.
Figure 4.. Cell type-specific analysis of gene expression changes in striatal cell types of the R6/2 and zQ175DN models of HD by single nuclear RNA-Sequencing (snRNA-Seq).
(A-B) Two-dimensional ACTIONet graphs of the major annotated cell types in the R6/2 (A) and zQ175DN (B) mouse models of HD (n = 108,467 nuclei across fifteen mice: eight isogenic control and seven R6/2 model mice, all at 9-weeks of age; n = 50,643 nuclei across eight mice: four isogenic control and four zQ175DN model mice, all at 6-months of age). Top five most downregulated and upregulated protein-coding genes by log2-fold change in the most abundant striatal cell types in the R6/2 model vs. control (C) or zQ175DN vs. control (D) comparisons. Significance of the overlap between cell type-specific (E) downregulated and (F) upregulated genes of snRNA-Seq-identified cell types across mouse models (Fisher’s exact test −log10-adjusted p-value). (G) Significance of overlap between downregulated and upregulated genes identified by snRNA-Seq and bulk RNA-Seq from the cited Langfelder et al. study in the zQ175DN model. The overlaps were assessed using Fisher’s exact test and −log10-adjusted p-values are reported. KEGG pathway analysis of downregulated and upregulated genes in dSPNs and iSPNs in the R6/2 (H) and zQ175DN (I) models, represented with Fisher’s exact test −log10-adjusted p-value.
Figure 5.
Figure 5.. Cell type-specific analysis of gene expression changes in caudate and putamen cell types in control and HD post-mortem tissue by single nuclear RNA-Sequencing (snRNA-Seq).
(A) Two-dimensional ACTIONet graphs of the recovered cell types in control and HD samples (n = 125,467 nuclei across fourteen unaffected control and fourteen HD caudate and putamen samples, samples described in Table S2). Subpanel: subACTIONet graph of SPN subtypes. (B) Average fraction of dSPNs vs. iSPNs across grades of HD relative to control samples. (C) Top five most downregulated and upregulated protein-coding genes by log2-fold change in the most abundant striatal cell types. (D) Significance of overlap between downregulated and upregulated genes identified by this snRNA-Seq study to total striatal data from the cited Hodges et al. study (Fisher’s exact test and −log10-adjusted p-values). (E) Differential expression of reactive astroglia marker genes in astroglia across grades of human HD but not mouse models of HD. (F) Upregulation of mtRNAs in major striatal cell types in human HD by snRNA-Seq and in R6/2 and zQ175DN mouse models by TRAP. D-F: Overlaps were assessed using Fisher’s exact test and −log10-adjusted p-values are reported in the heatmap. (G) KEGG pathway analysis of genes downregulated and upregulated in dSPNs and iSPNs, represented with Fisher’s exact test −log10-adjusted p-value. (H) Predicted transcriptional regulators, by ChEA analysis, of genes that were downregulated and upregulated across dSPNs and iSPNs, represented with Fisher’s exact test −log10-adjusted p-value.
Figure 6.
Figure 6.. Mitochondrial oxidative phosphorylation pathway mRNAs are downregulated in SPNs of the R6/2 and zQ75DN models, as well as SPNs of HD tissue.
A. Schematic of the OXPHOS component complexes, with log2-fold change heat maps depicting altered expression of OXPHOS component mRNAs in dSPNs or iSPNs of the R6/2 model at 9-weeks of age or the zQ175DN model (compared to the Q20 control) at 6-months of age. B. OXPHOS Complex I activity measurement from whole R6/2 tissue at 9-weeks of age (top panel: striatum; bottom panel: hippocampus control). C. Heatmaps depicting altered expression of OXPHOS component mRNAs in dSPNs or iSPNs of human HD tissue.
Figure 7.
Figure 7.. PKR-mediated innate immune pathways are activated by mHTT.
(A) Heatmap of expression of known interferon-stimulated genes and antiviral signaling factors related to innate immune signaling (West et al., 2015) in our TRAP data. (B) Interferon ELISA assay results from whole striatal tissue from the R6/2 model at 9-weeks of age (left panel) or the zQ175DN model at 23-months of age (right panel). (C) Western blot analysis of total PKR levels in whole striatal tissue from the R6/2 model at 9-weeks of age (left panel) or the zQ175DN model at 23-months of age (right panel). (D) Western blot analysis of phospho-PKR levels in whole striatal tissue from the R6/2 model at 9-weeks of age (left panel) or the zQ175DN model at 23-months of age (right panel). (E) Indirect immunofluorescent staining against NeuN (red pseudocolor), total PKR (green pseudocolor), and DAPI (blue pseudocolor), in the R6/2 and isogenic control striatum at 9-weeks of age, 40X magnification. Scale bar is 20 μm. (F) Quantitative PCR (qPCR) of mtRNAs associated with PKR after immunopurification of PKR from cytosolic extracts of either R6/2 or isogenic control striatum. (**) denotes p-value < 0.0021; (****) denotes p-value < 0.0001; multiple t-test using the two-stage linear step-up procedure of Benjamini, Krieger and Yekutieli, with Q = 1%. (G) Top panel: representative images of indirect immunofluorescent staining against total PKR (red pseudocolor) and DAPI (blue pseudocolor), in cultured day in vitro 14 iPSC-derived induced human neurons treated with DMSO vehicle control, 30 mg/mL interferon-β (a positive control treatment known to induce PKR) or mitochondrial oxidative phosphorylation inhibitors [50 nM Complex I inhibitor rotenone, 10 μM Complex II inhibitor 3-nitropropionic acid (3-NP), and 1 μM Complex III inhibitor antimycin-A] in both normal media containing either glucose-containing media or glucose-free media to increase dependency upon OXPHOS function. Scale bar = 0.45 mm. Bottom panel: quantitation across 8 images in each condition, * = p-value < 0.05, two-tailed Student’s t-test. (H) Model for innate immune activation by mutant HTT (mHTT). mHTT can induce transcriptional dysregulation in several cell types. In iSPNs, mHTT leads to a reduction in oxidative phosphorylation gene expression, which along with other mitochondrial insults leads to mitochondrial damage and release of innate immunogenic mtRNAs into the iSPN cytosol. These released mtRNAs then bind to PKR, triggering a high level of innate immune activation in iSPNs.

Comment in

References

    1. Albin RL, Reiner A, Anderson KD, Dure L.S.t., Handelin B, Balfour R, Whetsell WO Jr., Penney JB, and Young AB (1992). Preferential loss of striato-external pallidal projection neurons in presymptomatic Huntington’s disease. Annals of neurology 31, 425–430. - PubMed
    1. Alfadhel M, Almuntashri M, Jadah RH, Bashiri FA, Al Rifai MT, Al Shalaan H, Al Balwi M, Al Rumayan A, Eyaid W, and Al-Twaijri W (2013). Biotin-responsive basal ganglia disease should be renamed biotin-thiamine-responsive basal ganglia disease: a retrospective review of the clinical, radiological and molecular findings of 18 new cases. Orphanet journal of rare diseases 8, 83. - PMC - PubMed
    1. Alvarez MJ, Shen Y, Giorgi FM, Lachmann A, Ding BB, Ye BH, and Califano A (2016). Functional characterization of somatic mutations in cancer using network-based inference of protein activity. Nature genetics 48, 838–847. - PMC - PubMed
    1. Banez-Coronel M, Ayhan F, Tarabochia AD, Zu T, Perez BA, Tusi SK, Pletnikova O, Borchelt DR, Ross CA, Margolis RL, et al. (2015). RAN Translation in Huntington Disease. Neuron 88, 667–677. - PMC - PubMed
    1. Becht E, McInnes L, Healy J, Dutertre CA, Kwok IWH, Ng LG, Ginhoux F, and Newell EW (2018). Dimensionality reduction for visualizing single-cell data using UMAP. Nature biotechnology. - PubMed

Publication types