

Defining Myocardial Abnormalities Across the Stages of Chronic Kidney Disease: A Cardiac Magnetic Resonance Imaging Study
- PMID: 32682713
- PMCID: PMC7607516
- DOI: 10.1016/j.jcmg.2020.04.021
Defining Myocardial Abnormalities Across the Stages of Chronic Kidney Disease: A Cardiac Magnetic Resonance Imaging Study
Abstract
Objectives: A proof of concept cross-sectional study investigating changes in myocardial abnormalities across stages of chronic kidney disease (CKD). Characterizing noninvasive markers of myocardial fibrosis on cardiac magnetic resonance, echocardiography, and correlating with biomarkers of fibrosis, myocardial injury, and functional correlates including exercise tolerance.
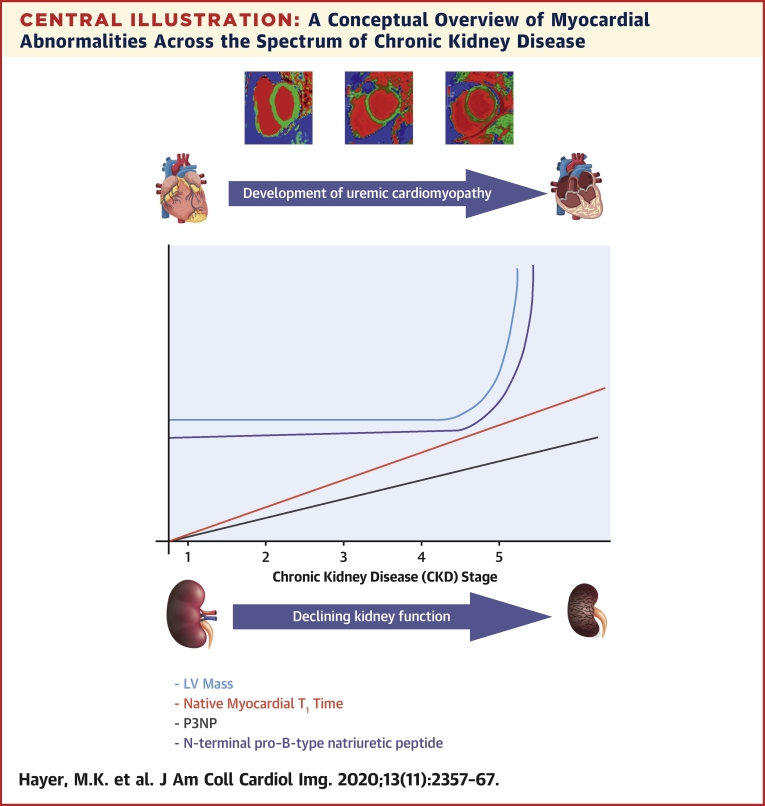
Background: CKD is associated with an increased risk of cardiovascular death. Much of the excess mortality is attributed to uremic cardiomyopathy, defined by increased left ventricular hypertrophy, myocardial dysfunction, and fibrosis. The prevalence of these abnormalities across stages of CKD and their impact on cardiovascular performance is unknown.
Methods: A total of 134 nondiabetic, pre-dialysis subjects with CKD stages 2 to 5 without myocardial ischemia underwent cardiac magnetic resonance (1.5-T) including; T1 mapping (biomarker of diffuse fibrosis), T2 mapping (edema), late gadolinium enhancement, and assessment of aortic distensibility. Serum biomarkers including collagen turnover (P1NP, P3NP), troponin T, and N-terminal pro-B-type natriuretic peptide were measured. Cardiovascular performance was quantified by bicycle cardiopulmonary exercise testing and echocardiography.
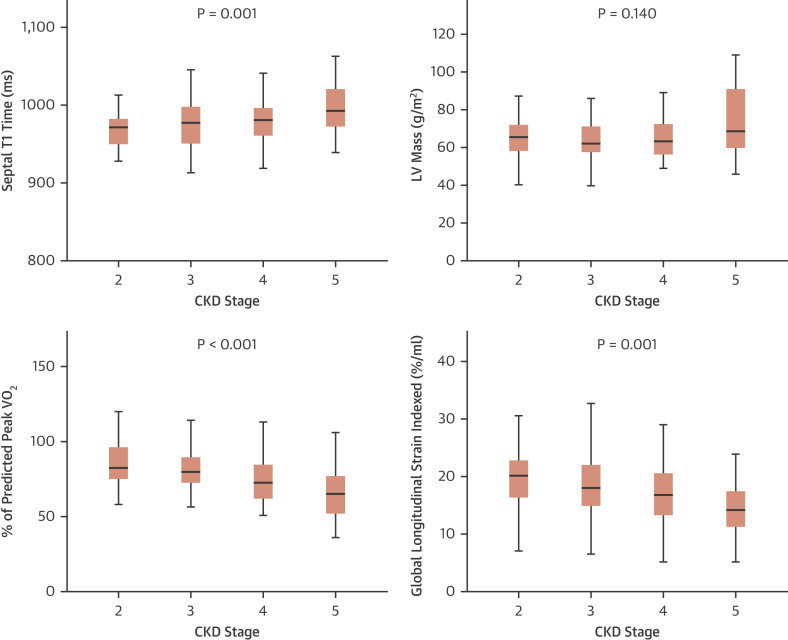
Results: Native myocardial T1 times increased incrementally from stage 2 to 5 (966 ± 21 ms vs. 994 ± 33 ms; p < 0.001), independent of hypertension and aortic distensibility. Left atrial volume, E/e', N-terminal pro-B-type natriuretic peptide, P1NP, and P3NP increased with CKD stage (p < 0.05), while effort tolerance (% predicted VO2Peak, %VO2VT) decreased (p < 0.001). In multivariable linear regression models, estimated glomerular filtration rate was the strongest predictor of native myocardial T1 time (p < 0.001). Native myocardial T1 time, left atrial dilatation, and high-sensitivity troponin T were independent predictors of % predicted VO2Peak (p < 0.001).
Conclusions: Imaging and serum biomarkers of myocardial fibrosis increase with advancing CKD independent of effects of left ventricular afterload and might be a key intermediary in the development of uremic cardiomyopathy. Further studies are needed to determine whether these changes lead to the increased rates of heart failure and death in CKD. (Left Ventricular Fibrosis in Chronic Kidney Disease [FibroCKD]; NCT03176862).
Keywords: T(1) mapping; myocardial fibrosis; uremic cardiomyopathy.
Copyright © 2020 American College of Cardiology Foundation. Published by Elsevier Inc. All rights reserved.
Conflict of interest statement
Author Relationship With Industry This study is supported by the British Heart Foundation (PG/15/117/31961). Dr. Weston is funded by the National Institute for Health Research (NIHR) Birmingham Biomedical Research Centre at the University Hospitals Birmingham NHS Foundation Trust and the University of Birmingham. All other authors have reported that they have no relationships relevant to the contents of this paper. This paper presents independent research supported by the NIHR Birmingham Biomedical Research Centre at the University Hospitals Birmingham NHS Foundation Trust and the University of Birmingham. The views expressed are those of the author(s) and not necessarily those of the NHS, the NIHR, or the Department of Health and Social Care.
Figures

Comment in
-
Multiparametric Cardiac Magnetic Resonance for Chronic Kidney Disease: Mapping the Footprints of a "Silent Killer"?JACC Cardiovasc Imaging. 2020 Nov;13(11):2368-2370. doi: 10.1016/j.jcmg.2020.08.022. JACC Cardiovasc Imaging. 2020. PMID: 33153533 No abstract available.
References
-
- Couser W.G., Remuzzi G., Mendis S., Tonelli M. The contribution of chronic kidney disease to the global burden of major noncommunicable diseases. Kidney Int. 2011;80:1258–1270. - PubMed
-
- Wanner C., Amann K., Shoji T. The heart and vascular system in dialysis. Lancet. 2016;388:276–284. - PubMed
-
- Edwards N.C., Moody W.E., Chue C.D., Ferro C.J., Townend J.N., Steeds R.P. Defining the natural history of uremic cardiomyopathy in chronic kidney disease: the role of cardiovascular magnetic resonance. J Am Coll Cardiol Img. 2014;7:703–714. - PubMed
-
- Mark P.B., Johnston N., Groenning B.A. Redefinition of uremic cardiomyopathy by contrast-enhanced cardiac magnetic resonance imaging. Kidney Int. 2006;69:1839–1845. - PubMed
Publication types
MeSH terms
Substances
Associated data
Grants and funding
LinkOut - more resources
Full Text Sources
Medical
