

Cryptochromes Suppress HIF1α in Muscles
- PMID: 32683313
- PMCID: PMC7371909
- DOI: 10.1016/j.isci.2020.101338
Cryptochromes Suppress HIF1α in Muscles
Abstract
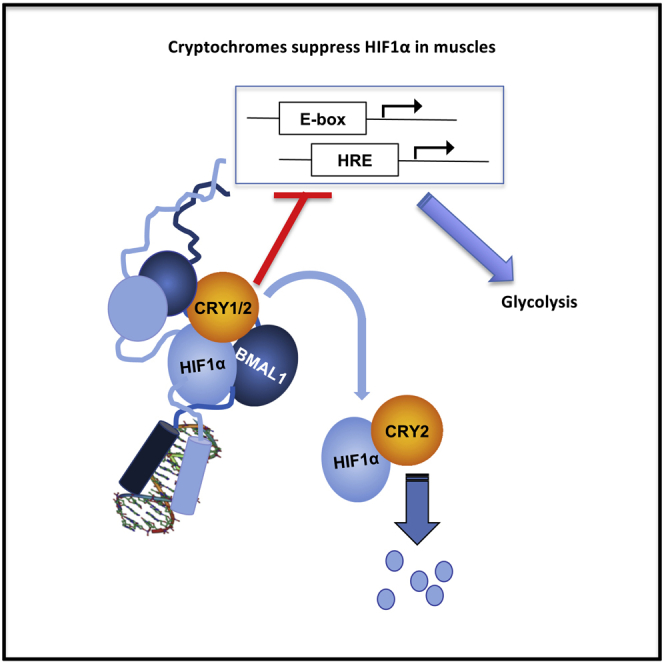
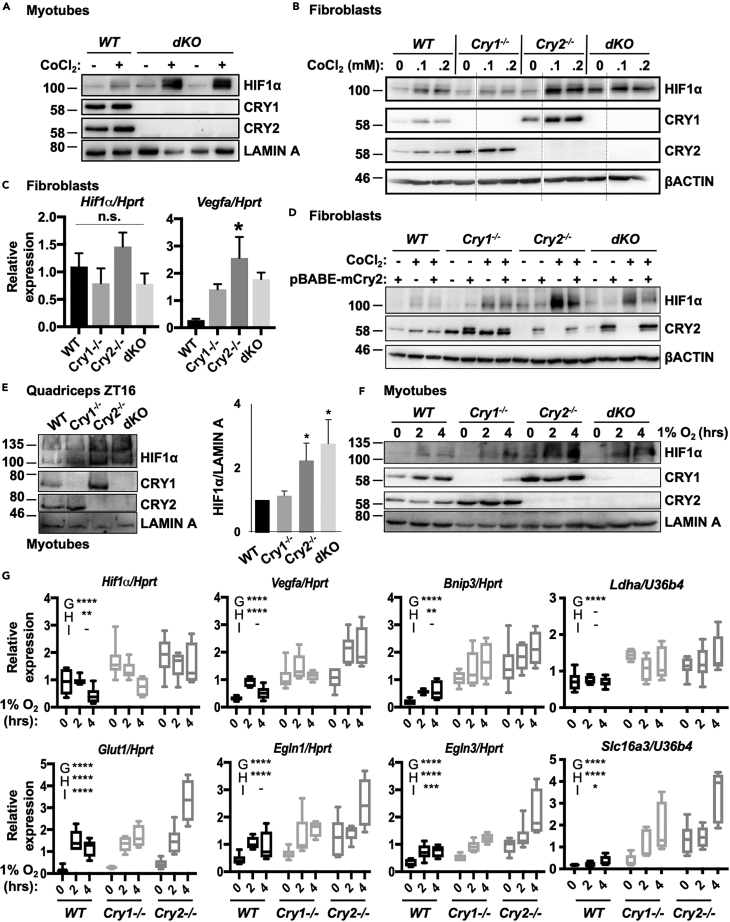
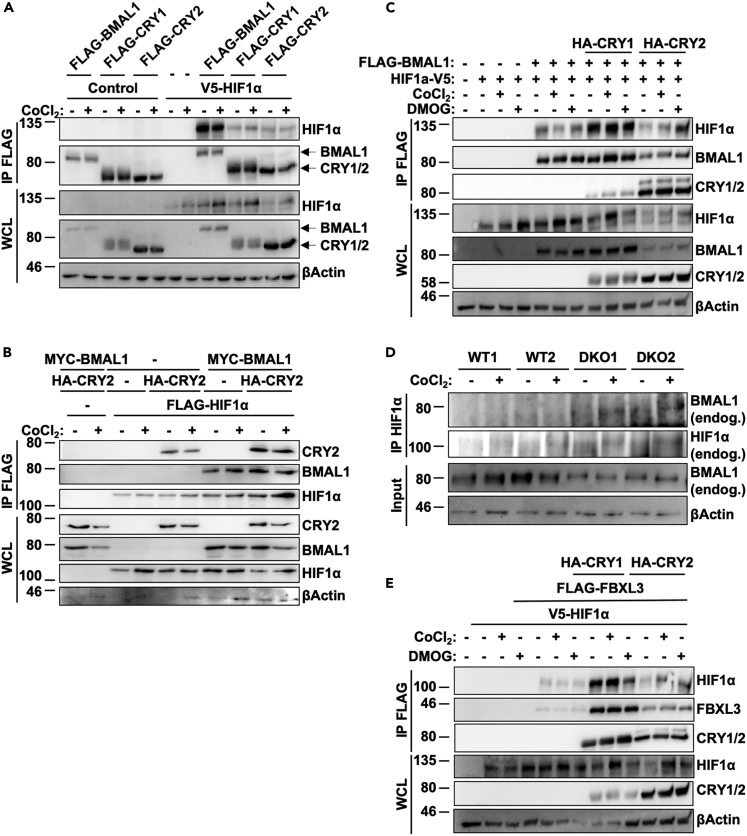
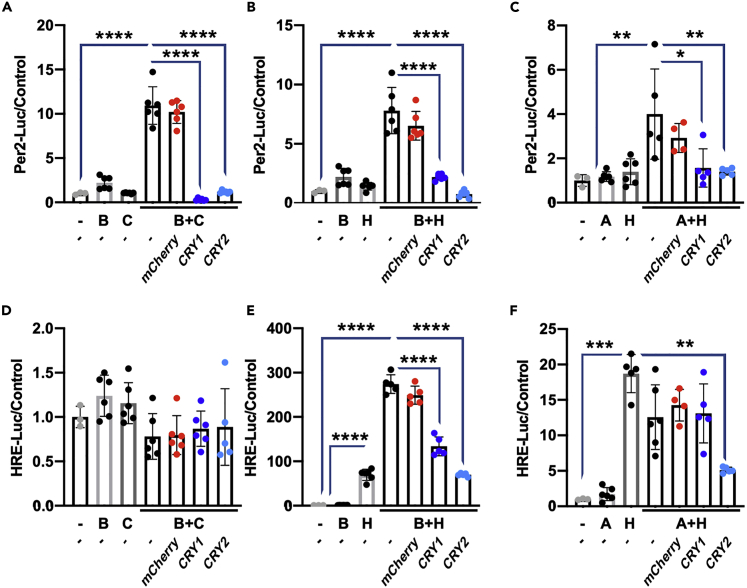
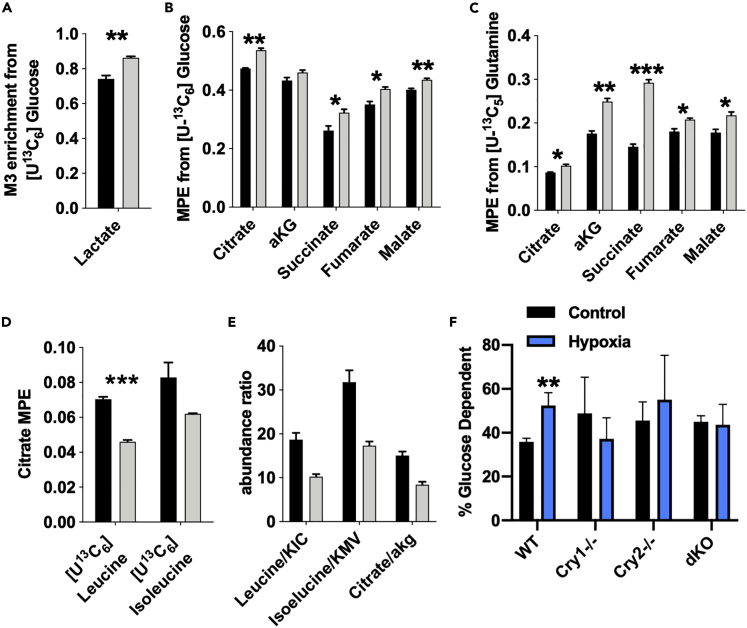
Muscles preferentially utilize glycolytic or oxidative metabolism depending on the intensity of physical activity. Transcripts required for carbohydrate and lipid metabolism undergo circadian oscillations of expression in muscles, and both exercise capacity and the metabolic response to exercise are influenced by time of day. The circadian repressors CRY1 and CRY2 repress peroxisome proliferator-activated receptor delta (PPARδ), a major driver of oxidative metabolism and exercise endurance. CRY-deficient mice exhibit enhanced PPARδ activation and greater maximum speed when running on a treadmill but no increase in exercise endurance. Here we demonstrate that CRYs limit hypoxia-responsive transcription via repression of HIF1α-BMAL1 heterodimers. Furthermore, CRY2 appeared to be more effective than CRY1 in the reduction of HIF1α protein steady-state levels in primary myotubes and quadriceps in vivo. Finally, CRY-deficient myotubes exhibit metabolic alterations consistent with cryptochrome-dependent suppression of HIF1α, which likely contributes to circadian modulation of muscle metabolism.
Keywords: Cell Biology; Chronobiology.
Copyright © 2020 The Authors. Published by Elsevier Inc. All rights reserved.
Conflict of interest statement
Declaration of Interests Authors declare no conflict of interest.
Figures

Similar articles
-
CRY1/2 Selectively Repress PPARδ and Limit Exercise Capacity.Cell Metab. 2017 Jul 5;26(1):243-255.e6. doi: 10.1016/j.cmet.2017.06.002. Cell Metab. 2017. PMID: 28683290 Free PMC article.
-
Circadian Clock Interaction with HIF1α Mediates Oxygenic Metabolism and Anaerobic Glycolysis in Skeletal Muscle.Cell Metab. 2017 Jan 10;25(1):86-92. doi: 10.1016/j.cmet.2016.09.010. Epub 2016 Oct 20. Cell Metab. 2017. PMID: 27773696 Free PMC article.
-
Post-translational regulation of circadian transcriptional CLOCK(NPAS2)/BMAL1 complex by CRYPTOCHROMES.Cell Cycle. 2006 Apr;5(8):890-5. doi: 10.4161/cc.5.8.2684. Epub 2006 Apr 17. Cell Cycle. 2006. PMID: 16628007
-
Loss of circadian rhythm and light-induced suppression of pineal melatonin levels in Cry1 and Cry2 double-deficient mice.Genes Cells. 2010 Oct;15(10):1063-71. doi: 10.1111/j.1365-2443.2010.01443.x. Epub 2010 Sep 5. Genes Cells. 2010. PMID: 20825493
-
Melatonin feedback on clock genes: a theory involving the proteasome.J Pineal Res. 2015 Jan;58(1):1-11. doi: 10.1111/jpi.12189. Epub 2014 Nov 22. J Pineal Res. 2015. PMID: 25369242 Review.
Cited by
-
Daily running enhances molecular and physiological circadian rhythms in skeletal muscle.Mol Metab. 2022 Jul;61:101504. doi: 10.1016/j.molmet.2022.101504. Epub 2022 Apr 22. Mol Metab. 2022. PMID: 35470095 Free PMC article.
-
CRY2 missense mutations suppress P53 and enhance cell growth.Proc Natl Acad Sci U S A. 2021 Jul 6;118(27):e2101416118. doi: 10.1073/pnas.2101416118. Proc Natl Acad Sci U S A. 2021. PMID: 34183418 Free PMC article.
-
Circadian Biology in Obstructive Sleep Apnea.Diagnostics (Basel). 2021 Jun 13;11(6):1082. doi: 10.3390/diagnostics11061082. Diagnostics (Basel). 2021. PMID: 34199193 Free PMC article. Review.
-
BMAL1-HIF2α heterodimers contribute to ccRCC.Res Sq [Preprint]. 2024 Jul 16:rs.3.rs-4651047. doi: 10.21203/rs.3.rs-4651047/v1. Res Sq. 2024. Update in: Nat Commun. 2025 Jul 1;16(1):5834. doi: 10.1038/s41467-025-60904-0. PMID: 39070610 Free PMC article. Updated. Preprint.
-
BMAL1-HIF2α heterodimers contribute to ccRCC.bioRxiv [Preprint]. 2024 Jun 9:2024.06.07.597806. doi: 10.1101/2024.06.07.597806. bioRxiv. 2024. PMID: 38895384 Free PMC article. Preprint.
References
-
- Adamovich Y., Ladeuix B., Golik M., Koeners M.P., Asher G. Rhythmic oxygen levels reset circadian clocks through HIF1alpha. Cell Metab. 2017;25:93–101. - PubMed
-
- Asai Y., Yamada T., Tsukita S., Takahashi K., Maekawa M., Honma M., Ikeda M., Murakami K., Munakata Y., Shirai Y. Activation of the hypoxia inducible factor 1alpha subunit pathway in steatotic liver contributes to formation of cholesterol gallstones. Gastroenterology. 2017;152:1521–1535.e8. - PubMed
-
- Bardos J.I., Ashcroft M. Negative and positive regulation of HIF-1: a complex network. Biochim. Biophys. Acta. 2005;1755:107–120. - PubMed
-
- Bersten D.C., Sullivan A.E., Peet D.J., Whitelaw M.L. bHLH-PAS proteins in cancer. Nat. Rev. Cancer. 2013;13:827–841. - PubMed
Grants and funding
LinkOut - more resources
Full Text Sources
Molecular Biology Databases
