

From community-acquired pneumonia to COVID-19: a deep learning-based method for quantitative analysis of COVID-19 on thick-section CT scans
- PMID: 32683550
- PMCID: PMC7368602
- DOI: 10.1007/s00330-020-07042-x
From community-acquired pneumonia to COVID-19: a deep learning-based method for quantitative analysis of COVID-19 on thick-section CT scans
Abstract
Objective: To develop a fully automated AI system to quantitatively assess the disease severity and disease progression of COVID-19 using thick-section chest CT images.
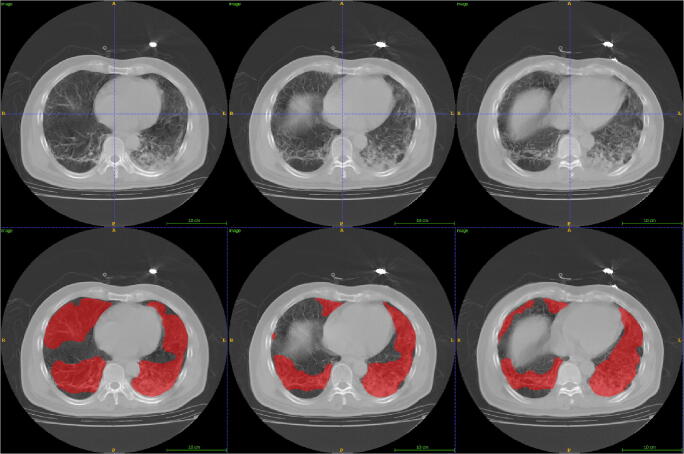
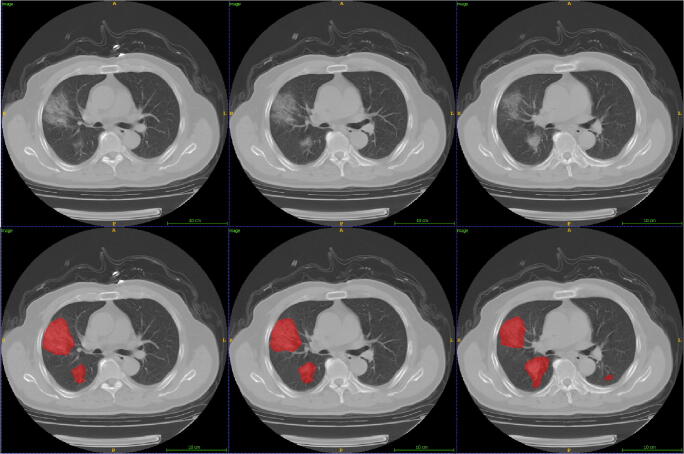
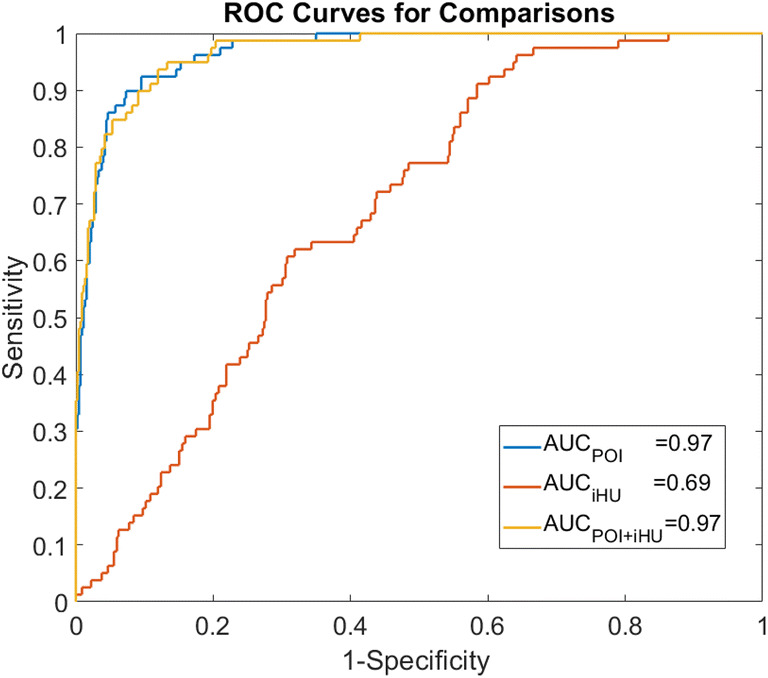
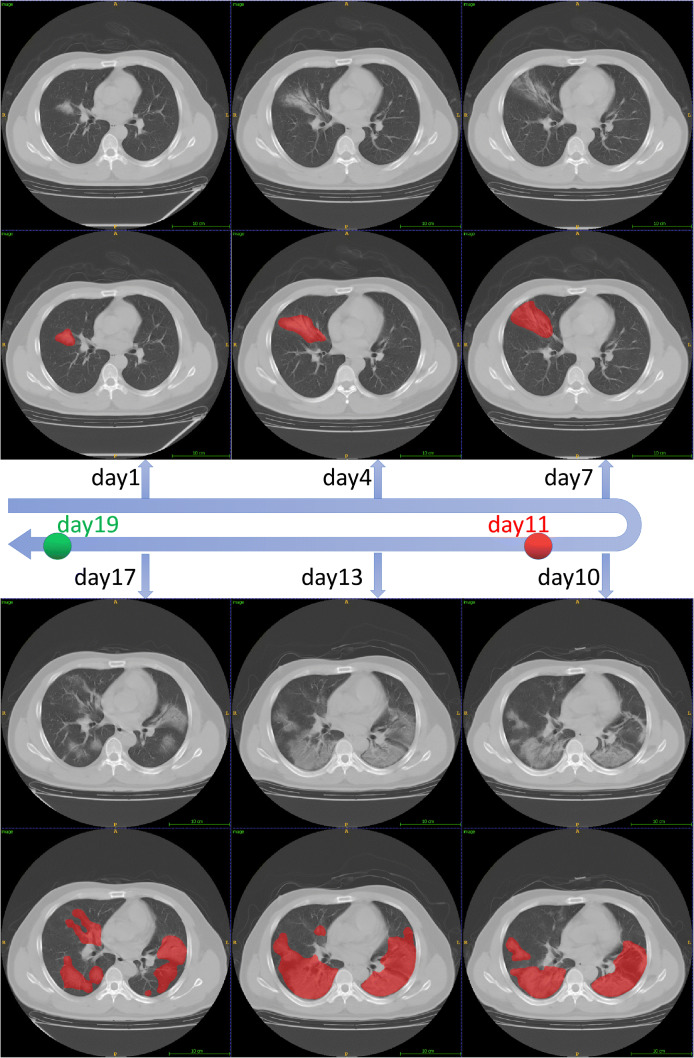
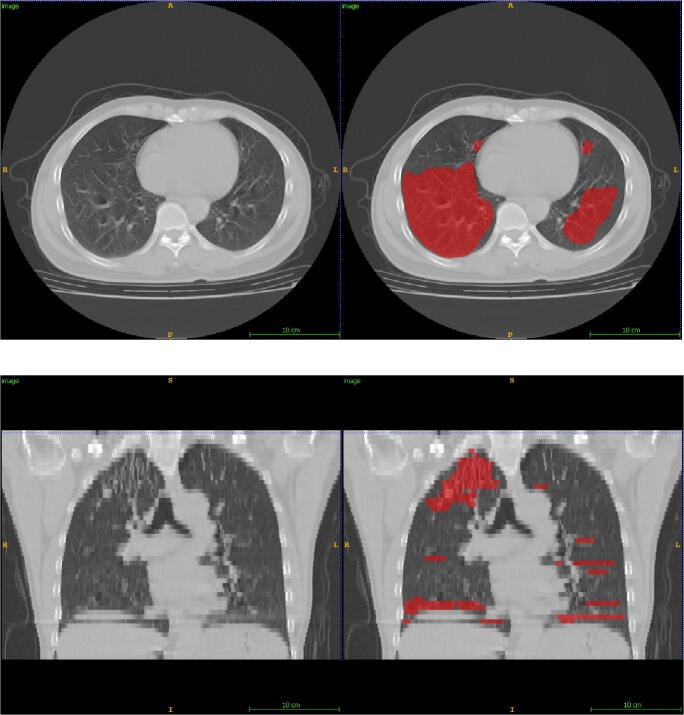
Methods: In this retrospective study, an AI system was developed to automatically segment and quantify the COVID-19-infected lung regions on thick-section chest CT images. Five hundred thirty-one CT scans from 204 COVID-19 patients were collected from one appointed COVID-19 hospital. The automatically segmented lung abnormalities were compared with manual segmentation of two experienced radiologists using the Dice coefficient on a randomly selected subset (30 CT scans). Two imaging biomarkers were automatically computed, i.e., the portion of infection (POI) and the average infection HU (iHU), to assess disease severity and disease progression. The assessments were compared with patient status of diagnosis reports and key phrases extracted from radiology reports using the area under the receiver operating characteristic curve (AUC) and Cohen's kappa, respectively.
Results: The dice coefficient between the segmentation of the AI system and two experienced radiologists for the COVID-19-infected lung abnormalities was 0.74 ± 0.28 and 0.76 ± 0.29, respectively, which were close to the inter-observer agreement (0.79 ± 0.25). The computed two imaging biomarkers can distinguish between the severe and non-severe stages with an AUC of 0.97 (p value < 0.001). Very good agreement (κ = 0.8220) between the AI system and the radiologists was achieved on evaluating the changes in infection volumes.
Conclusions: A deep learning-based AI system built on the thick-section CT imaging can accurately quantify the COVID-19-associated lung abnormalities and assess the disease severity and its progressions.
Key points: • A deep learning-based AI system was able to accurately segment the infected lung regions by COVID-19 using the thick-section CT scans (Dice coefficient ≥ 0.74). • The computed imaging biomarkers were able to distinguish between the non-severe and severe COVID-19 stages (area under the receiver operating characteristic curve 0.97). • The infection volume changes computed by the AI system were able to assess the COVID-19 progression (Cohen's kappa 0.8220).
Keywords: Artificial intelligence; COVID-19; Deep learning; Disease progression.
Conflict of interest statement
The authors of this manuscript declare no relationships with any companies, whose products or services may be related to the subject matter of the article.
Figures

Similar articles
-
Using Artificial Intelligence to Detect COVID-19 and Community-acquired Pneumonia Based on Pulmonary CT: Evaluation of the Diagnostic Accuracy.Radiology. 2020 Aug;296(2):E65-E71. doi: 10.1148/radiol.2020200905. Epub 2020 Mar 19. Radiology. 2020. PMID: 32191588 Free PMC article.
-
A deep learning approach to characterize 2019 coronavirus disease (COVID-19) pneumonia in chest CT images.Eur Radiol. 2020 Dec;30(12):6517-6527. doi: 10.1007/s00330-020-07044-9. Epub 2020 Jul 2. Eur Radiol. 2020. PMID: 32617690 Free PMC article.
-
Artificial Intelligence Augmentation of Radiologist Performance in Distinguishing COVID-19 from Pneumonia of Other Origin at Chest CT.Radiology. 2020 Sep;296(3):E156-E165. doi: 10.1148/radiol.2020201491. Epub 2020 Apr 27. Radiology. 2020. PMID: 32339081 Free PMC article.
-
A review on the use of artificial intelligence for medical imaging of the lungs of patients with coronavirus disease 2019.Diagn Interv Radiol. 2020 Sep;26(5):443-448. doi: 10.5152/dir.2019.20294. Diagn Interv Radiol. 2020. PMID: 32436845 Free PMC article. Review.
-
Review on Diagnosis of COVID-19 from Chest CT Images Using Artificial Intelligence.Comput Math Methods Med. 2020 Sep 26;2020:9756518. doi: 10.1155/2020/9756518. eCollection 2020. Comput Math Methods Med. 2020. PMID: 33014121 Free PMC article. Review.
Cited by
-
Robust prediction of mortality of COVID-19 patients based on quantitative, operator-independent, lung CT densitometry.Phys Med. 2021 May;85:63-71. doi: 10.1016/j.ejmp.2021.04.022. Epub 2021 Apr 30. Phys Med. 2021. PMID: 33971530 Free PMC article.
-
COVID-19 disease diagnosis from paper-based ECG trace image data using a novel convolutional neural network model.Phys Eng Sci Med. 2022 Mar;45(1):167-179. doi: 10.1007/s13246-022-01102-w. Epub 2022 Jan 12. Phys Eng Sci Med. 2022. PMID: 35020175 Free PMC article.
-
From Voxels to Prognosis: AI-Driven Quantitative Chest CT Analysis Forecasts ICU Requirements in 78 COVID-19 Cases.Res Sq [Preprint]. 2023 Jul 5:rs.3.rs-3027617. doi: 10.21203/rs.3.rs-3027617/v5. Res Sq. 2023. Update in: J Thorac Dis. 2024 Feb 29;16(2):1009-1020. doi: 10.21037/jtd-23-1150. PMID: 37333197 Free PMC article. Updated. Preprint.
-
AI detection of mild COVID-19 pneumonia from chest CT scans.Eur Radiol. 2021 Sep;31(9):7192-7201. doi: 10.1007/s00330-021-07797-x. Epub 2021 Mar 18. Eur Radiol. 2021. PMID: 33738595 Free PMC article.
-
Early survey with bibliometric analysis on machine learning approaches in controlling COVID-19 outbreaks.PeerJ Comput Sci. 2020 Nov 23;6:e313. doi: 10.7717/peerj-cs.313. eCollection 2020. PeerJ Comput Sci. 2020. PMID: 33816964 Free PMC article.
References
-
- Coronavirus disease 2019 (covid-19) situation report-80. World Health Organization Web site. https://www.who.int/docs/default-source/coronaviruse/situation-reports/2.... Published April 9, 2020. Accessed 9 Apr 2020
-
- Li L, Qin L, Xu Z et al (2020) Artificial intelligence distinguishes covid-19 from community acquired pneumonia on chest ct. Radiology. 200905. 10.1148/radiol.2020200905
MeSH terms
Grants and funding
LinkOut - more resources
Full Text Sources
Other Literature Sources
Medical
