. 2020 Jun 12;10(17):7561-7580.
doi: 10.7150/thno.41802. eCollection 2020.

Exosomes-mediated Transfer of miR-125a/b in Cell-to-cell Communication: A Novel Mechanism of Genetic Exchange in the Intestinal Microenvironment

Affiliations

Exosomes-mediated Transfer of miR-125a/b in Cell-to-cell Communication: A Novel Mechanism of Genetic Exchange in the Intestinal Microenvironment

Wei Cheng et al. Theranostics. .

Abstract

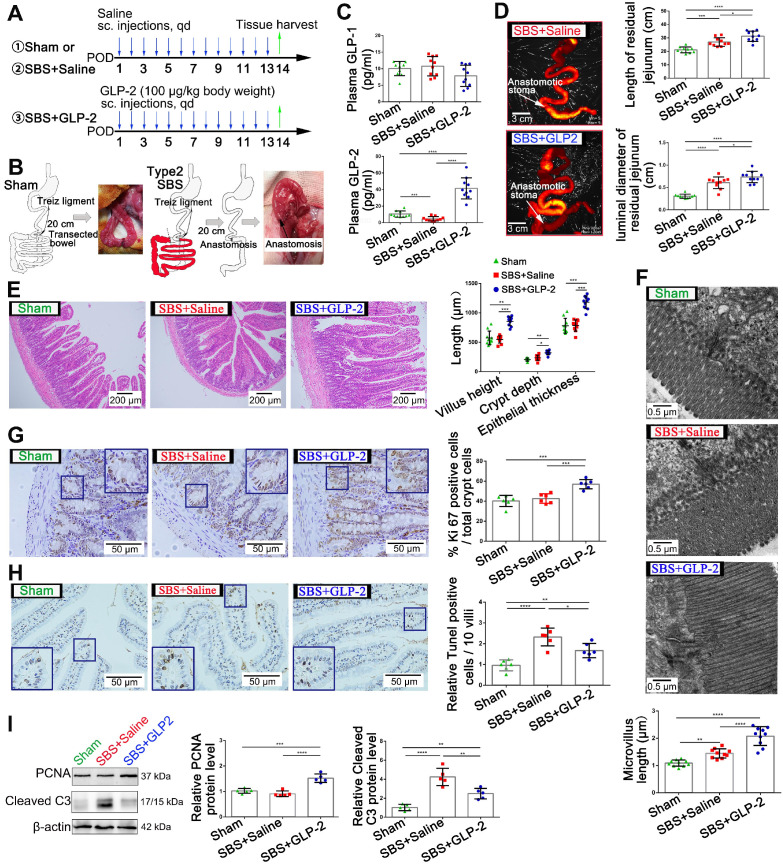
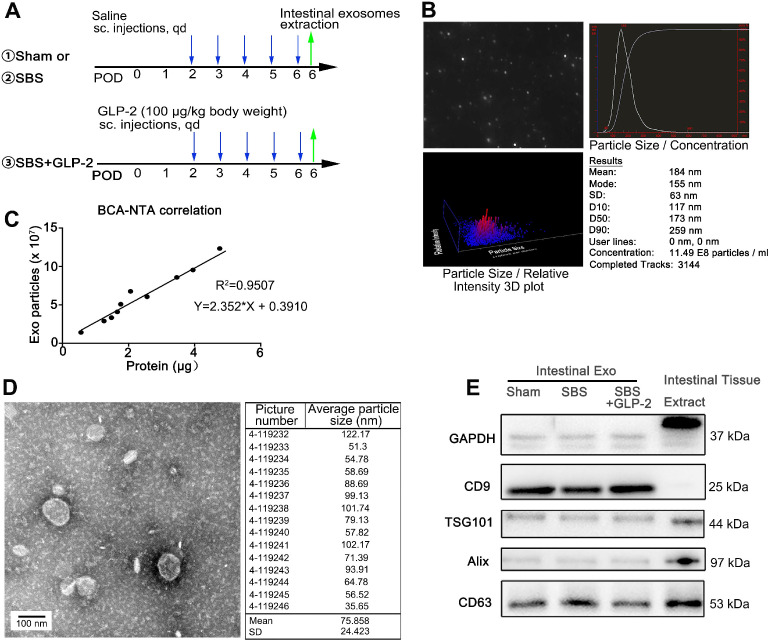
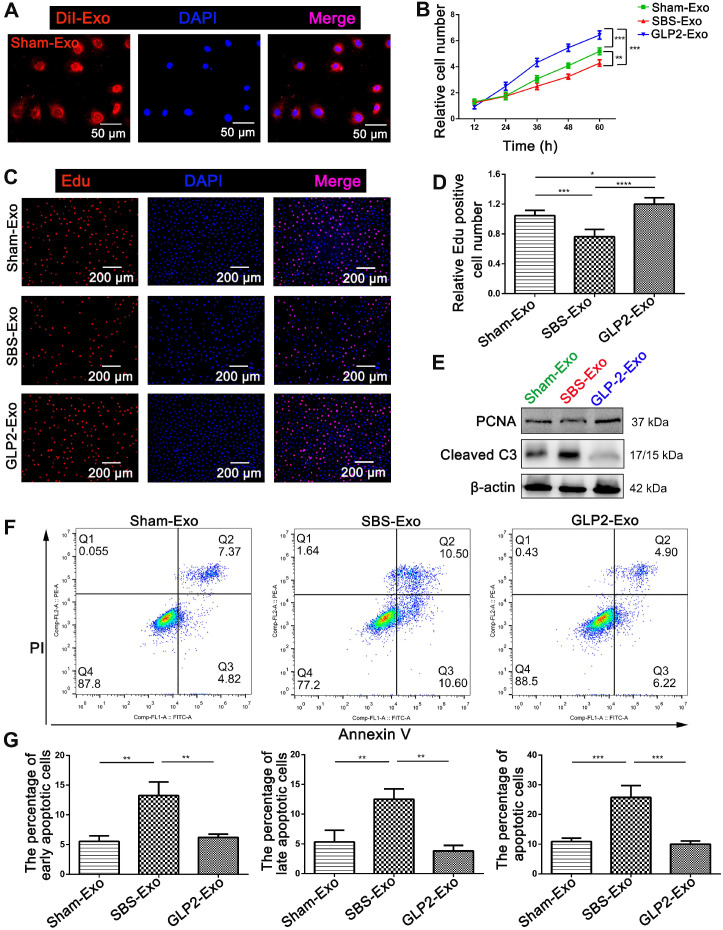
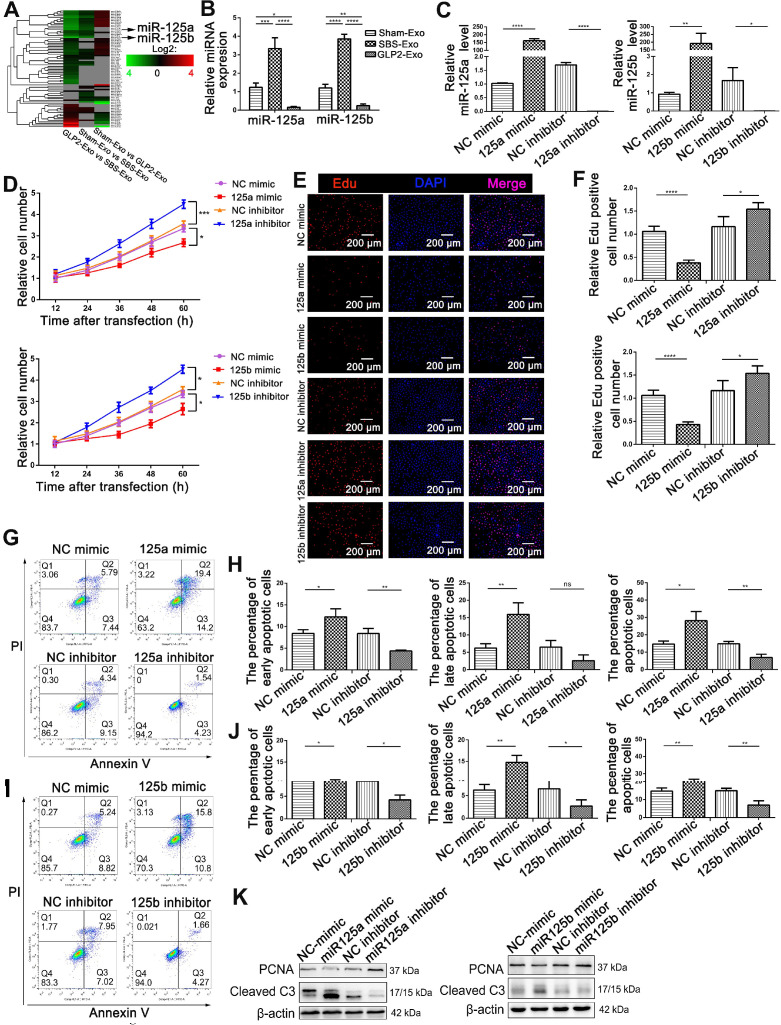
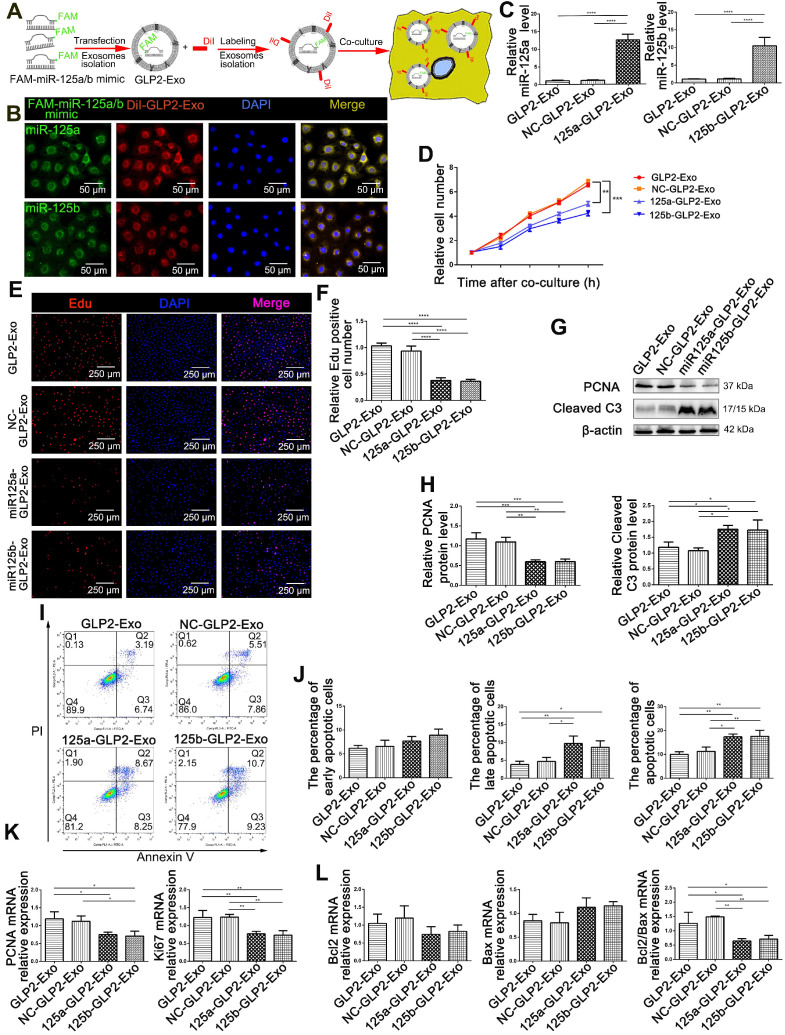
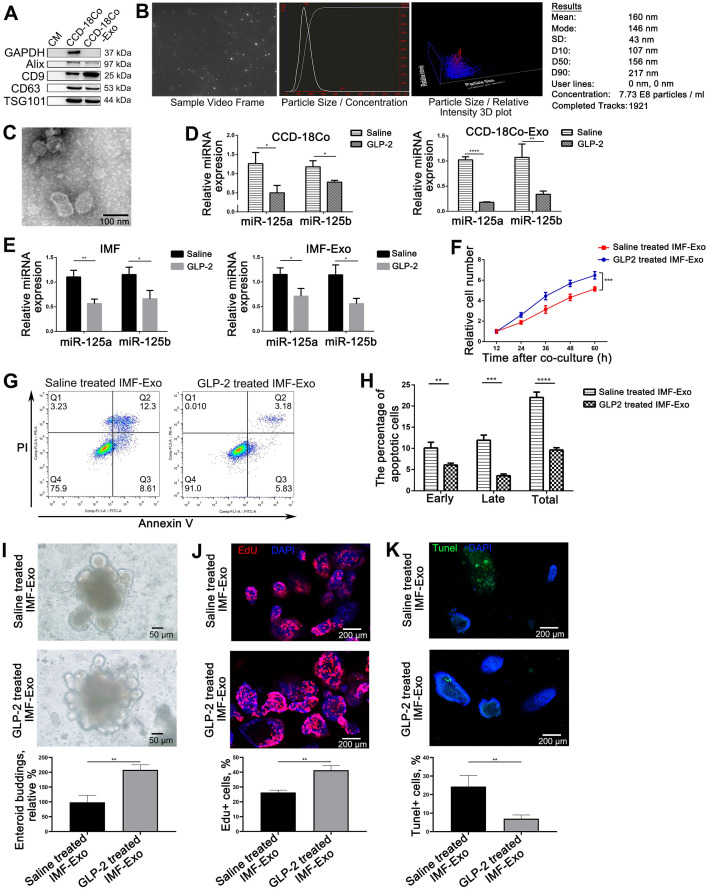
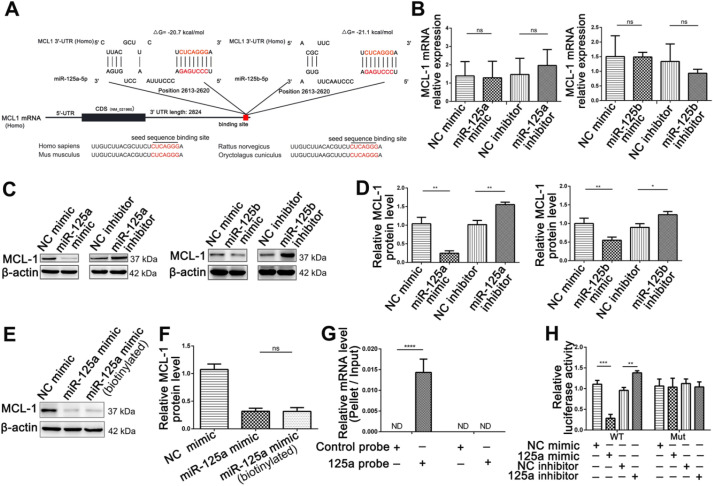
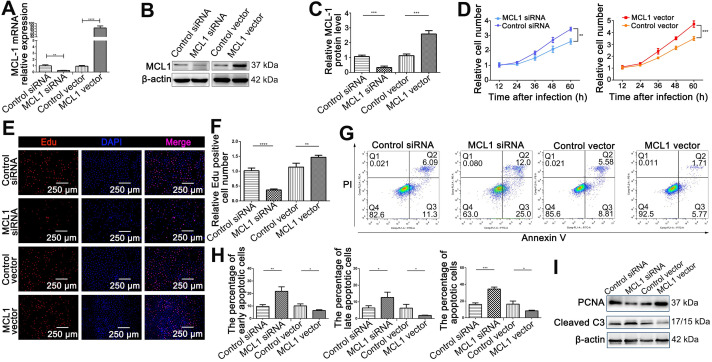
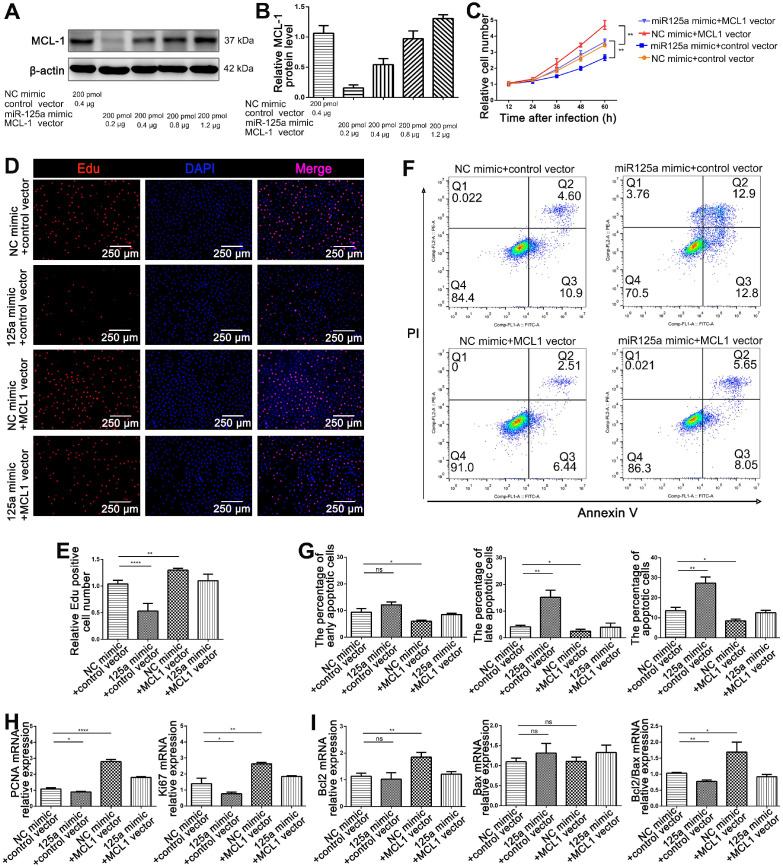
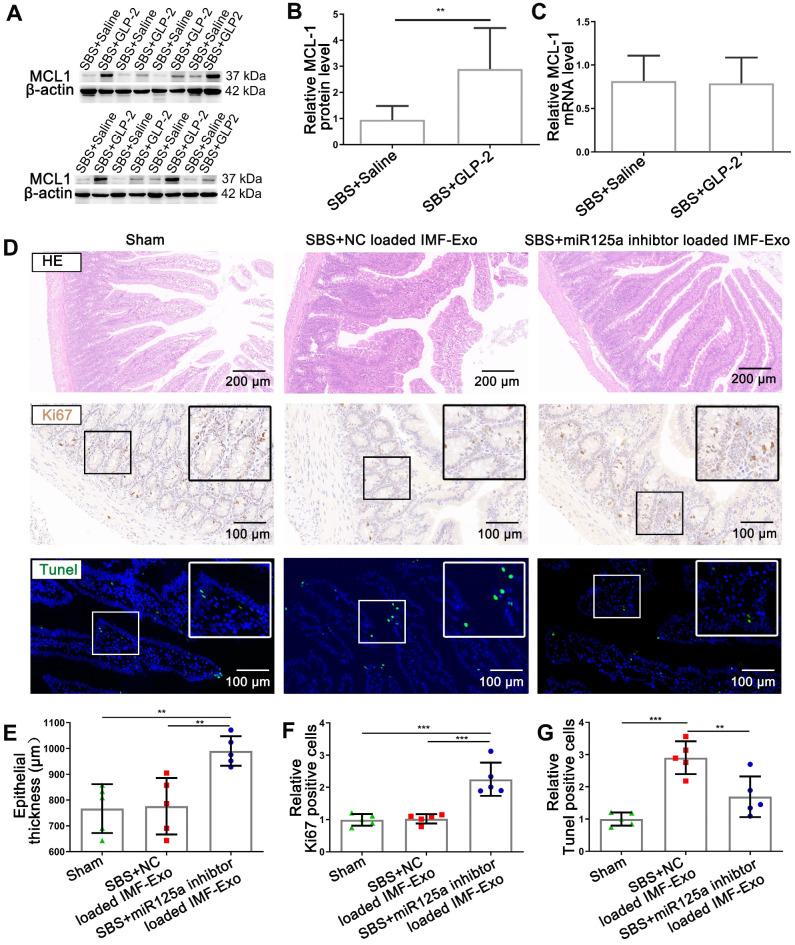
Glucagon-like peptide-2 (GLP-2), a key factor in intestinal rehabilitation therapy of short bowel syndrome (SBS), may require cell-to-cell communication to exert its biological functions. However, understanding of the mechanism remains elusive. Here, we report participation of exosomal miR-125a/b in GLP-2 mediated intestinal epithelial cells-myofibroblasts cross-talk in intestinal microenvironment. Methods: The effects of GLP-2 on the proliferation and apoptosis of intestinal epithelial cells in SBS rat models were evaluated. Exosomes were extracted from residual jejunum tissue of GLP-2 or vehicle treated SBS rats using ultracentrifugation method, and identified by nanoparticle trafficking analysis (NTA), transmission electron microscopy and western blotting. miRNA sequencing combined with qRT-PCR validation were used to identify differentially expressed miRNAs. miRNAs, which might be involved in proliferation and apoptosis of intestinal epithelial cells, were screened and further verified by miRNA functional experiments. Moreover, the proliferation-promoting and anti-apoptosis effects of GLP-2 on intestinal myofibroblasts, which expressing GLP-2 receptor, and whether GLP-2 could influence the content of miRNAs in the derived exosomes were studied. The downstream pathways were explored by miRNA function recovery experiment, luciferase reporter assay, pull down experiment, knockdown and overexpression of target gene and other experiments based on the bioinformatics prediction of miRNA target gene. Results: GLP-2 significantly promoted intestinal growth, facilitated the proliferation of intestinal crypt epithelial cells and inhibited the apoptosis of intestinal villi epithelial cells in type II SBS rats. GLP-2 significantly down-regulated exosomal miR-125a/b both in residual jejunums derived exosomes and in exosomes secreted by GLP-2R positive cells. Exosomal miR-125a/b was responsible for GLP-2 mediated intestinal epithelial cells proliferation promotion and apoptosis attenuation. miR-125a/b inhibited the proliferation and promotes apoptosis of intestinal epithelial cells by suppressing the myeloid cell leukemia-1 (MCL1). Conclusions: miR-125a/b shuttled by intestinal myofibroblasts derived exosomes regulate the proliferation and apoptosis of intestinal epithelial cells. GLP-2 treatment significantly decreases the level of miR-125a/b in the exosomes of intestinal myofibroblasts. miR-125a/b modulates the proliferation and apoptosis of intestinal epithelial cells by targeting the 3'UTR region of MCL1. Hence, this study indicates a novel mechanism of genetic exchange between cells in intestinal microenvironment.

Keywords: Exosomes; Glucagon-like peptide-2; Proliferation and apoptosis of intestinal epithelial cells; Short bowel syndrome; miR-125a/b.


Conflict of interest statement

Competing Interests: The authors have declared that no competing interest exists.

Figures

Figure 1
Figure 1
GLP-2 mediates proliferation and apoptosis of intestinal epithelial cells and promotes intestinal adaptation in SBS rats. (A) Experimental design for the in vivo study. SBS was induced by massive small bowel resection and partial colon resection in male SD rats. Sham-operated rats underwent the same procedure without intestine resection. 100 µg/kg GLP-2 or equal volume of saline was injected subcutaneously once daily for 2 weeks after the surgical procedure. Rats were sacrificed and samples were collected 2 weeks after operation. (B) Construction scheme of type 2 SBS and sham model. (C) Concentration of GLP-1 and GLP-2 in plasma 2 weeks after operation. (D) The length and luminal diameter of residual jejunum 2 weeks following SBS operation. (E) H&E staining of remaining jejunum after 2 weeks GLP-2 or saline treatment. Intestinal villus height, intestinal crypt depth and intestinal epithelial thickness were measured and shown at the right panel. (F) Length of intestinal microvilli in different groups as measured by electron microscopy. (G) Representative images of Ki67 staining and corresponding quantitative analysis of crypt epithelium proliferation in different groups. (H) Representative images of TUNEL staining and corresponding quantitative data of villus epithelium apoptosis in different groups. (I) Western blot assay for PCNA and cleaved caspase-3 expression in remaining jejunum tissues from SBS and sham-operated rats. N=5-10, *P < 0.05, ** P < 0.01, *** P < 0.001, **** P < 0.0001.
Figure 2
Figure 2
Characterization of jejunal tissue-derived exosomes. (A) Schematic illustration of the experimental procedure for intestinal isolation. (B) Nanoparticle trafficking analyzed the diameters and concentration of Sham-Exo. (C) Correlation between particle number measured by NTA in isolated exosomes and protein weight measured by BCA assay. (D) Transmission electron micrograph and particle size distribution of Sham-Exo. (E) Representative blots of exosomal marker proteins CD9, TSG101, Alix and CD63 in Sham-Exo, SBS-Exo and GLP2-Exo.
Figure 3
Figure 3
Intestinal exosomes derived from GLP-2 treated SBS rats exerted proliferative and anti-apoptotic effects on intestinal epithelial cells. (A) The DiI (red)‐labeled intestinal exosomes (Sham-Exo) were internalized into HIEC6. (B) CCK-8 assays were performed 12, 24, 36, 48 and 60 h after adding intestinal exosomes into HIEC6. (C) Representative images of EdU staining in HIEC6 after culturing with Sham-Exo, SBS-Exo or GLP2-Exo for 48 h. (D) Quantitative assessment of percentage of EdU positive cells in (C). (E) Representative blots of PCNA and Cleaved Caspase3 protein levels in HIEC6 after culturing with Sham-Exo, SBS-Exo or GLP2-Exo for 48 h. (F) Representative flow cytometry plots showing the percentages of early apoptotic cells (Annexin V+/PI-) , late apoptotic cells (Annexin V+/PI+) and total (early + late) apoptotic cells in HIEC6 after culturing with intestinal exosomes. (G) Pooled flow cytometry data from (F). N=3, *p < 0.05, **p < 0.01, ***p < 0.001, and ****p < 0.0001.
Figure 4
Figure 4
miR-125a/b were critical in intestinal exosomes mediated proliferation and apoptosis of HIEC6. (A) miRNA profiling assays were performed in Sham-Exo, SBS-Exo and GLP2-Exo (five exosomes-RNA samples were mixed into one sample for sequencing). Heatmap was generated after supervised hierarchical cluster analysis. (B) qPCR analysis of miR-125a/b levels in Sham-Exo, SBS-Exo and GLP2-Exo (N=5). (C) qPCR analysis of miR-125a/b levels in HIEC6 cells transfected with NC mimic, miR-125a/b mimic, NC inhibitor or miR-125a/b inhibitor (N=3). (D) Cell proliferation assays (CCK-8) were performed 12, 24, 36, 48 and 60 h after the transfection of HIEC6 with equal doses of NC mimic, miR-125a/b mimic, NC inhibitor or miR-125a/b inhibitor (N=3). (E) Representative images of EdU staining in HIEC6 transfected with equal doses of NC mimic, miR-125a/b mimic, NC inhibitor or miR-125a/b inhibitor. (F) Pooled data of percentage of EdU positive cells in (E) (N=3). (G-J) Representative flow cytometry plots and relative quantification of the proportion of early apoptotic cells (Annexin V+/PI-), late apoptotic cells (Annexin V+/PI+) and total (early + late) apoptotic cells in HIEC6 after miR-125a/b mimic or inhibitor transfection (N=3). (K) Representative blots of PCNA and Cleaved Caspase3 protein levels in HIEC6 transfected with equal doses of NC mimic, miR-125a/b mimic, NC inhibitor or miR-125a/b inhibitor (N=3). *p < 0.05, **p < 0.01, ***p < 0.001, and ****p < 0.0001.
Figure 5
Figure 5
Encapsulating miR-125a/b mimic into GLP2-Exo blunted its proliferative and anti- apoptosis effects. (A) Flowchart illustrating the method to introduce miR-125a/b mimic into GLP2-Exo and then internalized by HIEC6. (B) FAM-miR-125a/b mimic-loaded GLP2-Exo labeled with DiI were internalized by HIEC6. (C) qPCR analysis of miR-125a/b levels in miR-125a/b mimic-loaded GLP2-Exo, NC mimic-loaded GLP2-Exo and GLP2-Exo. (D) CCK-8 were performed 12, 24, 36, 48 and 60 h after co-culture of HIEC6 with equal doses of miR-125a/b mimic-loaded GLP2-Exo, NC mimic-loaded GLP2-Exo and GLP2-Exo. (E) Representative images of EdU staining in HIEC6 after culturing with miR-125a/b mimic-loaded GLP2-Exo, NC mimic-loaded GLP2-Exo and GLP2-Exo for 48 h. (F) Quantitative assessment of percentage of EdU positive cells in (E). (G) Representative blots of PCNA and Cleaved Caspase3 protein levels in HIEC6 after culturing with miR-125a/b mimic-loaded GLP2-Exo, NC mimic-loaded GLP2-Exo and GLP2-Exo for 48 h. (H) Quantitative analysis of Western blots for PCNA and Cleaved Caspase3 protein levels in (G). (I-J) Representative flow cytometry plots and relative quantification of the ratio of early apoptotic cells (Annexin V+/PI-) , late apoptotic cells (Annexin V+/PI+) and total (early late) apoptotic cells in HIEC6 after culturing with miR-125a/b mimic-loaded GLP2-Exo, NC mimic-loaded GLP2-Exo and GLP2-Exo for 48 h. (K) Gene expression profiles of proliferation marker PCNA and Ki67 in HIEC6 after culturing with miR-125a/b mimic-loaded GLP2-Exo, NC mimic-loaded GLP2-Exo and GLP2-Exo for 48 h. (L) Gene expression profiles of anti-apoptotic Bcl-2 and pro-apoptotic Bax in HIEC6 after culturing with miR-125a/b mimic-loaded GLP2-Exo, NC mimic-loaded GLP2-Exo and GLP2-Exo for 48 h. N=3, *p < 0.05, **p < 0.01, ***p < 0.001, and ****p < 0.0001.
Figure 6
Figure 6
GLP-2 exerted its proliferative and anti-apoptotic effect on intestinal epithelial through reducing miR-125a/b contents in exosomes derived from GLP-2R positive cells. (A-C) Identification of CCD-18Co cells derived exosomes by WB (A), NTA (B) and Transmission electron microscopy (C). (D) Quantitative analysis of miR-125a/b levels in saline and GLP-2 treated CCD-18Co cells and their exosomes (CCD-18Co-Exo). (E) Quantitative analysis of miR-125a/b levels in saline and GLP-2 treated primary intestinal myofibroblasts and their exosomes (IMF-Exo). (F) CCK-8 were performed 12, 24, 36, 48 and 60 h after culturing saline or GLP-2 treated IMF-Exo with HIEC6. (G) Representative flow cytometry plots showing the percentages of early apoptotic cells (Annexin V+/PI-), late apoptotic cells (Annexin V+/PI+) and total (early+late) apoptotic cells in HIEC6 culturing with saline or GLP-2 treated IMF-Exo. (H) Quantification of flow cytometry data in (G). (I) Representative images and relative budding rate of mice intestinal organoids after culturing with saline or GLP-2 treated IMF-Exo. (J) Representative images of EdU staining and relative quantification of mice intestinal organoids under saline or GLP-2 treated IMF-Exo intervention. (K) Representative images of TUNEL staining and apoptotic rate of mice intestinal organoids after culturing with saline or GLP-2 treated IMF-Exo. N=3, *p < 0.05, **p < 0.01, ***p < 0.001, and ****p < 0.0001.
Figure 7
Figure 7
Identification of MCL1 as a miR-125a/b target. (A) Schematic description of the hypothetical duplex formed by the interactions between the binding site in the MCL1 3'-UTR and miR-125a/b. The miR-125a/b seed sequence and the seed sequence binding sites in the MCL1 3'-UTR are indicated in red. All nucleotides of the seed sequence of the binding site are conserved in several species, including human, mouse, rat and rabbit. The calculated free energy values of the hybrids are indicated. (B) qPCR analysis of MCL1 mRNA levels in HIEC6 cells transfected with miR-125a/b mimic, inhibitor, and scramble negative control. (C-D) Representative blots and relative quantification of MCL1 protein levels in HIEC6 cells transfected with miR-125a/b mimic, inhibitor, and scramble negative control. (E-F) Representative blots and relative quantification of MCL1 protein levels in HIEC6 cells transfected with NC mimic, miR-125a mimic or biotinylated miR-125a mimic. (G) qPCR analysis of MCL1 and GAPDH mRNA levels in HIEC6 after pulling down with control probe or miR-125a probe. (H) The relative luciferase activities in HIEC6 transfected with wild type or mutant MCL1 3'-UTR. N=3, *p < 0.05, **p < 0.01, ***p < 0.001, and ****p < 0.0001.
Figure 8
Figure 8
MCL1 promoted proliferation and inhibited apoptosis of HIEC6 cells. (A) qPCR analysis of MCL1 mRNA levels in HIEC6 cells transfected with MCL1 plasmid, Control plasmid, MCL1 siRNA, or scrambled Control siRNA. (B-C) Representative blots and relative quantification of MCL1 protein in HIEC6 cells transfected with MCL1 plasmid, Control plasmid, MCL1 siRNA, or scrambled Control siRNA. (D) CCK-8 were performed 12, 24, 36, 48 and 60 h after the transfection of HIEC6 with MCL1 siRNA, Control siRNA, MCL1 plasmid, or Control plasmid. (E) Representative images of EdU staining in HIEC6 transfected with MCL1 plasmid, Control plasmid, MCL1 siRNA, or scrambled Control siRNA. (C) Quantitative assessment of percentage of EdU positive cells in (F). (G) Representative flow cytometry plots showing the percentages of early apoptotic cells (Annexin V+/PI-), late apoptotic cells (Annexin V+/PI+) and total (early+late) apoptotic cells in HIEC6 transfected with MCL1 plasmid, Control plasmid, MCL1 siRNA, or scrambled Control siRNA. (H) Pooled flow cytometry data from (G). (I) Representative blots of PCNA and Cleaved C3 protein levels in HIEC6 transfected with MCL1 siRNA, Control siRNA, MCL1 plasmid, or Control plasmid. N=3, *p < 0.05, **p < 0.01, ***p < 0.001, and ****p < 0.0001.
Figure 9
Figure 9
miR-125a inhibited HIEC6 cell proliferation and promoted apoptosis by targeting MCL1. (A-B) Pilot study to determine the dosage of MCL1 vector to rescue miR-125a mimic induced MCL1 suppression. (C) CCK-8 were performed 12, 24, 36, 48 and 60 h after the co-transfection of HIEC6 with NC mimic+control vector, miR-125a mimic+control vector, NC mimic +MCL1 vector, miR-125a mimic+MCL1 vector. (D) Representative images of EdU staining in HIEC6 cells transfected with NC mimic+control vector, miR-125a mimic+control vector, NC mimic +MCL1 vector, miR-125a mimic+MCL1 vector. (E) Quantitative analysis of percentage of EdU positive cells in (D). (F-G) Representative flow cytometry plots and relative quantification of the ratio of early apoptotic cells (Annexin V+/PI-), late apoptotic cells (Annexin V+/PI+) and total (early late) apoptotic cells in HIEC6 transfected with NC mimic+control vector, miR-125a mimic+control vector, NC mimic +MCL1 vector, miR-125a mimic+MCL1 vector. (H) Gene expression profiles of proliferation marker PCNA and Ki67 mRNA levels in HIEC6 transfected with NC mimic+control vector, miR-125a mimic+control vector, NC mimic +MCL1 vector, miR-125a mimic+MCL1 vector. (I) Gene expression profiles of anti-apoptotic Bcl-2 and pro-apoptotic Bax mRNA levels in HIEC6 cells transfected with NC mimic+control vector, miR-125a mimic+control vector, NC mimic +MCL1 vector, miR-125a mimic+MCL1 vector. N=3, *p < 0.05, **p < 0.01, ***p < 0.001, and ****p < 0.0001.
Figure 10
Figure 10
GLP-2 exerted its intestinotrophic effect by decreasing exosomal miR-125a/b and thus upregulating MCL1 expression in vivo. (A-B) Representative blots and relative quantification of MCL1 protein level in jejunum mucosa of SBS rats treated with GLP-2 or Saline. (C) qPCR analysis of MCL1 mRNA levels in jejunum mucosa of SBS rats treated with GLP-2 or Saline. (D) Representative images of H&E staining, Ki67 staining and TUNEL staining of remaining jejunum in Sham, SBS+NC loaded IMF-Exo and SBS+miR-125a loaded IMF-Exo rats. (E) Quantification of intestinal epithelial thickness in (D). (F) Quantitative analysis of percentage of Ki67 positive cells in (D). (G) Quantitative analysis of percentage of TUNEL positive cells in (D). N=5-8, **p < 0.01, ***p < 0.001.

Similar articles

Cited by

References

    1. Mouillot T, Boehm V, Treton X, Ferrandi E, Kapel N, Cazals-Hatem D. et al. Small-Bowel Adaptation: A Case of Morphological Changes Induced by Teduglutide in Short-Bowel Syndrome With Intestinal Failure. JPEN J Parenter Enteral Nutr. 2020 [Epub ahead of print] - PubMed
    1. Pironi L, Arends J, Bozzetti F, Cuerda C, Gillanders L, Jeppesen PB. et al. ESPEN guidelines on chronic intestinal failure in adults. Clin Nutr. 2016;35:247–307. - PubMed
    1. Billiauws L, Joly F. Emerging treatments for short bowel syndrome in adult patients. Expert Rev Gastroenterol Hepatol. 2019;13:241–6. - PubMed
    1. Norsa L, Artru S, Lambe C, Talbotec C, Pigneur B, Ruemmele F. et al. Long term outcomes of intestinal rehabilitation in children with neonatal very short bowel syndrome: Parenteral nutrition or intestinal transplantation. Clin Nutr. 2019;38:926–33. - PubMed
    1. Brubaker PL, Izzo A, Hill M, Drucker DJ. Intestinal function in mice with small bowel growth induced by glucagon-like peptide-2. Am J Physiol. 1997;272:E1050–8. - PubMed

Publication types

MeSH terms