. 2020 Jul 3:8:e9411.
doi: 10.7717/peerj.9411. eCollection 2020.

A little frog leaps a long way: compounded colonizations of the Indian Subcontinent discovered in the tiny Oriental frog genus Microhyla (Amphibia: Microhylidae)

Affiliations

A little frog leaps a long way: compounded colonizations of the Indian Subcontinent discovered in the tiny Oriental frog genus Microhyla (Amphibia: Microhylidae)

Vladislav A Gorin et al. PeerJ. .

Abstract

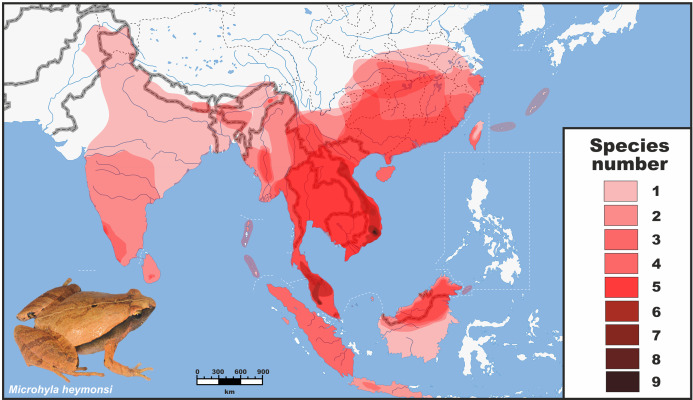
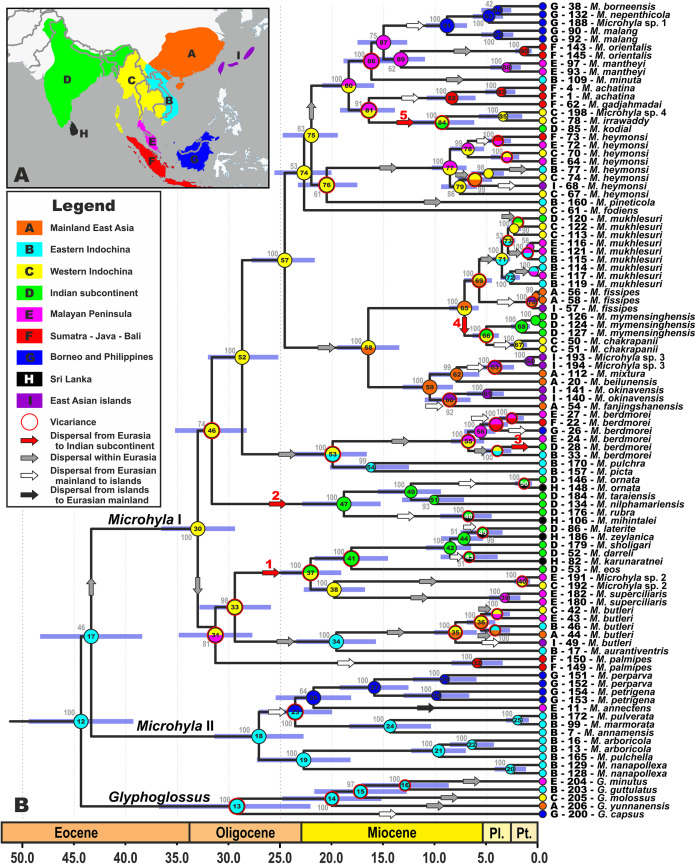
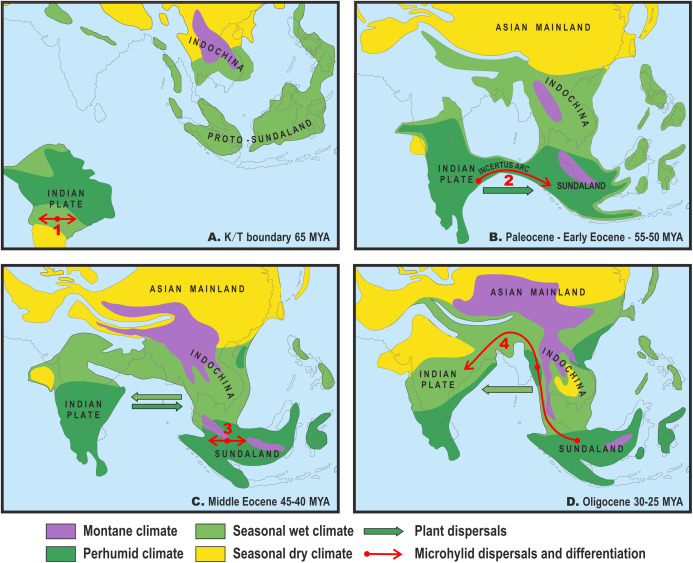
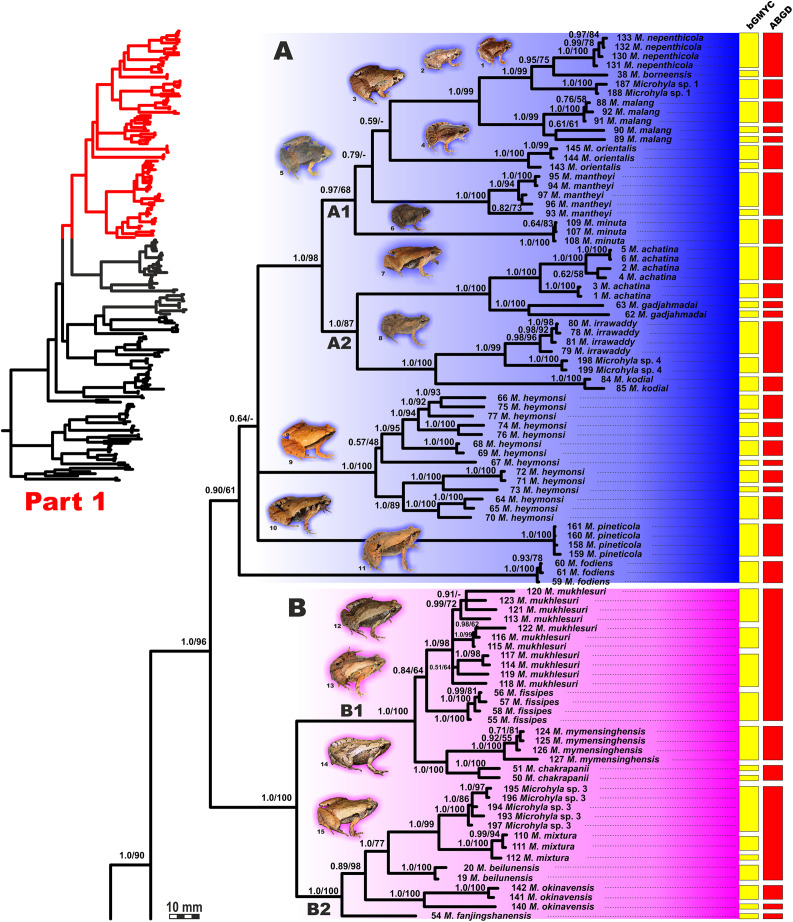
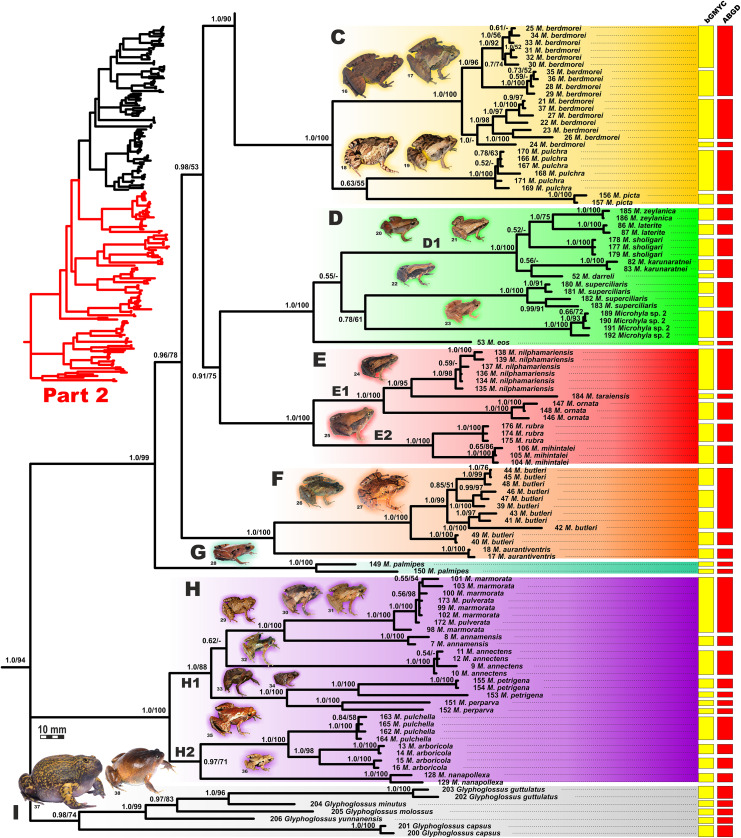
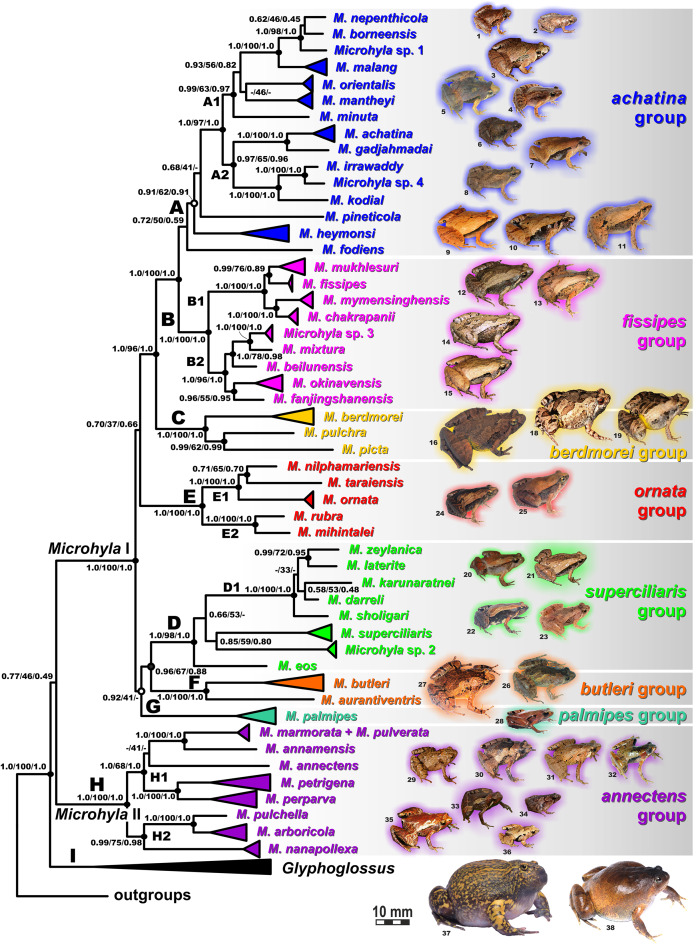
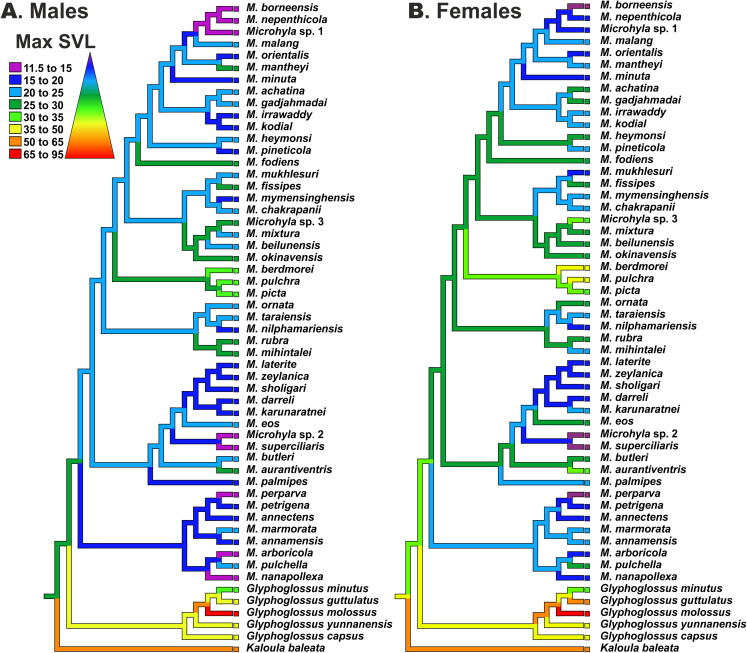
Frogs of the genus Microhyla include some of the world's smallest amphibians and represent the largest radiation of Asian microhylids, currently encompassing 50 species, distributed across the Oriental biogeographic region. The genus Microhyla remains one of the taxonomically most challenging groups of Asian frogs and was found to be paraphyletic with respect to large-sized fossorial Glyphoglossus. In this study we present a time-calibrated phylogeny for frogs in the genus Microhyla, and discuss taxonomy, historical biogeography, and morphological evolution of these frogs. Our updated phylogeny of the genus with nearly complete taxon sampling includes 48 nominal Microhyla species and several undescribed candidate species. Phylogenetic analyses of 3,207 bp of combined mtDNA and nuDNA data recovered three well-supported groups: the Glyphoglossus clade, Southeast Asian Microhyla II clade (includes M. annectens species group), and a diverse Microhyla I clade including all other species. Within the largest major clade of Microhyla are seven well-supported subclades that we identify as the M. achatina, M. fissipes, M. berdmorei, M. superciliaris, M. ornata, M. butleri, and M. palmipes species groups. The phylogenetic position of 12 poorly known Microhyla species is clarified for the first time. These phylogenetic results, along with molecular clock and ancestral area analyses, show the Microhyla-Glyphoglossus assemblage to have originated in Southeast Asia in the middle Eocene just after the first hypothesized land connections between the Indian Plate and the Asian mainland. While Glyphoglossus and Microhyla II remained within their ancestral ranges, Microhyla I expanded its distribution generally east to west, colonizing and diversifying through the Cenozoic. The Indian Subcontinent was colonized by members of five Microhyla species groups independently, starting with the end Oligocene-early Miocene that coincides with an onset of seasonally dry climates in South Asia. Body size evolution modeling suggests that four groups of Microhyla have independently achieved extreme miniaturization with adult body size below 15 mm. Three of the five smallest Microhyla species are obligate phytotelm-breeders and we argue that their peculiar reproductive biology may be a factor involved in miniaturization. Body size increases in Microhyla-Glyphoglossus seem to be associated with a burrowing adaptation to seasonally dry habitats. Species delimitation analyses suggest a vast underestimation of species richness and diversity in Microhyla and reveal 15-33 undescribed species. We revalidate M. nepenthicola, synonymize M. pulverata with M. marmorata, and provide insights on taxonomic statuses of a number of poorly known species. Further integrative studies, combining evidence from phylogeny, morphology, advertisement calls, and behavior will result in a better systematic understanding of this morphologically cryptic radiation of Asian frogs.

Keywords: Biogeography; Cryptic species; Glyphoglossus; Indian collision; Microhylinae; Miniaturization; Molecular phylogeny; Narrow-mouthed frogs; Southeast Asia; Species delimitation.


Conflict of interest statement

Nikolay A. Poyarkov is an Academic Editor for PeerJ. Suranjan Karunarathna is employed by Nature Explorations and Education Team (Sri Lanka). Luan Thanh Nguyen is employed by Asian Turtle Program—Indo-Myanmar Conservation (Vietnam). Other authors have declared that no competing interests exist.

Figures

Figure 1
Figure 1. Distribution and species richness of Oriental tiny frogs of the genus Microhyla.
Heatmap indicates approximate number of sympatrically co-occurring species (from 1 to 9); the highest species richness is observed in southern Vietnam and Malayan Peninsula. The individual species geographic range maps were adopted from the AmphibiaWeb (2020) database, and modified based on expert estimations in CorelDraw Graphics Suite X8. Grey/white dashed lines mark international borders on land/water, respectively. Base Map created using simplemappr.net. Photo shows Microhyla heymonsi—a widespread species occurring in Southeast and East Asia (by Nikolay A. Poyarkov).
Figure 2
Figure 2. Biogeographic history of Microhyla.
(A) Biogeographic regions used in the present study; (B) BEAST chronogram on the base of 3207 bp-long mtDNA + nuDNA dataset with the results of ancestral area reconstruction in RASP. For biogeographic areas definitions, species occurrence data and transition matrices see Supplemental Information 1, Tables S5 and S6. Information at tree tips corresponds to biogeographic area code (see Fig. 2A), sample number (summarized in Table S1), and species name, respectively. Node colors correspond to the respective biogeographic areas; values inside node icons correspond to node numbers (see Fig. S3 and Table S11 for divergence time estimates); values near nodes indicate marginal probabilities for ancestral ranges (S-DIVA analysis); icons illustrate vicariant and dispersal events (see Legend). Red arrows from 1 to 5 correspond to the dispersals to the Indian Subcontinent by Microhyla II lineages. Base Map created using simplemappr.net.
Figure 3
Figure 3. Paleogeography and climate of South and Southeast Asia, 60–25 Ma.
Tectonic reconstructions modified from Hall (2012); paleoclimate reconstructions based on Morley (2018). Solid arrows indicate directions of plant dispersals (dark-green—perhumid floral elements, light-green—seasonal wet/seasonal dry elements) (from Morley, 2018); red arrows show probable areas of Microhylinae diversification and ways of their dispersal. (A) K/T boundary to early Paleocene: the isolated Indian subcontinent (ISC) is drifting northwards cradling perhumid tropical biota, Southeast Asia (SEA) has primarily seasonal wet or seasonal dry climate, no land connection between SEA and ISC, basal radiation of Microhylinae in the ISC; (B) Paleocene to early Eocene: the ISC and SEA are at the same latitude within same perhumid climate zone, first land connections between India and Sundaland via Incertus Arc, dispersal of Microhylinae from the ISC to SEA; (C) Middle Eocene: land connection between the ISC and mainland Southeast Asia (modern-day Myanmar), basal radiation of Microhyla—Glyphoglossus assemblage in SEA; (D) Oligocene: India drifts into northern high-pressure zone and seasonally dry climates predominate across the ISC and SEA, Microhyla II lineages colonize the ISC from SEA. Base Map created using https://www.simplemappr.net/.
Figure 4
Figure 4. Updated mtDNA-genealogy of the Microhyla—Glyphoglossus assemblage (full tree, part 1).
BI genealogy of Microhyla and Glyphoglossus samples examined in this study reconstructed from 2478 bp of mtDNA fragment. Values at nodes correspond to BI PP/ML BS, respectively; numbers at tips correspond to sample numbers summarized in Table S1. Colors and letters (A–I) correspond to species groups of the Microhyla—Glyphoglossus assemblage. Yellow and red bars present the results of species delimitation analyses from bGMYC and ABGD algorithms, respectively. Frog photos are given in one scale, scale bar corresponds to 10 mm, numbers near thumbnails correspond to species: (1) Microhyla nepenthicola; (2) M. borneensis; (3) M. malang; (4) M. orientalis; (5) M. mantheyi; (6) M. minuta; (7) M. achatina; (8) M. irrawaddy; (9) M. heymonsi; (10) M. pineticola; (11) M. fodiens; (12) M. fissipes; (13) M. mukhlesuri; (14) M. chakrapanii; (15) M. okinavensis; (16) M. berdmorei (Vietnam); (17) M. berdmorei (Malaysia); (18) M. picta; (19) M. pulchra; (20) M. zeylanica; (21) M. sholigari; (22) M. karunaratnei; (23) Microhyla sp. 2; (24) M. ornata; (25) M. mihintalei; (26) M. butleri; (27) M. aurantiventris; (28) M. palmipes; (29) M. annamensis; (30) M. marmorata; (31) M. pulverata; (32) M. annectens; (33) M. petrigena; (34) M. perparva; (35) M. pulchella; (36) M. arboricola; (37) Glyphoglossus molossus; (38) G. guttulatus. Photos by Nikolay A. Poyarkov, Indraneil Das, Vladislav A. Gorin, Parinya Pawangkhanant, Luan Thanh Nguyen, and Evgeniya N. Solovyeva.
Figure 5
Figure 5. Updated mtDNA-genealogy of the Microhyla—Glyphoglossus assemblage (full tree, part 2).
BI genealogy of Microhyla and Glyphoglossus samples examined in this study reconstructed from 2,478 bp of mtDNA fragment. Values at nodes correspond to BI PP/ML BS, respectively; numbers at tips correspond to sample numbers summarized in Table S1. For legend, see Fig. 4. Photos by Nikolay A. Poyarkov, Indraneil Das, Vladislav A. Gorin, Parinya Pawangkhanant, Luan Thanh Nguyen, and Evgeniya N. Solovyeva.
Figure 6
Figure 6. Maximum Likelihood tree for the “total evidence” analysis of the 3207 bp-long concatenated mtDNA + nuclear DNA dataset.
Values at nodes correspond to BEAST PP/ML BS/BI PP, respectively; black and white circles correspond to well-supported (BI PP ≥ 0.95; ML BS ≥ 90) and moderately supported (0.95 > BI PP ≥ 0.90; 90 > ML BS ≥ 75) nodes, respectively; no circles indicate unsupported nodes. Colors and letters (A–I) marking the species groups in Microhyla species complex correspond to Figs. 4 and 5, but not to Fig. 2. Photos by Nikolay A. Poyarkov, Indraneil Das, Vladislav A. Gorin, Parinya Pawangkhanant, Luan Thanh Nguyen, and Evgeniya N. Solovyeva.
Figure 7
Figure 7. Body size evolution among members of the Microhyla—Glyphoglossus assemblage.
See Table S7 for SVL data. Color of branches corresponds to average SVL in males (A) and females (B) (in mm).

References

    1. Acton GD. Apparent polar wander of India since the Cretaceous with implications for regional tectonics and true polar wander. In: Radhakrishna T, Piper JDA, editors. The Indian Subcontinent and Gondwana: a Palaeomagnetic and Rock Magnetic Perspective. Vol. 44. Bangalore: Memoires of Geological Society of India; 1999. pp. 129–175.
    1. Agarwal I, Biswas S, Bauer AM, Greenbaum E, Jackman TR, De Silva A, Batuwita S. Cryptic species, taxonomic inflation, or a bit of both? New species phenomenon in Sri Lanka as suggested by a phylogeny of dwarf geckos (Reptilia, Squamata, Gekkonidae, Cnemaspis) Systematics and Biodiversity. 2017;15(5):1–13. doi: 10.1080/14772000.2017.1282553. - DOI
    1. Aitchison JC, Ali JR. India-Asia collision timing. Proceedings of the National Academy of Sciences of the United States of America. 2012;109(40):E2645–E2646. doi: 10.1073/pnas.1207859109. - DOI - PMC - PubMed
    1. Aitchison JC, Ali JR, Davis AM. When and where did India and Asia collide? Journal of Geophysical Research: Solid Earth. 2007;112:B05423.
    1. Ali JR, Aitchison JC. Gondwana to Asia: plate tectonics, paleogeography and the biological connectivity of the Indian subcontinent from the Middle Jurassic through latest Eocene (166-35 Ma) Earth-Science Reviews. 2008;88(3–4):145–166. doi: 10.1016/j.earscirev.2008.01.007. - DOI

LinkOut - more resources