

Bayesian central statistical monitoring using finite mixture models in multicenter clinical trials
- PMID: 32685763
- PMCID: PMC7358264
- DOI: 10.1016/j.conctc.2020.100566
Bayesian central statistical monitoring using finite mixture models in multicenter clinical trials
Abstract
Background: Central monitoring (CM), in which data across all clinical sites are monitored, has an important role in risk-based monitoring. Several statistical methods have been proposed to compare patient outcomes among the sites for detecting atypical sites that have different trends in observed data. These methods assume that the number of clinical sites is not small, e.g., 100 or more. In addition, the proportion of atypical sites is assumed to be relatively small. However, in actuality, the central statistical monitoring (CSM) has to be implemented in small or moderate sized clinical trials such as small phase II clinical trials. The number of sites is no longer large in such situations. Therefore, it is of concern that existing methods may not work efficiently in CM of small or moderate sized clinical trials. In the light of this problem, we propose a Bayesian CSM method to detect atypical sites as the robust method against the existence of atypical sites.
Methods: We use Bayesian finite mixture models (FMM) to model patient outcome values of both atypical and typical sites. In the method, the distributions of outcome values in normal sites are determined by choosing the body distribution, which has the largest mixture parameter value of finite mixture models based on the assumption that normal sites are in the majority. Atypical sites are detected by the criterion based on the posterior predictive distribution of normal site's outcome values derived from only the chosen body distribution.
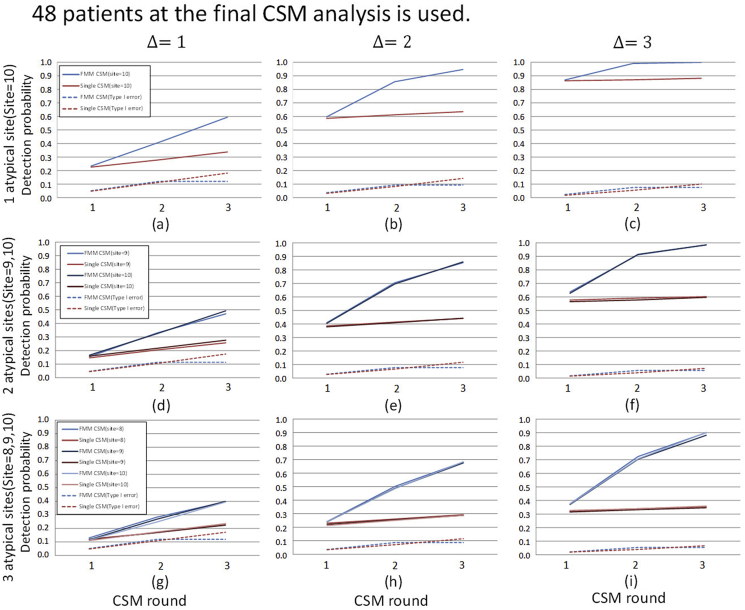
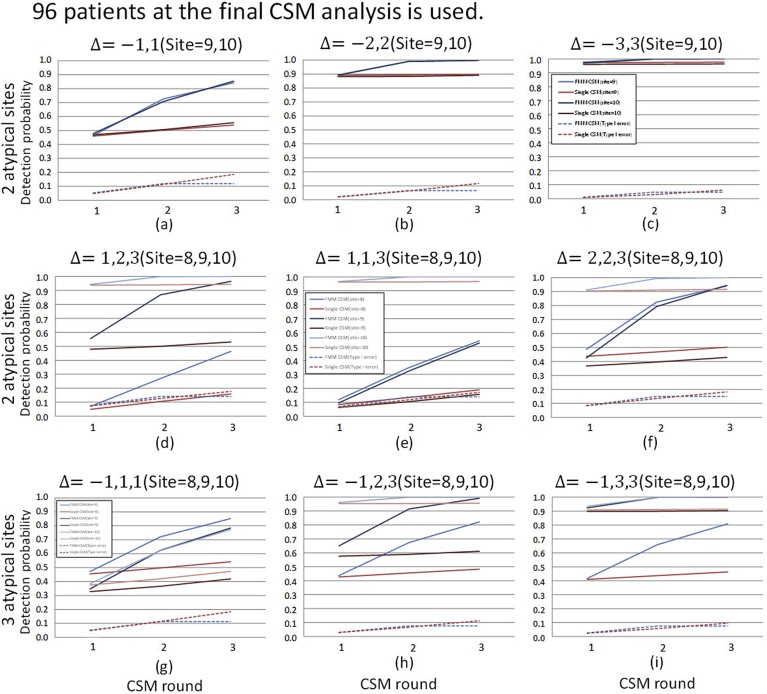
Results: Proposed method is evaluated by cumulative detection probability and type I error averaged over sites every round of CSM under the various scenarios, being compared with the conventional type analysis. If the total number of patients enrolled is 48, the proposed method is superior at least 10% for any shift sizes at the 2nd and the 3rd rounds. If the total number of patients is 96, both methods show similar detection probability for only one atypical site and large shift size. However, the proposed method is superior for the other scenarios. It is observed that all the type I errors averaged over sites are little difference between the methods at all the scenarios.
Conclusion: We propose a Bayesian CSM method which works efficiently in a practical use of CM. It is shown that our method detects atypical sites with high probability regardless of the proportion of the atypical sites under the small clinical trial settings which is the target of our proposed method.
Keywords: Abnormality detection; Contamination; Outlier detection; Posterior predictive distribution; Risk-based monitoring.
© 2020 The Authors.
Conflict of interest statement
The Authors declare that there is no conflict of interest.
Figures


References
-
- International Conference of Harmonisation E6(R2): guideline for good clinical practice. 2016. http://www.ich.org/fileadmin/Public_Web_Site/ICH_Products/Guidelines/Eff... Published.
-
- Olsen R., Bihlet A.R., Kalakou F. The impact of clinical trial monitoring approaches on data integrity and cost -a review of current literature. Eur. J. Clin. Pharmacol. 2005;72:399–412. - PubMed
-
- Eisenstein E.L., Lemons P.W., Tardiff B.E. Reducing the costs of phase III cardiovascular clinical trials. Am. Heart J. 2005;149:482–488. - PubMed
-
- European Medicines Agency Reflection paper on risk-based quality management in clinical trials. 2013. http://www.ema.europa.eu/docs/en_GB/document_library/Scientific_guidelin... Published.
LinkOut - more resources
Full Text Sources
