Review
. 2019 Jun:15:82-90.
doi: 10.1016/j.coisb.2019.04.002.

Footprint-based functional analysis of multiomic data

Affiliations
Review

Footprint-based functional analysis of multiomic data

Aurelien Dugourd et al. Curr Opin Syst Biol. 2019 Jun.

Abstract

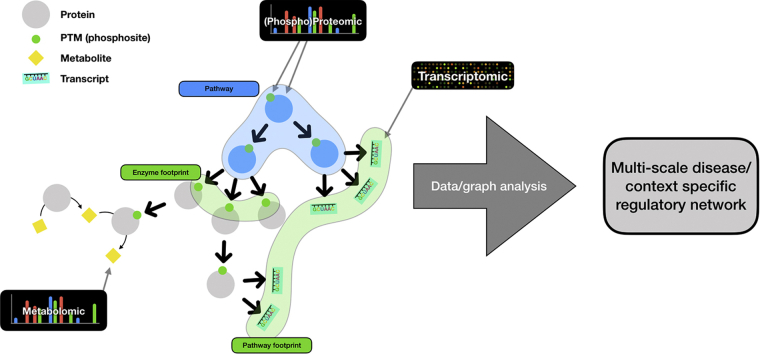
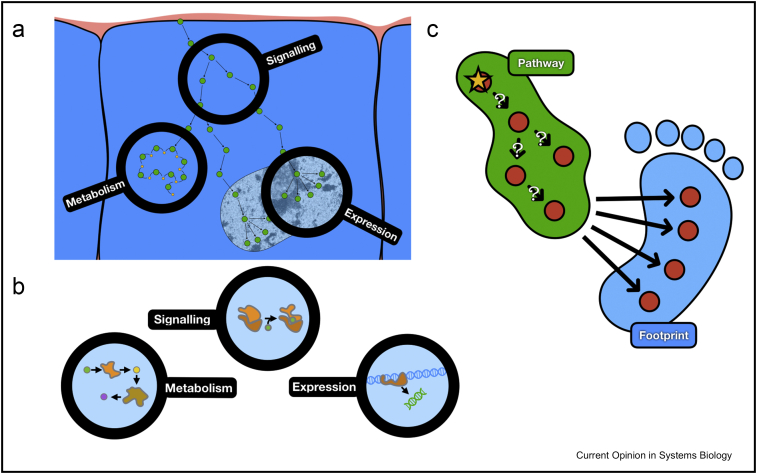
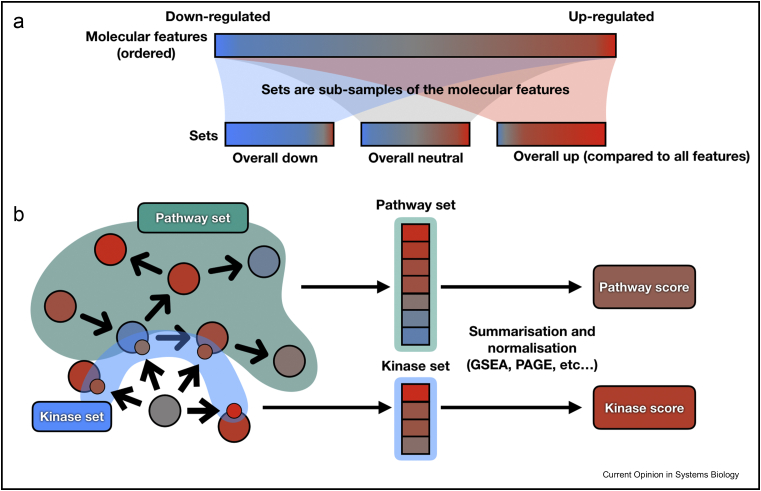
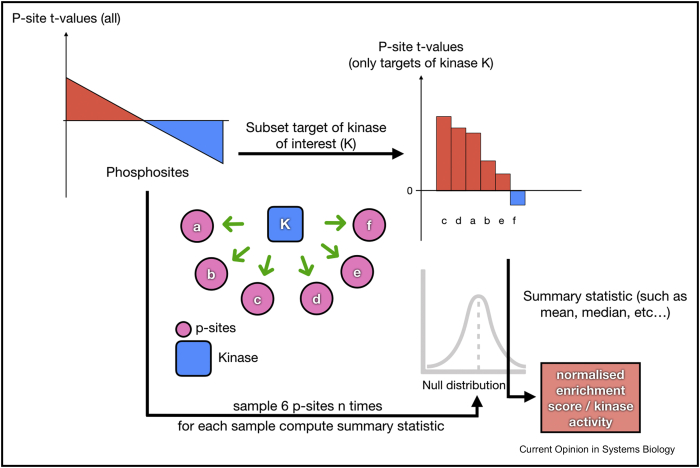
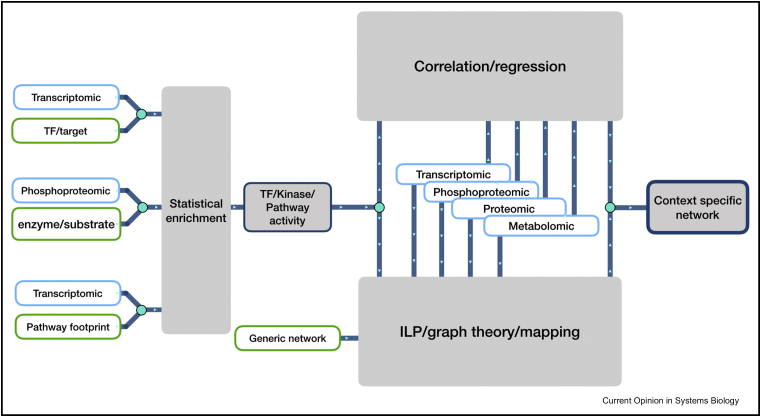
Omic technologies allow us to generate extensive data, including transcriptomic, proteomic, phosphoproteomic and metabolomic. These data can be used to study signal transduction, gene regulation and metabolism. In this review, we summarise resources and methods to analysis these types of data. We focus on methods developed to recover functional insights using footprints. Footprints are signatures defined by the effect of molecules or processes of interest. They integrate information from multiple measurements whose abundances are under the influence of a common regulator. For example, transcripts controlled by a transcription factor or peptides phosphorylated by a kinase. Footprints can also be generalised across multiple types of omic data. Thus, we also present methods to integrate multiple types of omic data and features (such as the ones derived from footprints) together. We highlight some examples of studies that leverage such approaches to discover new biological mechanisms.

Keywords: Data analysis; Footprint; Functional; Integration; Mechanistic; Metabolomics; Multi-omics; Phosphoproteomics; Proteomics; Trans-omics; Transcriptomics.


Figures

Image 1
Graphical abstract
Figure 1
Figure 1
From pathway to footprint for functional analysis of omic data. (a, b) Schematic representation of the interactions between signalling, gene regulation and metabolism. The main types of omic data to study are highlighted. (c) A certain pathway (green) and the potential footprint of perturbing this pathway (blue). The question marks represent the uncertainty of the functionality of interaction in the pathway in a specific context.
Figure 2
Figure 2
Comparison between pathway and kinase enrichment analysis. (a) Simplified representation of the fundamental idea of statistical enrichment analysis. Pathways, gene annotation and enzyme targets are sets of molecular features. The goal of an enrichment analysis is to characterise the significance of an overall change of each set compared to the rest of all measured molecular features in a specific condition. (b) In a classic pathway enrichment analysis, the features used to compute the enrichment scores are the members of the pathway itself. In contrast, a kinase enrichment analysis computes the enrichment score with targets of the kinase, but not the kinase itself. The same principle applies for transcription factor and pathway footprint enrichment analysis. GSEA, gene set enrichment analysis; PAGE, parametric analysis of gene set enrichment.
Figure 3
Figure 3
Example of kinase activity estimation with statistical enrichment analysis. Consider an experiment where the changes in phosphosite abundance were measured between two specific conditions. Given a kinase K that can phosphorylate six phosphosites (a, b, c, d, e, f), one could assume that the changes in abundance of the six phosphosites mirror changes in the activity of kinase K. To estimate this change of activity, the statistics (t-values in this example) associated with the change of abundance of the six targets of kinase K are summarised (using e.g. mean or variance). This summary statistic is called the enrichment score. Then, we need to estimate whether this enrichment score is significantly different from what would be expected from any given set of six phosphosites. To this end, six phosphosites are sampled randomly n times from all the phosphosites available in this study to generate a null distribution of enrichment scores. The enrichment score of kinase K is then normalised with this distribution. Thus, the resulting normalised enrichment score represents how extreme the change in the activity of kinase K is compared with possible kinases randomly associated to phosphosites.
Figure 4
Figure 4
Summarised representation of the multiomic analysis workflow. On the left, statistical enrichment analysis is used to estimate activity of kinases, transcription factors and pathways. Then, multiple types of omic data can be connected together with these activities by correlation/regression methods. They can also be combined with prior knowledge network through network contextualisation methods (optimisation, graph theory and mapping). Finally, the output of network contextualisation and correlation-based methods can be used, independently or combined, to generate multiomic context-specific networks.

References

    1. Miryala S.K., Anbarasu A., Ramaiah S. Discerning molecular interactions: a comprehensive review on biomolecular interaction databases and network analysis tools. Gene. 2018;642:84–94. - PubMed
    1. Ashburner M., Ball C.A., Blake J.A., Botstein D., Butler H., Cherry J.M., Davis A.P., Dolinski K., Dwight S.S., Eppig J.T. Gene ontology: tool for the unification of biology. The Gene Ontology Consortium. Nat Genet. 2000;25:25–29. - PMC - PubMed
    1. Liberzon A., Subramanian A., Pinchback R., Thorvaldsdóttir H., Tamayo P., Mesirov J.P. Molecular signatures database (MSigDB) 3.0. Bioinformatics. 2011;27:1739–1740. - PMC - PubMed
    1. Szklarczyk D., Franceschini A., Wyder S., Forslund K., Heller D., Huerta-Cepas J., Simonovic M., Roth A., Santos A., Tsafou K.P. STRING v10: protein–protein interaction networks, integrated over the tree of life. Nucleic Acids Res. 2015;43:D447–D452. - PMC - PubMed
    1. Türei D., Korcsmáros T., Saez-Rodriguez J. OmniPath: guidelines and gateway for literature-curated signaling pathway resources. Nat Methods. 2016;13:966–967. - PubMed

LinkOut - more resources