. 2020 Jul 20;11(1):3631.
doi: 10.1038/s41467-020-17399-8.

Basement membrane damage by ROS- and JNK-mediated Mmp2 activation drives macrophage recruitment to overgrown tissue

Affiliations

Basement membrane damage by ROS- and JNK-mediated Mmp2 activation drives macrophage recruitment to overgrown tissue

Neha Diwanji et al. Nat Commun. .

Abstract

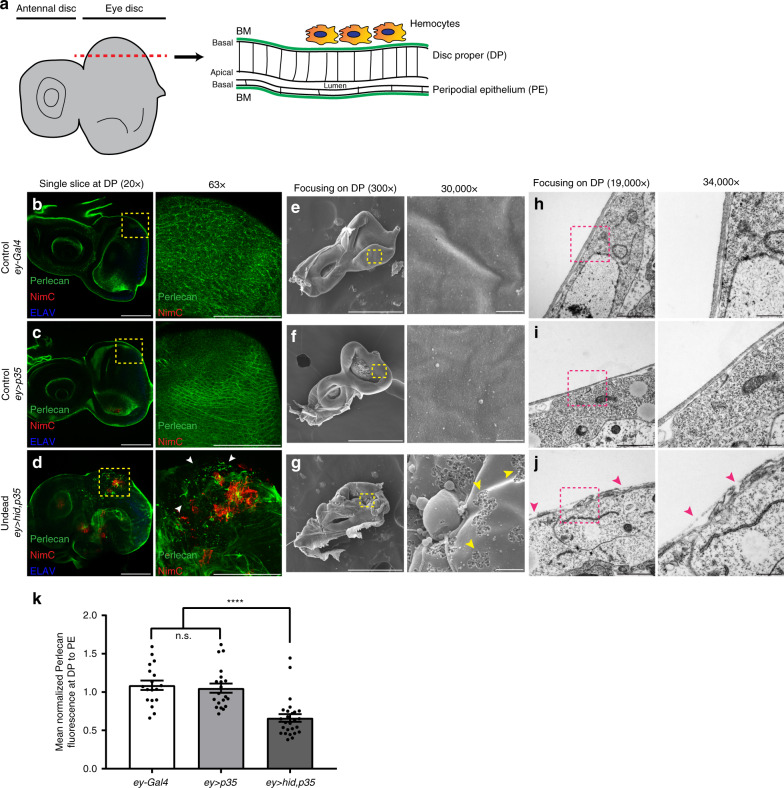
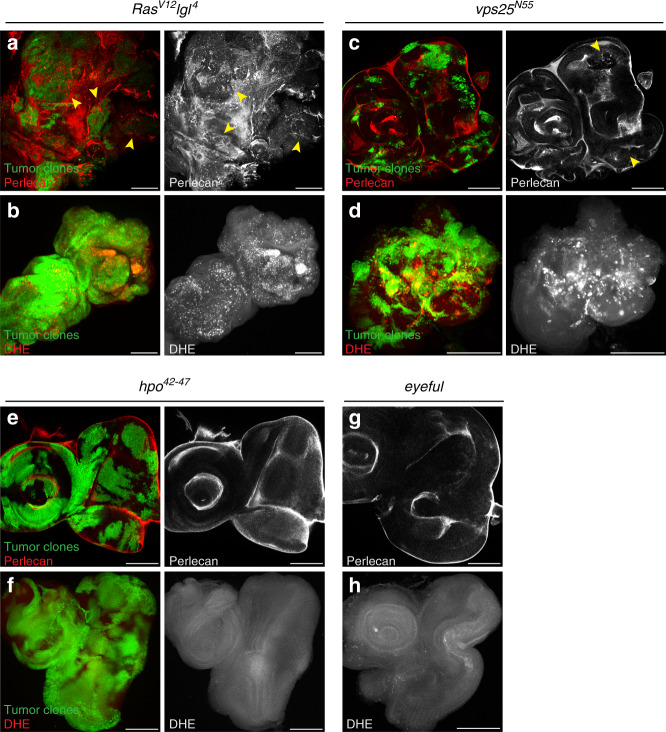
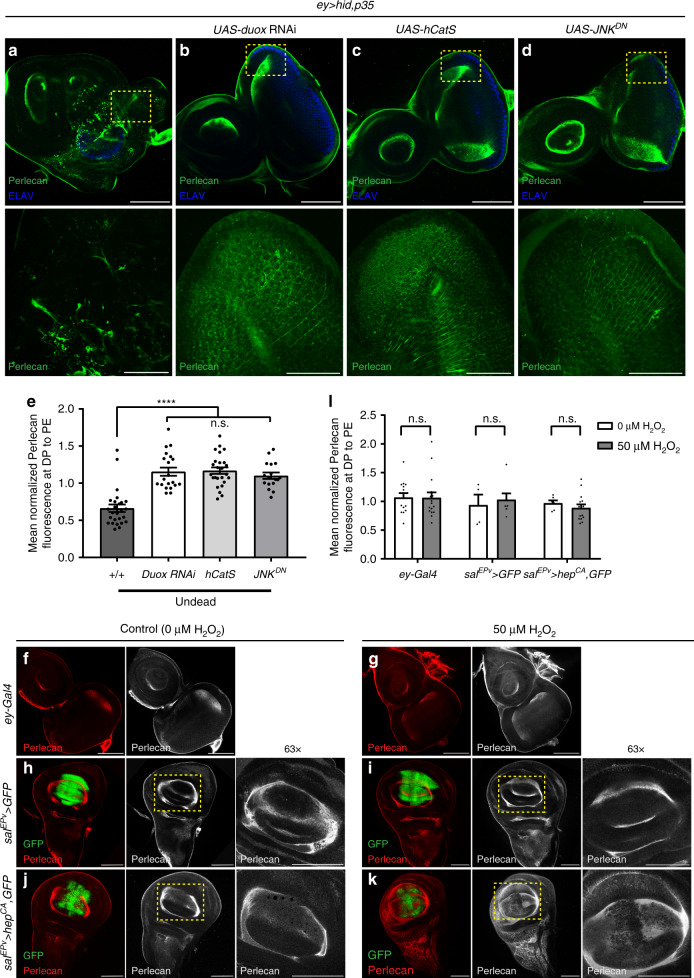
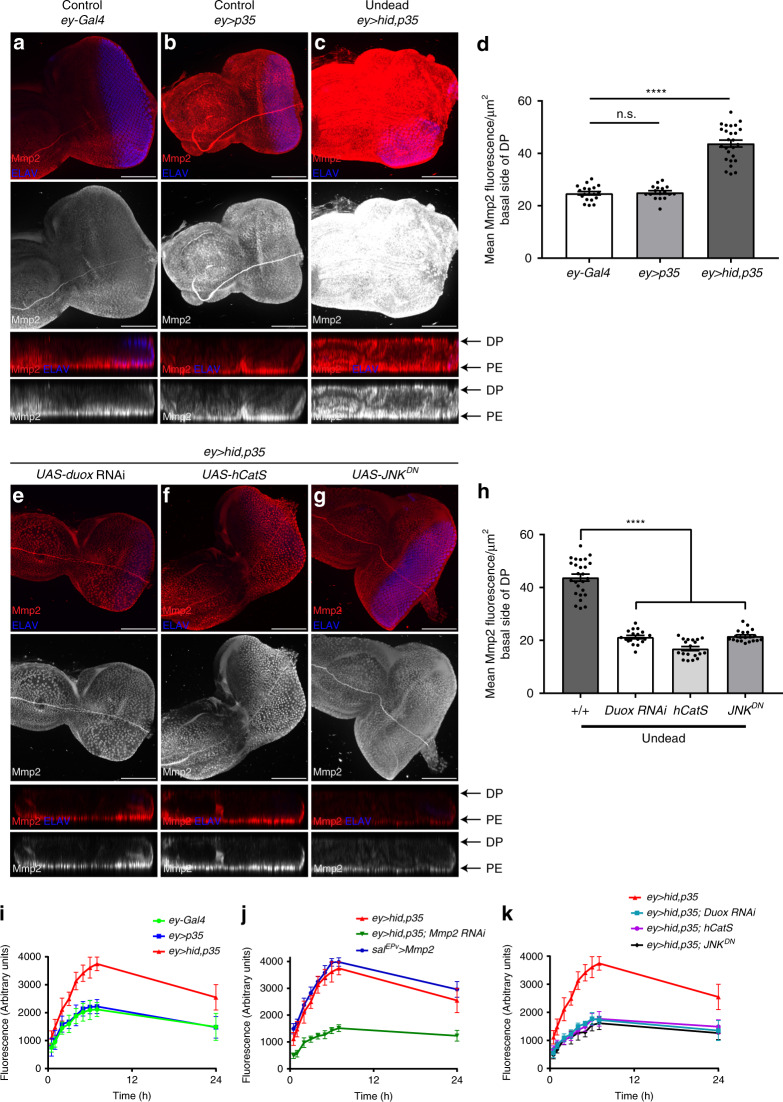
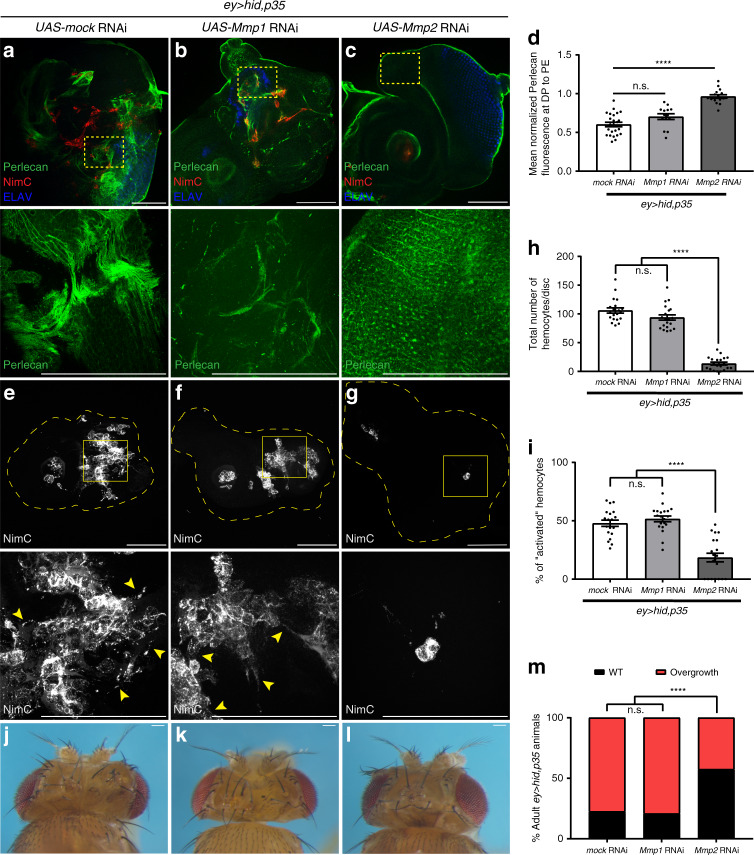
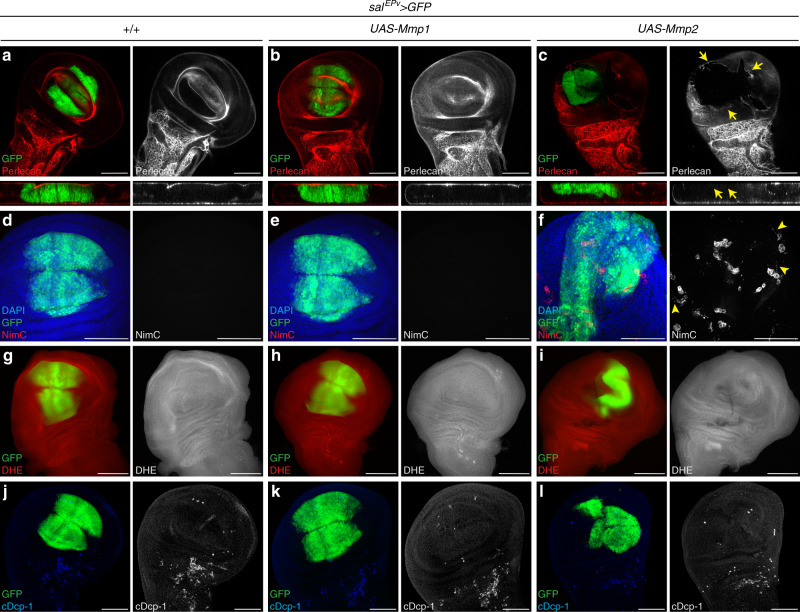
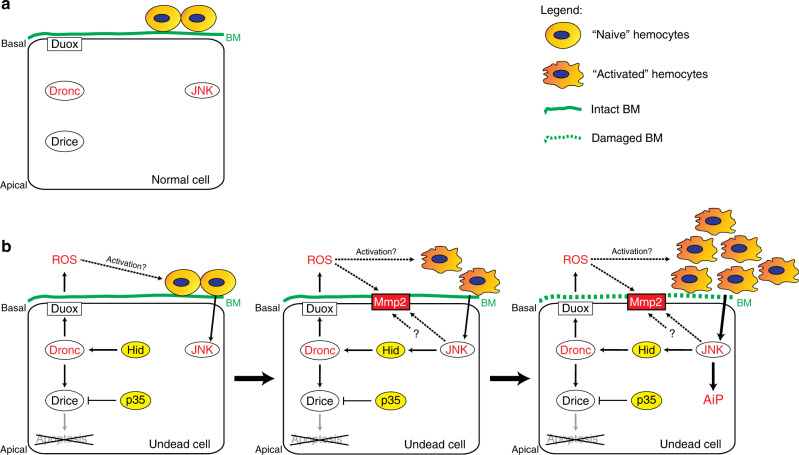
Macrophages are a major immune cell type infiltrating tumors and promoting tumor growth and metastasis. To elucidate the mechanism of macrophage recruitment, we utilize an overgrowth tumor model ("undead" model) in larval Drosophila imaginal discs that are attached by numerous macrophages. Here we report that changes to the microenvironment of the overgrown tissue are important for recruiting macrophages. First, we describe a correlation between generation of reactive oxygen species (ROS) and damage of the basement membrane (BM) in all neoplastic, but not hyperplastic, models examined. ROS and the stress kinase JNK mediate the accumulation of matrix metalloproteinase 2 (Mmp2), damaging the BM, which recruits macrophages to the tissue. We propose a model where macrophage recruitment to and activation at overgrowing tissue is a multi-step process requiring ROS- and JNK-mediated Mmp2 upregulation and BM damage. These findings have implications for understanding the role of the tumor microenvironment for macrophage activation.


Conflict of interest statement

The authors declare no competing interests.

Figures

Fig. 1
Fig. 1. Undead discs have damaged basement membranes (BM).
a Schematic representation of a surface view (XY; left) and an orthogonal section view (XZ; right) along the red dotted line through a 3rd instar larval eye-antennal imaginal disc. The columnar disc proper (DP) and squamous peripodial epithelium (PE) are apically separated by a lumen, their basal surfaces surrounded by the basement membrane (BM, green). Hemocytes attach specifically at the basal side of the DP. bd Representative examples of control (ey-Gal4 (b) and ey > p35 (c)) and experimental (undead) (ey > hid,p35 (d)) eye discs labeled for the BM marker Perlecan (green), for hemocytes with NimrodC (NimC) (red) and ELAV (blue) marking posterior photoreceptor neurons. Single slices focusing on the basal side of the DP (left), yellow squares are magnified (right). Damaged BM surrounded by hemocytes (red) indicated by white arrowheads (d, right). Scale bars, 100 μm. eg Scanning electron microscopy (SEM) images of ey-Gal4 (e), ey > p35 (f), and ey > hid,p35 (g) discs focusing on the DP side, yellow squares magnified (right). Damaged surface of BM indicated by yellow arrowheads (g, right). Scale bars, 200 μm (left) and 1 μm (right). hj Transmission electron microscopy (TEM) images of ey-Gal4 (h), ey > p35 (i), and ey > hid,p35 (j) discs focusing on the DP side, magenta squares magnified (right). Discontinuous BM indicated by magenta arrowheads (j, right). Scale bars, 0.5 μm (left) and 0.2 μm (right). k Quantification of Perlecan labeling at DP normalized to PE as internal control reveals that the BM is damaged in undead ey > hid,p35 discs compared with controls. Quantification of Perlecan fluorescence is taken from single slices at the basal surface of DP and PE. Data represented as mean fluorescence ± SEM analyzed by one-way ANOVA with Holm–Sidak test for multiple comparisons. ****p < 0.0001, n.s. = no statistical significance. Data from n = 18 (ey-Gal4), 20 (ey > p35), and 26 (ey > hid,p35) discs analyzed from five independent experiments. Source data are provided as a Source Data file.
Fig. 2
Fig. 2. BM damage coincides with ROS production in neoplastic tumor models.
Except for eyeful (g, h), tumor clones were generated by the MARCM technique using ey-FLP and are marked by GFP. eyeful is uniformly expressed in the ey-Gal4 domain. Scale bars, 100 μm. a, c, e, g The BM is detected by anti-Perlecan labeling (red left; gray right and g). Panels are single slices focusing on the basal side of DP. Quantification in Supplementary Fig. 6a. b, d, f, h ROS is detected by the dihydroethidium (DHE) indicator dye (red left; gray right and h). Panels are maximum intensity projections. Quantifications in Supplementary Fig. 6b. Exact genotypes: a, b yw ey-FLP/+; lgl4 FRT40A/tub-Gal80 FRT40A; act > y+ >Gal4, UAS-GFP56ST/+. c, d yw ey-FLP/+; FRT42D vps25N55/FRT42D tub-Gal80; act > y+ >Gal4 UAS-GFP56ST/+. e, f yw ey-FLP/+; FRT42D hpo42–47/FRT42D tub-Gal80; act > y+ >Gal4 UAS-GFP56ST/+. g, h yw ey-Gal4/+; UAS-Dl UAS-psq UAS-lola/+.
Fig. 3
Fig. 3. ROS and JNK are required, but not sufficient to cause BM damage.
ad In ey > hid,p35 eye imaginal discs, RNAi-induced depletion of ROS-producing Duox (b), transgenic overexpression of a secreted catalase hCatS (c) and inactivation of JNK by expression of dominant negative JNK (JNKDN) (d) results in suppression of BM damage compared with undead controls (a). Single slices focusing on the basal side of DP (top); yellow squares are magnified below. Scale bars, 100 μm (top), 50 μm (bottom). e Quantification of Perlecan intensity in ad is taken from single slices at the basal surface of DP and PE. Fluorescence intensity at PE was used as internal control for normalization. Data represented as mean fluorescence ± SEM analyzed by one-way ANOVA with Holm–Sidak test for multiple comparisons. ****p < 0.0001, n.s. = no statistical significance. Data from n = 26 (ey > hid,p35), 20 (duox RNAi), 25 (hCatS), and 17 (JNKDN) discs analyzed from four independent experiments. f, g Representative examples of wild-type (ey-Gal4) eye imaginal discs incubated ex vivo in Schneider’s media with 0 μM H2O2 (f) or 50 μM H2O2 (g) labeled for Perlecan (red or gray). Scale bars, 100 μm. hk Representative examples of wing imaginal discs with wild-type (h, i) or hyper-activated JNKK (hepCA) (j, k) incubated ex vivo in Schneider’s medium with 0 μM H2O2 (h, j) or 50 μM H2O2 (i, k) and labeled for Perlecan. Yellow squares in middle panels are magnified at right. Scale bars, 100 μm. l Quantification of Perlecan intensity in fk is taken from single slices at the basal surface of DP and PE. Fluorescence intensity at PE was used as internal control for normalization. Data represented as mean fluorescence ± SEM analyzed by one-way ANOVA with Holm–Sidak test for multiple comparisons. n.s. = no statistical significance. Data from n = 14 (ey-Gal4 0 μM H2O2), 16 (ey-Gal4 50 μM H2O2), 4 (salEPv > GFP 0 μM H2O2), 7 (salEPv > GFP 50 μM H2O2), 6 (salEPv > hepCA,GFP 0 μM H2O2), and 15 (salEPv > hepCA,GFP 50 μM H2O2) discs analyzed from three independent experiments. Source data are provided as a Source Data file.
Fig. 4
Fig. 4. Upregulation of Mmp2 levels and activity in undead discs requires ROS and JNK.
ac Representative examples of control (ey-Gal4 (a) and ey > p35 (b)) and undead (ey > hid,p35 (c)) eye imaginal discs labeled for Mmp2 (red and gray) and ELAV (blue). Orthogonal (YZ) section views (bottom panels) show increased localization of Mmp2 at the basal side of the DP in undead ey > hid,p35 discs compared with controls. Scale bars, 100 μm. d Quantification of Mmp2 intensity in ac taken from single slices at the basal surface of DP, represented as mean fluorescence ± SEM analyzed by one-way ANOVA with Holm–Sidak test for multiple comparisons. ****p < 0.0001, n.s. = no statistical significance. Data from n = 19 (ey-Gal4), 17 (ey > p35), and 26 (ey > hid,p35) discs analyzed from four independent experiments. Quantification of Mmp2 intensity at the PE shown in Supplementary Fig. 9b. eg Examples of ey > hid,p35 eye imaginal discs expressing Duox RNAi (e), transgenic hCatS (f), and dominant negative JNK (JNKDN) (g) labeled for Mmp2 (red and gray) and ELAV (blue). Orthogonal (YZ) cross section views (bottom) show suppression of the Mmp2 upregulation at the basal side of the DP compared with undead discs. Scale bars, 100 μm. h Quantification of Mmp2 intensity in eg taken from single slices at the basal surface of DP, represented as mean fluorescence ± SEM analyzed by one-way ANOVA with Holm–Sidak test for multiple comparisons. ****p < 0.0001, n.s. = no statistical significance. Data from n = 26 (ey > hid,p35), 18 (duox RNAi), 19 (hCatS), and 20 (JNKDN) discs analyzed in three independent experiments. ik Mmp2 activity measured by fluorometric assay using DQ-gelatin cleavage substrate, represented as mean ± SEM from three independent experiments. The same ey > hid,35 data (red lines) are shown in ik. This increased fluorescence in ey > hid,35 discs is lost upon knockdown of Mmp2, and is comparable to Mmp2 overexpression (j). Mmp2 activity in ey > hid,p35 undead discs is dependent on ROS and JNK (k). Source data are provided as a Source Data file.
Fig. 5
Fig. 5. Mmp2, not Mmp1, is required for BM damage, hemocyte recruitment and AiP.
For all panels, scale bars 100 μm. ****p < 0.0001, n.s. = no statistical significance. ac Single slices focused on the basal side of DP show uniform Perlecan labeling in Mmp2 RNAi discs (c), while Mmp1 RNAi discs (b) still show irregularities as in mock (RFP) RNAi discs (a). d Quantification of Perlecan intensity in (ac) taken from single slices at the basal surface of DP and normalized to PE, represented as mean fluorescence ± SEM analyzed by one-way ANOVA with Holm–Sidak test for multiple comparisons. n = 26 (mock RNAi), 14 (Mmp1 RNAi), 16 (Mmp2 RNAi) discs analyzed from three independent experiments. eg Recruitment and activation of hemocytes (NimC in gray) to ey > hid,p35 discs is severely impaired upon knockdown of Mmp2 (g), while Mmp1 RNAi does not affect hemocyte recruitment (f) similar to mock RNAi discs (e). Yellow squares are magnified below. Yellow arrowheads (bottom) indicate activated morphology of hemocytes. h, i Quantification of hemocyte recruitment (h) and activation (i) in ey > hid,p35 discs compared with Mmp1 and Mmp2 knockdown. Hemocyte activation was measured by the percentage of total hemocytes that had one or more cellular protrusions. Total number and percentage of activated hemocytes were analyzed by one-way ANOVA with Tukey’s multiple comparisons test. n = 20 discs per genotype analyzed in three independent experiments. jl Mmp2 knockdown suppresses adult overgrowth. Representative images of adult heads of ey > hid,p35 animals that are expressing either mock (RFP) RNAi (j), Mmp1 RNAi (k), or Mmp2 RNAi (l). Mmp2 RNAi also suppresses larval imaginal disc overgrowth, as seen in c) and (g, where the disc morphology is restored, in contrast to ey > hid,p35 discs in a and e. m Quantification of the suppression of adult ey > hid,p35 overgrowth by Mmp2 RNAi. Progeny was scored as wild type (WT) (black bars) or overgrown (red bars). Suppression is measured by a shift in percentage to WT from overgrown animals that is significantly different as determined by two-sided Fisher’s exact test. n = 100 to 150 flies counted per genotype from four independent experiments. Source data are provided as a Source Data file.
Fig. 6
Fig. 6. Mmp2-mediated BM damage recruits hemocytes.
GFP marks the SalEPv domain where Gal4 is expressed. Scale bars, 100 μm. ac Overexpression of Mmp2 is sufficient to damage the BM. Single slices focusing on the basal side of DP (top) and orthogonal (YZ) views (bottom) show big gaps in Perlecan labeling upon expression of Mmp2 (yellow arrows) (c), indicating that BM is damaged. In contrast, the BM is intact with uniform Perlecan labeling upon expression of Mmp1 (b) similar to control (a) indicating Mmp1 does not damage BM. Quantified in Supplementary Fig. 14. df Damage to BM recruits hemocytes. Hemocytes are detected by NimC (red left; gray right). Hemocytes are usually absent from wing discs (control d). Expression of Mmp1 does not recruit hemocytes to the discs (e). However, upon expression of Mmp2 (f), high numbers of hemocytes are recruited to the discs which have damaged BM. A few of these recruited hemocytes show “activated” morphology and are indicated by yellow arrowheads. Quantified in Supplementary Fig. 14. gi Expression of Mmp2 does not cause ectopic production of ROS (i), similar to control (g) and expression of Mmp1 (h). ROS is detected by dihydroethidium (DHE) dye (red left; gray right). Quantified in Supplementary Fig. 14. jl Expression of Mmp2 does not cause ectopic cell death indicated by absence of active caspases in (l), similar to control (j) and expression of Mmp1 (k). Active caspases are detected by cDcp-1 antibody (blue left; gray right). Quantified in Supplementary Fig. 14.
Fig. 7
Fig. 7. Summary model.
a In normal epithelial cells, Duox, JNK, Dronc, and Drice are synthesized, but are inactive. The basement membrane (BM) is intact and naive hemocytes are attached to the eye-antennal imaginal disc at the basal side of the disc proper. Please note the apical-basal polarity of the cells. b (left) In undead epithelial cells, expression of hid activates Dronc, but apoptosis is blocked due to co-expression of p35 which inhibits Drice and generates the undead condition. Instead, Dronc activates Duox which synthesizes extracellular ROS. These ROS may provide the initial stimulus for activation of the naive hemocytes. b (middle) Activated hemocytes release factors including the TNF ortholog Eiger which signal back to the undead cells. JNK is activated and induces the expression of hid, setting up an amplification loop. JNK—directly or indirectly—also induces the expression of Mmp2 resulting in accumulation of Mmp2 protein at the basal side of the plasma membrane. ROS may also further activate Mmp2. b (right) Mmp2 damages the BM at the basal side. The BM damage recruits additional hemocytes to further strengthen the amplification loop, resulting in AiP.

Similar articles

Cited by

References

    1. Biswas SK, Allavena P, Mantovani A. Tumor-associated macrophages: functional diversity, clinical significance, and open questions. Semin Immunopathol. 2013;35:585–600. - PubMed
    1. Mantovani A, Biswas SK, Galdiero MR, Sica A, Locati M. Macrophage plasticity and polarization in tissue repair and remodelling. J. Pathol. 2013;229:176–185. - PubMed
    1. Ford CA, et al. Oncogenic properties of apoptotic tumor cells in aggressive B cell lymphoma. Curr. Biol. 2015;25:577–588. - PMC - PubMed
    1. Goswami KK, et al. Tumor promoting role of anti-tumor macrophages in tumor microenvironment. Cell Immunol. 2017;316:1–10. - PubMed
    1. Pathria P, Louis TL, Varner JA. Targeting tumor-associated macrophages in cancer. Trends Immunol. 2019;40:310–327. - PubMed

Publication types

MeSH terms

LinkOut - more resources