. 2020 Jul 20;11(1):3642.
doi: 10.1038/s41467-020-17378-z.

Mutations in COMP cause familial carpal tunnel syndrome

Affiliations

Mutations in COMP cause familial carpal tunnel syndrome

Chunyu Li et al. Nat Commun. .

Erratum in

Abstract

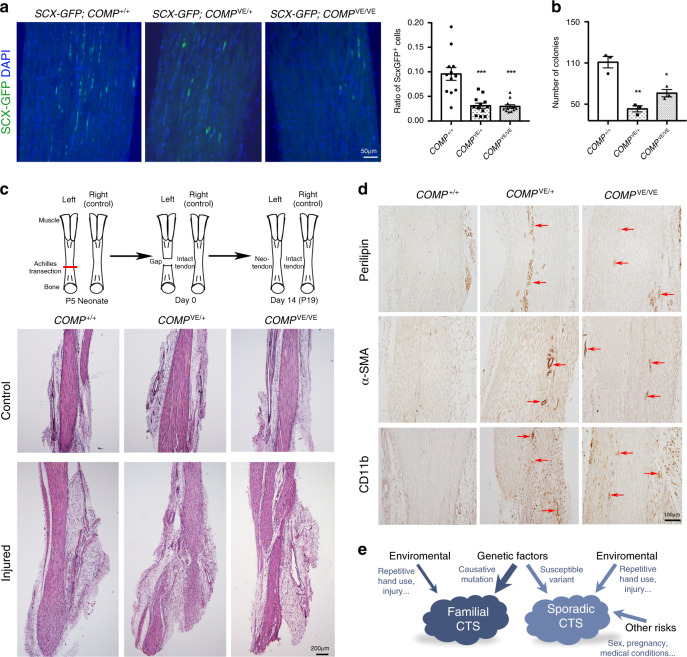
Carpal tunnel syndrome (CTS) is the most common peripheral nerve entrapment syndrome, affecting a large proportion of the general population. Genetic susceptibility has been implicated in CTS, but the causative genes remain elusive. Here, we report the identification of two mutations in cartilage oligomeric matrix protein (COMP) that segregate with CTS in two large families with or without multiple epiphyseal dysplasia (MED). Both mutations impair the secretion of COMP by tenocytes, but the mutation associated with MED also perturbs its secretion in chondrocytes. Further functional characterization of the CTS-specific mutation reveals similar histological and molecular changes of tendons/ligaments in patients' biopsies and the mouse models. The mutant COMP fails to oligomerize properly and is trapped in the ER, resulting in ER stress-induced unfolded protein response and cell death, leading to inflammation, progressive fibrosis and cell composition change in tendons/ligaments. The extracellular matrix (ECM) organization is also altered. Our studies uncover a previously unrecognized mechanism in CTS pathogenesis.


Conflict of interest statement

The authors declare no competing interests.

Figures

Fig. 1
Fig. 1. Pedigrees and clinical manifestations of familial carpal tunnel syndrome (CTS).
a Two pedigrees of familial carpal tunnel syndrome. The pedigree diagram of Family 1 is simplified, also see Supplementary Fig. 1 for the full pedigree diagram. Squares and circles denote male and female family members, respectively. Solid and open symbols denote affected and unaffected family members, respectively. The individuals with numbers underneath indicate the family members recruited in this study. The arrows indicate the probands; Family 2 has two probands who were identified in a single search of hospital records. b Magnetic resonance imaging (MRI) results indicate enlarged digital flexor tendons and compressed median nerves in patients’ carpal tunnels (two-tailed t test, ***p = 2.98 × 10−5 (Family 1) and 2.07 × 10−7 (Family 2) for area ratio of flexor tendon/carpal tunnel; ***p = 6.21 × 10−6 (Family 1) and 8.94 × 10−5 (Family 2) for median nerve, error bars are ± SEM). c MRI results indicate thickened transverse carpal ligaments (TCLs) in patients’ carpal tunnels (two-tailed t test, ***p = 7.90 × 10−5 for Family 1 and *p = 0.011 for Family 2, error bars are ± SEM). The hook of the hamate bone was used as a reference position, and the thickness of the TCLs was measured at the carpometacarpal level. n = 13 in controls, n = 11 in Family 1, and n = 7 in Family 2. Source data are provided as a Source Data file.
Fig. 2
Fig. 2. Histological analysis of CTS patients’ biopsies.
Transverse carpal ligament (TCL) tissues collected from controls (n = 2) and Family 1 patients (n = 3) were analyzed. a H&E staining reveals collagen fragmentation, edema (asterisk), and vascular structures (arrows) in patients. bd Immunostainings indicate lipomatosis (perilipin) and fibrosis (α-SMA and type III collagen) in patients’ TCLs. e Transmission electron microscopy (TEM) reveals a number of ectopic small fibrils and contrast difference in patients’ extracellular matrix (ECM). Source data are provided as a Source Data file.
Fig. 3
Fig. 3. Identification of COMP mutations.
a Linkage analysis of Family 1. Multimarker analysis of SNP genotyping results by Superlink-SNP reveals a locus on Chromosome 19p with the maximum LOD score more than 6. b Sanger sequencing chromatograms of the identified p.V66E and p.R718W heterozygous mutations in COMP in Family 1 and Family 2, respectively. c Schematic showing different domains of COMP protein and mutation spectrum of PSACH, MED, and CTS. The COMP mutation causing CTS in Family 1 locates in the N-terminal coiled-coil domain that mediates the formation of COMP homopentamer, while the COMP mutation in Family 2 is in the C-terminal globular domain, which was also reported causing MED. d Schematic showing how coiled-coil domain mediates COMP pentamerization, and e the alignment of coiled-coil domain and C-terminal globular domain of COMP amino acid sequences across multiple species. The coiled-coil sequence is characterized by a seven-residue repeat (denoted as “abcdefg”). Valine 66 (red) at “a” position is a highly conserved amino acid located in the hydrophobic pocket of COMP (d). Arginine 718 (red) is also highly conserved.
Fig. 4
Fig. 4. ER retention and activation of ER stress/UPR by mutant COMP.
a Wild-type, V66E, and R718W mutant COMP were expressed in primary tendon cells or RCS cells. Cell lysates and culture medium were respectively collected. Immunoblotting results indicate poor secretion of V66E mutant COMP by primary tendon cells but not RCS cells. The secretion of R718W-COMP is impaired in both types of cells. RCS rat chondrosarcoma cells, FBN fibronectin. The secretion ratios of different COMP from three experiments are quantified and summarized in the right panel, two-tailed t test, ***p = 0.00095 (V66E) and *p = 0.0161 (R718W) for primary tendon cells, p = 0.107 (V66E) and *p = 0.0108 (R718W) for RCS cells, error bars are ± SEM. bd Normal (n = 2) and Family 1 patients’ TCL tissues (n = 3) were analyzed. b Immunofluorescent staining indicates strong co-localization of COMP (green) and endoplasmic reticulum (ER, recognized by KDEL antibody, red) in patients’ TCL cells. DAPI stains cell nucleus (blue). c Transmission electron microscopy (TEM) shows distended and fragmented ER in CTS patients’ TCL cells (red arrows). d Immunohistochemical staining shows upregulation of BIP, ATF4, and CHOP in patients’ TCLs, indicating activation of ER stress/unfolded protein response (UPR) in CTS patients. Arrows point to the perinuclear staining of the ER-resident BIP. The boxed areas (black box) in the figures are magnified and shown in the insets (white box). Source data are provided as a Source Data file.
Fig. 5
Fig. 5. Impaired COMP complex formation and secretion in a COMP knock-in mouse model.
Primary tendon cells and chondrocytes were isolated from 6- to 8-week-old wild-type and mutant mice and cultured in vitro. Cell lysates and culture medium were respectively collected. a Reduced secretion of endogenous mutant COMP by primary tendon cells but not primary chondrocytes. FBN fibronectin. The secretion ratios of different COMP from three experiments are quantified and summarized in the right panel, two-tailed t test, *p = 0.0187 (COMPVE/+) and 0.0174 (COMPVE/VE) for primary tendon cells, p = 0.688 (COMPVE/+) and 0.795 (COMPVE/VE) for primary chondrocytes, error bars are ± SEM. b Native gel electrophoresis of primary tendon cells and chondrocytes reveals significant amounts of monomer or small protein complex in COMPVE mutants. The major difference between tenocytes and chondrocytes is the retention of a big protein complex (white box) and a monomer in the tendon cell lysates. c The sucrose density-gradient ultracentrifugation of culture medium of primary tendon cells and chondrocytes also indicates lower molecular weight of protein complex containing the mutant COMP. d Immunoblotting of Bip and Atf4 in primary tendon cells and chondrocytes indicates increased ER stress/UPR in tenocytes. The protein levels from three experiments are quantified in the right panel, two-tailed t test, *p = 0.030 (COMPVE/+) and 0.041 (COMPVE/VE) for Bip, *p = 0.0245 (COMPVE/+) and 0.0358 (COMPVE/VE) for Atf4, error bars are ± SEM. Source data are provided as a Source Data file.
Fig. 6
Fig. 6. Phenotypic analysis of the CTS mouse model.
The COMP knock-in mouse model carries the mouse mutation corresponding to human p.V66E (n ≥ 3 per genotype for each following analysis). a The H&E staining of 20-week-old mouse carpal tunnel shows comparable TCL, which is outlined by blue dotted lines, in wild-type and COMP mutants. The flexor tendons tend to be bigger in COMP mutants. b The statistical results of the cross-sectional area of flexor tendons (upper and lower parts, respectively). In total, 23 sections from three wild-type mice, 15 sections from four COMPVE/+ mice, and 28 sections from four COMPVE/VE mice were analyzed, two-tailed t test, upper **p = 0.002, 0.0034; lower **p = 0.0011, ***p = 0.0007, error bars are ± SEM. TCL transverse carpal ligament, N median nerve, B blood vessel, FT flexor tendon, CB carpal bone. c H&E staining of 20-month-old mouse carpal tunnel shows enlarged TCL in COMP mutants, which is outlined by blue dotted lines. α-SMA staining in 20-month-old mouse carpal tunnels (d) and Achilles tendons (e). The fibrosis is increased in COMPVE mutants. Vascular structures are observed in mutants (red arrows). Source data are provided as a Source Data file.
Fig. 7
Fig. 7. Compromised tendon-healing potential in the CTS mouse model.
a The number of Scx-positive cells (green) in Achilles tendon is significantly decreased in 30-week-old COMP-mutant mice (n = 3 per genotype, 12 slides per genotype were analyzed, two-tailed t test, ***p = 0.0001 (COMPVE/+) and 6.22 × 10−5 (COMPVE/VE), error bars are ± SEM). b Primary tendon cells were isolated from 4-week-old Achilles tendons and cultured in vitro. Colony assay of isolated tendon cells shows fewer colonies formed by COMP-mutant mice (n = 3 per genotype, two-tailed t test, *p = 0.0107, **p = 0.002, error bars are ± SEM). See Supplementary Fig. 16a for representative pictures. c Schematic and results of Achilles tendon transection injury experiments on neonatal mice (n ≥ 5 per genotype). Left Achilles tendon was transected at P5 (postnatal 5 days) and the right side was kept intact as a control. Tendon tissues were collected at P19 for analysis. H&E staining (lower panel) shows disorganization and poor recovery of injured Achilles tendons in mutant mice. d Immunohistochemical staining of injured Achilles tendons at P19 indicates increases of adipocytes (perilipin), fibrosis (α-SMA), and inflammation (CD11b) in mutant mice. e Schematic showing the contribution of different factors to the development of CTS, either familial or sporadic. The width of the arrow reflects the approximate extent of the contribution. Source data are provided as a Source Data file.

References

    1. Bland JD. Carpal tunnel syndrome. BMJ. 2007;335:343–346. - PMC - PubMed
    1. Padua L, et al. Carpal tunnel syndrome: clinical features, diagnosis, and management. Lancet Neurol. 2016;15:1273–1284. - PubMed
    1. John V, Nau HE, Nahser HC, Reinhardt V, Venjakob K. CT of carpal tunnel syndrome. AJNR Am. J. Neuroradiol. 1983;4:770–772. - PMC - PubMed
    1. Cobb TK, Bond JR, Cooney WP, Metcalf BJ. Assessment of the ratio of carpal contents to carpal tunnel volume in patients with carpal tunnel syndrome: a preliminary report. J. Hand Surg. Am. 1997;22:635–639. - PubMed
    1. Sernik RA, et al. Ultrasound features of carpal tunnel syndrome: a prospective case-control study. Skelet. Radio. 2008;37:49–53. - PubMed

Publication types

MeSH terms

Substances