. 2020 Jul 20;10(1):11969.
doi: 10.1038/s41598-020-68652-5.

Increasing endogenous activity of NMDARs on GABAergic neurons increases inhibition, alters sensory processing and prevents noise-induced tinnitus

Affiliations

Increasing endogenous activity of NMDARs on GABAergic neurons increases inhibition, alters sensory processing and prevents noise-induced tinnitus

Di Deng et al. Sci Rep. .

Abstract

Selective enhancement of GABAergic inhibition is thought to impact many vital brain functions and interferes with the genesis and/or progression of numerous brain disorders. Here, we show that selectively increasing NMDA receptor activity in inhibitory neurons using an NMDAR positive allosteric modulator (PAM) elevates spiking activity of inhibitory neurons in vitro and in vivo. In vivo infusion of PAM increases spontaneous and sound-evoked spiking in inhibitory and decreases spiking in excitatory neurons, and increases signal-to-noise ratio in the primary auditory cortex. In addition, PAM infusion prior to noise trauma prevents the occurrence of tinnitus and reduction in GABAergic inhibition. These results reveal that selectively enhancing endogenous NMDAR activity on the GABAergic neurons can effectively enhance inhibitory activity and alter excitatory-inhibitory balance, and may be useful for preventing diseases that involve reduced inhibition as the major cause.


Conflict of interest statement

The authors declare no competing interests.

Figures
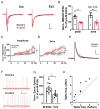
Figure 1
Figure 1
M-8324 enhances spontaneous spiking of GABAergic neurons in vitro. (A) Sample traces showing 30 µM M-8324’s effect on NMDAR EPSCs in inhibitory neurons (Int) and excitatory neurons (Ext). Scale bars, 100 ms, 50 pA. (B) Population results on normalized EPSC peak and area during bath application of M-8324 (30 µM) for Ext and Int neurons. N = 6 cells/3 mice for each group. Normalized isolated NMDAR EPSC amplitude (C) and area (D) before and after bath perfusion of GNE-8324 or M-8324 in GABAergic neurons. N = 12 cells/4 mice for GNE-8324, N = 11 cells/4 mice for M-8324. (E) Sample recording showing no impact of M-8324 on AMPAR-EPSPs in GABAergic neurons. Scale bars, 50 ms, 2 mV. (F) Sample voltage traces showing M-8324′s effect on spontaneous spiking in GABAergic neurons in whole-cell recording mode. Scale bars, 4 s, 10 mV. (G) Normalized spontaneous spiking frequency during either M-8324 or Veh bath application in GABAergic neurons in AI slice. N = 8, 5 cells/3 mice for M-8324 and Veh, unpaired t test. (H) Frequency of spontaneous spiking before and after M-8324 application in the same neurons. Dotted line represent slope of 1 (no change). Data are presented as the mean ± SEM.
Figure 2
Figure 2
M-8324 altered rates of sound-evoked and spontaneous spike in AI in vivo. (A) Experimental procedures. (B) Identification of putative excitatory (red) and inhibitory (blue) neurons based on their spike waveforms, while light gray dots between the blue and red dots were excluded from data analysis. (C) Example receptive fields during “before drug” (upper) and “after drug” (lower) trials for the same recording site in AI. Each pixel in the plot represents the average number of spikes evoked by a sound stimulus at a particular frequency and intensity level. (D) (Left) Examples of an increase in the frequency of spontaneous spiking in inhibitory neurons concomitant with a decrease in excitatory neurons after 100 µM M-8324 infusion. (Right) Population results and time course of changes in spontaneous spiking in excitatory and inhibitory neurons. (E) (Left) An increase in the sound-evoked spike frequency in inhibitory neurons concomitant with a decrease in excitatory neurons after 100 µM M-8324 infusion. (Right) Population and time course of changes. Neurons were the same as in (D). (F) A significant increase of SNR in excitatory neurons but no change for inhibitory neurons. (G) A significant increase in the E/I ratio for both spontaneous spiking (left) and sound-evoked responses (right). For excitatory cells, N = 95 cells/8 mice (vehicle), 73 cells/6 mice (M-8324 30 µM), 114 cells/9 mice (M-8324 100 µM). For inhibitory neurons, N = 28 cells/8 mice (vehicle), 19 cells/6 mice (M-8324 30 µM), 46 cells/9 mice (M-8324 100 µM). Data are presented as the mean ± SEM. * represent significance versus vehicle group.
Figure 3
Figure 3
M-8324’s effect on trial to trial reliability and duration of sound evoked spiking. (A) Trial to trial reliability of sound evoked responses were not altered in the presence of 100 µM M-8324 (between 90 and 100 min after infusion), in both excitatory and inhibitory neurons. For excitatory neurons, N = 8 mice (vehicle), N = 6 mice (M-8324 30 µM), N = 9 mice (M-8324 100 µM). (B) A significant reduction in the duration of evoked responses in excitatory neurons by 100 µM M-8324. (C, D) Effect of M-8324 on spontaneous spiking (C, left) and sound-evoked spiking (C, right) in inhibitory neurons, spontaneous spiking (D, left) and sound-evoked spiking (D, right) in excitatory neurons. Dotted lines are of slope of 1 (no change). Data are presented as the mean ± SEM. * represent significance compared to vehicle group.
Figure 4
Figure 4
Infusion of M-8324 prior to noise exposure prevented tinnitus in noise exposure model. (A) Experimental procedure. (B) Pre-pulse inhibition was not altered by M-8324, compared with Veh, in noise exposure model. N = 5 mice for each group. (C) M-8324 prevented deficit in gap detection in noise exposure model. Percent of startle suppression in M-8324 group was significantly lower than that in the Veh group. Data are presented as the mean ± SEM.
Figure 5
Figure 5
M-8324 infusion prior to noise exposure reduced PV-neuron loss and increased inhibitory synaptic transmission in AI in the noise-exposure (NE) mice. (A) Representative images of staining of PV-neurons in AI of control, NE + veh and NE + M-8324 group. Scale bar, 100 µm. (B) Density of PV-neurons in AI layer 2/3 in. N = 30 sections/5 mice for Ctrl group, N = 22 sections/5 mice for NE + veh group, N = 15 sections/4 mice for NE + M-8324 group (C) Sample traces of spontaneous inhibitory postsynaptic current (sIPSC) from AI excitatory neurons in NE + veh group and NE + M-8324 group. Scale bars, 40 pA/500 ms. (D) A significant reduction in the decay time of sIPSCs in NE group. (E) Amplitude of sIPSC in different among groups. (F) Charge of sIPSC in different among groups. (G) A significant increase in the frequency of sIPSC was seen in NE + M-8324 group. N = 17 cells/4 mice for Ctrl group, N = 23 cells/4 mcie for NE + veh, N = 10 cells/4 mice for NE + M-8324. Data are presented as the mean ± SEM.

References

    1. Kullmann DM. Interneuron networks in the hippocampus. Curr. Opin. Neurobiol. 2011;21:709–716. doi: 10.1016/j.conb.2011.05.006. - DOI - PubMed
    1. Isaacson JS, Scanziani M. How inhibition shapes cortical activity. Neuron. 2011;72:231–243. doi: 10.1016/j.neuron.2011.09.027. - DOI - PMC - PubMed
    1. Buzsaki G, Watson BO. Brain rhythms and neural syntax: implications for efficient coding of cognitive content and neuropsychiatric disease. Dialogues Clin. Neurosci. 2012;14:345–367. - PMC - PubMed
    1. Gonzalez-Burgos G, Cho RY, Lewis DA. Alterations in cortical network oscillations and parvalbumin neurons in schizophrenia. Biol. Psychiatry. 2015;77:1031–1040. doi: 10.1016/j.biopsych.2015.03.010. - DOI - PMC - PubMed
    1. Pelkey KA, et al. Hippocampal GABAergic inhibitory interneurons. Physiol. Rev. 2017;97:1619–1747. doi: 10.1152/physrev.00007.2017. - DOI - PMC - PubMed

Publication types

Substances