. 2020 Sep 18;48(16):9067-9081.
doi: 10.1093/nar/gkaa603.

CRISPR/Cas9 treatment causes extended TP53-dependent cell cycle arrest in human cells

Affiliations

CRISPR/Cas9 treatment causes extended TP53-dependent cell cycle arrest in human cells

Jonathan M Geisinger et al. Nucleic Acids Res. .

Abstract

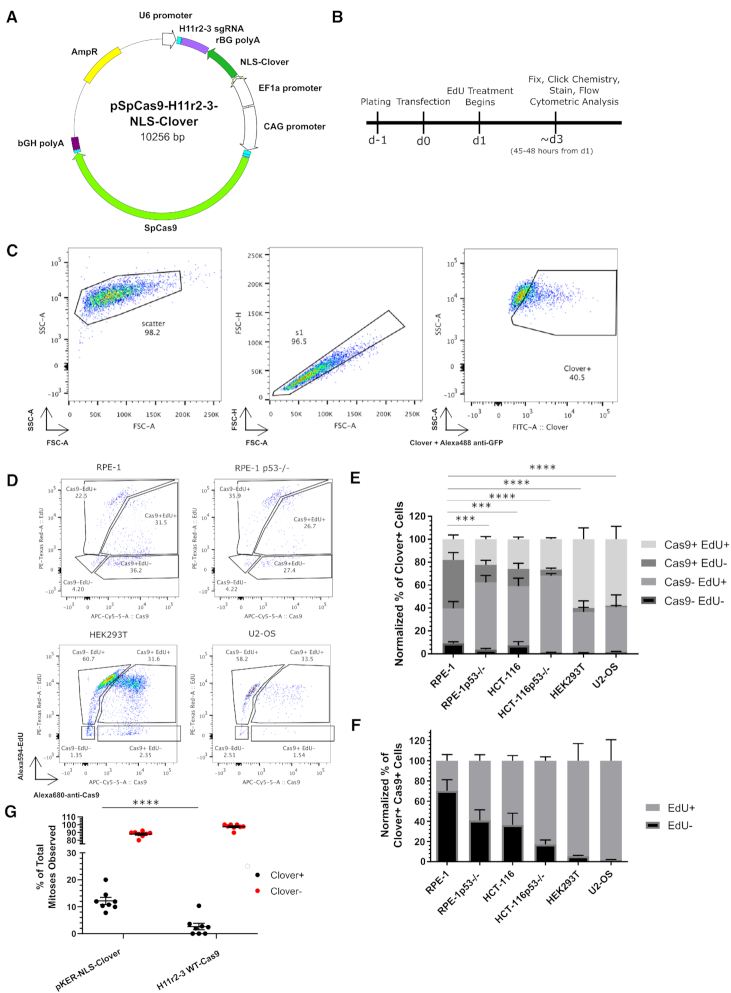
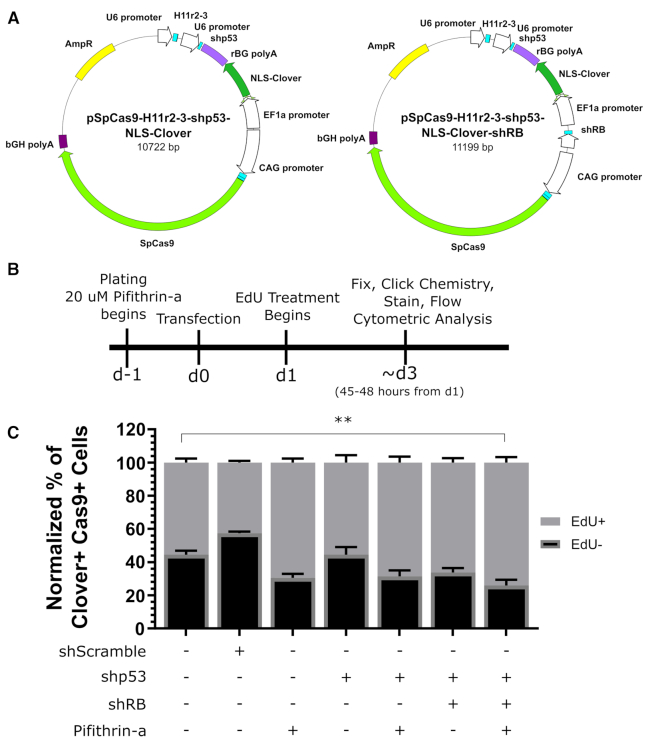
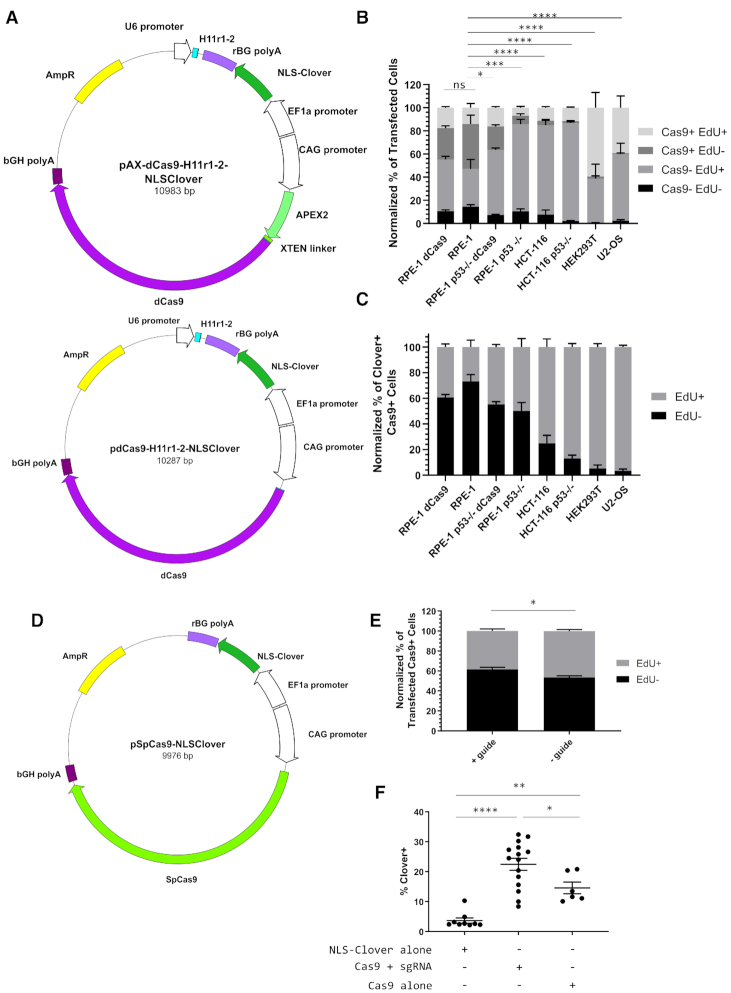
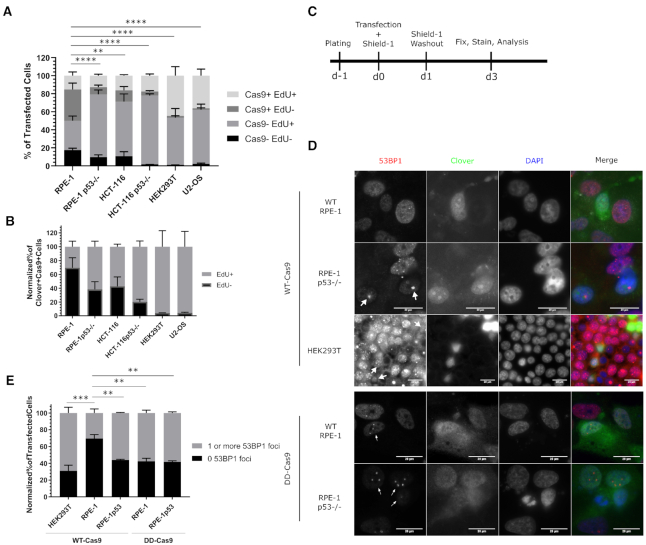
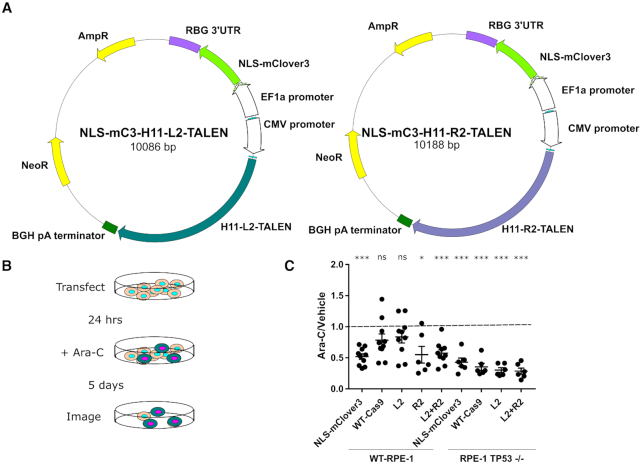
While the mechanism of CRISPR/Cas9 cleavage is understood, the basis for the large variation in mutant recovery for a given target sequence between cell lines is much less clear. We hypothesized that this variation may be due to differences in how the DNA damage response affects cell cycle progression. We used incorporation of EdU as a marker of cell cycle progression to analyze the response of several human cell lines to CRISPR/Cas9 treatment with a single guide directed to a unique locus. Cell lines with functionally wild-type TP53 exhibited higher levels of cell cycle arrest compared to lines without. Chemical inhibition of TP53 protein combined with TP53 and RB1 transcript silencing alleviated induced arrest in TP53+/+ cells. Using dCas9, we determined this arrest is driven in part by Cas9 binding to DNA. Additionally, wild-type Cas9 induced fewer 53BP1 foci in TP53+/+ cells compared to TP53-/- cells and DD-Cas9, suggesting that differences in break sensing are responsible for cell cycle arrest variation. We conclude that CRISPR/Cas9 treatment induces a cell cycle arrest dependent on functional TP53 as well as Cas9 DNA binding and cleavage. Our findings suggest that transient inhibition of TP53 may increase genome editing recovery in primary and TP53+/+ cell lines.


Figures

Figure 1.
Figure 1.
CRISPR/Cas9 treatment decreases cell cycle progression. (A) Schematic of transfected plasmid, identifying the H11 r2-3 gRNA cassette, the NLS-Clover cassette, and the WT-Cas9 cassette. (B) Experimental design schematic. (C) Flow cytometry gating strategy for identifying the transfected (Clover+) subpopulation. (D) Representative flow cytometric data of transfected cells for Cas9 and EdU positivity for the indicated cell lines. (E) Bar graph of the normalized percentages of four Cas9 EdU subpopulations in transfected cells for the six indicated cell lines. n = at least two independent experiments consisting of three technical replicates for each transfection. Data are shown as the mean ± SEM. Data were analyzed via an ordinary two-way ANOVA followed by a post-hoc Dunnett's multiple comparisons test comparing each cell type to RPE-1 cells. Significance is shown for the [Cas9+ EdU-] subpopulation comparisons. ***P < 0.001, ****P < 0.0001. (F) Bar graph of the Cas9+ normalized percentages of EdU+ and EdU- from panel E. Data is shown as the mean ± SEM. (G) Quantification of observed mitoses during live imaging of transfected and untransfected RPE-1 cells over a roughly two-day period. Each dot represents an individual movie and are from a total of 2 biological replicates. Transfected cells are indicated in black and untransfected cells are indicated in red. Each black dot has a corresponding red dot. Mean ± SEM are indicated by bars. ****P < 0.001. Data were analyzed by a two-way ANOVA followed by Sidak's multiple comparisons test.
Figure 2.
Figure 2.
Inhibition of TP53 can alleviate CRISPR/Cas9-associated cell cycle arrest. (A) Schematic of Cas9 reporter plasmids containing a short-hairpin cassette against TP53 or two short hairpin cassettes against TP53 and RB1. (B) Schematic of experimental design. (C) Bar graph of Cas9+ normalized percentages of EdU+ and EdU- cells for indicated treatments. n = at least two independent experiments each consisting of three technical replicates for each transfection. Data is shown as the mean ± SEM. **P < 0.009. Data were analyzed via an ordinary two-way ANOVA followed by a post-hoc Dunnett's multiple comparisons test, where each treatment was compared to wild-type RPE-1 cells treated with wild-type Cas9.
Figure 3.
Figure 3.
CRISPR/Cas9-associated cell cycle arrest is mediated by Cas9 binding. (A) Schematics of APEX2-dCas9 and dCas9 plasmids encoding the H11 r1-2 gRNA and an NLS-Clover cassette. (B) Bar graph of the Clover+-normalized percentages of four Cas9 EdU subpopulations in AX-dCas9- or dCas9-transfected cells for the six indicated cell lines. n = at least two independent experiments consisting of three technical replicates for each transfection. Data are shown as the mean ± SEM. Data were analyzed via an ordinary two-way ANOVA followed by a post-hoc Dunnett's multiple comparisons test comparing each cell type to AX-dCas9-treated RPE-1 cells. Significance is shown for the [Cas9+ EdU-] subpopulation comparisons. ns = not significant, **P = 0.0342, ***P = 0.0007, ****P < 0.0001. (C) Bar graph of the Cas9+ normalized percentages of EdU+ and EdU- from panel B. Data is shown as the mean ± SEM. (D) Schematic of plasmid encoding WT-Cas9 and NLS-Clover without a gRNA cassette. (E) Bar graph of Cas9+ normalized percentages of EdU+ and EdU- transfected wild-type RPE-1 cells with and without the H11r2-3 gRNA. n = at least two independent experiments consisting of at least two technical replicates each. Data are shown as the mean ± SEM. Data were analyzed via a one-way ANOVA followed by a post-hoc Sidak's multiple comparisons test. *P = 0.0117. (F) Dot plot of percentage of Clover+ cells for indicated transfections. n = three independent experiments consisting of at least two technical replicates each. Bars indicate mean ± SEM. *P = 0.0381, **P = 0.0065, ****P < 0.0001. Data were analyzed via a one-way ANOVA followed by a post-hoc Sidak's multiple comparisons test.
Figure 4.
Figure 4.
Wild-type Cas9 blocks recognition of Cas9-induced double-strand breaks. (A) Bar graph of the normalized percentages of four Cas9 EdU subpopulations in cells transfected with a plasmid encoding DD-Cas9, NLS-Clover, and the H11r1-2 gRNA for the six indicated cell lines. n = at least two independent experiments consisting of three technical replicates for each transfection. Data are shown as the mean ± SEM. Data were analyzed via an ordinary two-way ANOVA followed by a post-hoc Dunnett's multiple comparisons test comparing each cell type to RPE-1 cells. Significance is shown for the [Cas9+ EdU-] subpopulation comparisons. **P = 0.0048, ****P < 0.0001. (B) Bar graph of the Cas9+ normalized percentages of EdU+ and EdU- from panel A. Data is shown as the mean ± SEM. (C) Experimental design schematic. (D) Representative immunofluorescence of transfected wild-type and TP53/ RPE-1 and HEK293T cells for 53BP1 foci. White arrowheads indicate Clover+ cells possessing one or more 53BP1 foci. Scale bar indicates 20 μm. (E) Bar graph illustrating percentages of given cell lines transfected with the indicated vector that possessed either zero 53BP1 foci or one or more 53BP1 foci. n = at least two independent experiments consisting of at least 60 transfected cells per experiment. Data are shown as the mean ± SEM. ***P < 0.001, ****P = 0.0001. Data were analyzed via an ordinary two-way ANOVA followed by a post-hoc Dunnett's multiple comparisons test, where each treatment was compared to wild-type RPE-1 cells treated with wild-type Cas9.
Figure 5.
Figure 5.
CRISPR/Cas9 treatment leads to a greater degree of cell cycle arrest than TALEN treatment. (A) Schematic of H11 L2 and R2 TALEN plasmids encoding NLS-mClover3. (B) Schematic of experimental design of ara-C-based cell cycle arrest assay. (C) Dot plot of ratios of Clover+ cells after 5 days of ara-C treatment versus vehicle for indicated cell lines and transfected vectors. n = three independent experiments each consisting of two ara-C-treated technical replicates and one vehicle-treated control. Error bars indicate SEM. *P < 0.05, ***P < 0.0005. Data were analyzed with a one-sample t-test comparing the actual mean against a theoretical mean of 1.

References

    1. Calos M. Genome editing techniques and their therapeutic applications. Clin. Pharmacol. Ther. 2017; 101:42–51. - PubMed
    1. Geisinger J.M., Calos M.P.. Renault S., Duchateau P.. Site-specific recombination using PhiC31 Integrase. Site-Directed Insertion of Transgenes. 2013; 23:Dordrecht: Springer Netherlands; 211–239.
    1. Orr-Weaver T.L., Szostak J.W., Rothstein R.J.. Yeast transformation: a model system for the study of recombination. Proc. Natl. Acad. Sci. U.S.A. 1981; 78:6354–6358. - PMC - PubMed
    1. Giaever G., Chu A.M., Ni L., Connelly C., Riles L., Véronneau S., Dow S., Lucau-Danila A., Anderson K., André B. et al.. Functional profiling of the Saccharomyces cerevisiae genome. Nature. 2002; 418:387–391. - PubMed
    1. Kilian O., Benemann C.S.E., Niyogi K.K., Vick B.. High-efficiency homologous recombination in the oil-producing alga Nannochloropsis sp. Proc. Natl. Acad. Sci. U.S.A. 2011; 108:21265–21269. - PMC - PubMed

Publication types

MeSH terms

Substances