. 2020 Oct 7;71(19):5990-6003.
doi: 10.1093/jxb/eraa330.

Elevated CO2 has concurrent effects on leaf and grain metabolism but minimal effects on yield in wheat

Affiliations

Elevated CO2 has concurrent effects on leaf and grain metabolism but minimal effects on yield in wheat

Guillaume Tcherkez et al. J Exp Bot. .

Abstract

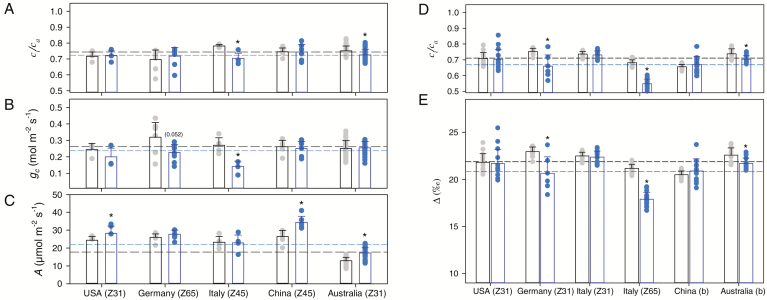
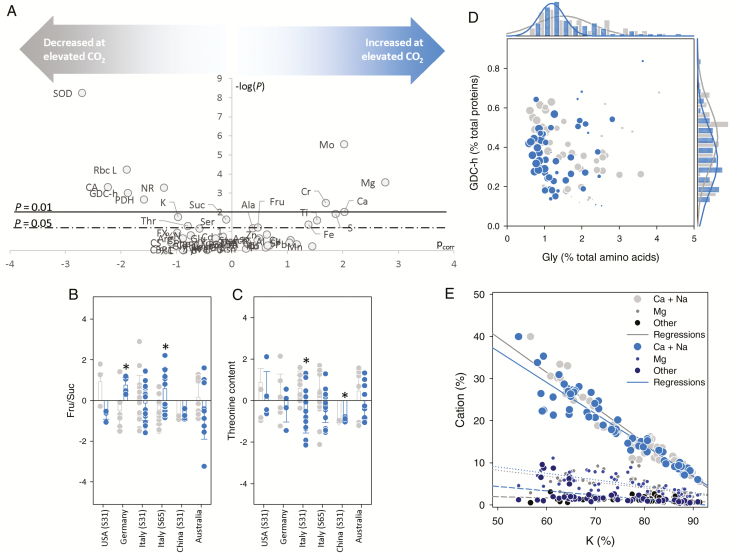
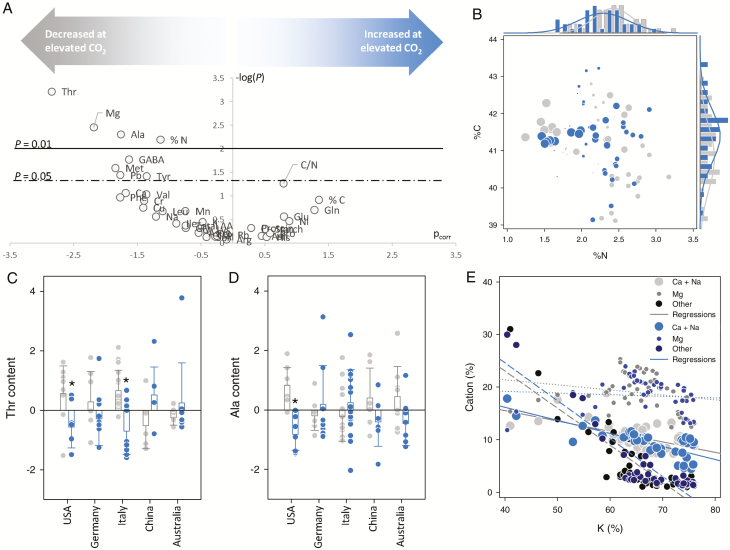
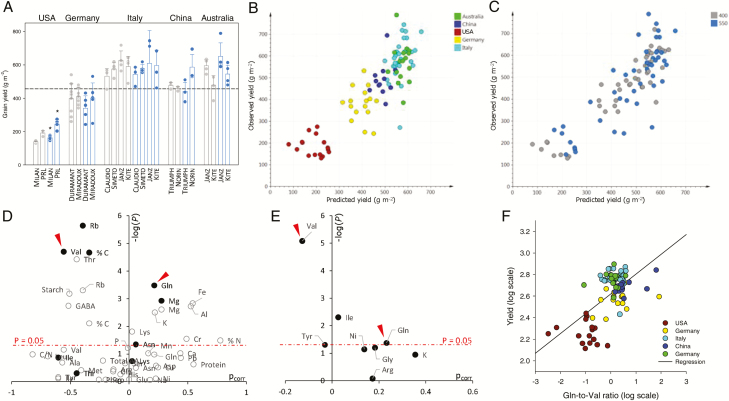
While the general effect of CO2 enrichment on photosynthesis, stomatal conductance, N content, and yield has been documented, there is still some uncertainty as to whether there are interactive effects between CO2 enrichment and other factors, such as temperature, geographical location, water availability, and cultivar. In addition, the metabolic coordination between leaves and grains, which is crucial for crop responsiveness to elevated CO2, has never been examined closely. Here, we address these two aspects by multi-level analyses of data from several free-air CO2 enrichment experiments conducted in five different countries. There was little effect of elevated CO2 on yield (except in the USA), likely due to photosynthetic capacity acclimation, as reflected by protein profiles. In addition, there was a significant decrease in leaf amino acids (threonine) and macroelements (e.g. K) at elevated CO2, while other elements, such as Mg or S, increased. Despite the non-significant effect of CO2 enrichment on yield, grains appeared to be significantly depleted in N (as expected), but also in threonine, the S-containing amino acid methionine, and Mg. Overall, our results suggest a strong detrimental effect of CO2 enrichment on nutrient availability and remobilization from leaves to grains.

Keywords: Climate change; N/C metabolism; multiple locations; physiology; ree-air CO2 enrichment (FACE); varieties; wheat.


Figures

Fig. 1.
Fig. 1.
Photosynthetic parameters in wheat grown under ambient (grey) or elevated (550 µmol mol−1, blue) CO2 mole fraction. (A–C) Leaf gas exchange properties: intercellular-to-atmospheric CO2 ratio (ci/ca) (A), stomatal conductance for CO2 (B), and net photosynthesis (C). (D, E) 12C/13C carbon isotope fractionation (Δ) measured using leaf total organic matter δ 13C (E) and calculated average ci/ca values (E). Asterisks indicate significant differences (P<0.05) between ambient and elevated CO2. P-values very close to statistical significance are given in parentheses. Dashed lines show average values across all countries. The developmental stage (BBCH) for plants in each country is given in parentheses; for China and Australia, values obtained at both BBCH stages 31 and 65 were pooled together (indicated by b). ND, not determined. (This figure is available in colour at JXB online.)
Fig. 2.
Fig. 2.
Metabolism of wheat leaves in plants grown under ambient (grey) or elevated (550 µmol mol−1, blue) CO2 mole fraction. (A) Volcano plot [–log(P-value) from ANOVA versus the loading pcorr from OPLS] showing the best discriminating components (metabolites, proteins, and elements) associated with the effect of CO2 enrichment. Threshold P-values (0.01 and 0.05) are shown with horizontal solid and dashed lines. (B, C) Relative fructose-to-sucrose ratio (B) and relative threonine content (C). In these panels, cultivars are pooled together for each country. Asterisks indicate significant differences (P<0.05) between the different average values. (D) Distribution of data points in the bi-plot showing the relative content of glycine decarboxylase h subunit (GDC-h) and glycine (Gly) (as a percentage of total proteins and total amino acids, respectively), with frequency plots on each axis. Countries are represented by different symbol sizes. (E) Relationship between K content and other cations under elevated and ambient CO2, with linear regressions (all significant, P<0.05). (This figure is available in colour at JXB online.)
Fig. 3.
Fig. 3.
Metabolism of wheat grains in plants grown under ambient (grey) or elevated (550 µmol mol−1, blue) CO2 mole fraction. (A) Volcano plot [–log(P-value) from ANOVA versus the loading pcorr from OPLS] showing the best discriminating components (metabolites and elements) associated with the effect of CO2 enrichment. Threshold P-values (0.01 and 0.05) are shown with horizontal solid and dashed lines. (B) Distribution of data points in the bi-plot showing elemental C and N content, with frequency plots on each axis. Countries are represented by different symbol sizes. (C, D) Relative threonine (C) and alanine (D) content. In these panels, cultivars are pooled together for each country. Asterisks indicate significant differences (P<0.05) between control and elevated CO2. (E) Relationship between K content and other cations under elevated and ambient CO2, with linear regressions (all significant, P<0.05, except for Mg). (This figure is available in colour at JXB online.)
Fig. 4.
Fig. 4.
Yield analysis. (A) Yield (in g grains m−2) of the different cultivars and countries. Asterisks indicate significant differences (P<0.05) between control (grey) and elevated (blue) CO2. (B, C) Relationship between observed yield and yield predicted using the OPLS model (comprising country+cultivar as a qualitative X variable), differentiating countries (B) or CO2 levels (C) (R2=0.75). (D) Volcano plot [–log(P-value) versus OPLS loading pcorr] showing the importance of variables for statistical analysis: P-values from separate linear regressions (each variable taken separately) (white circles), or P-values from variable elimination and linear model (black circles) against OPLS loadings (both univariate and OPLS models without country+cultivar as a qualitative X variable). (E) P-values from variable elimination and linear model against OPLS loadings (both univariate and OPLS models with country+cultivar as a qualitative X variable). In D and E, the horizontal dashed line indicates the P-value threshold of 0.05, and arrowheads indicate valine (Val) and glutamine (Gln). (F) Relationship between observed yield and the glutamine-to-valine ratio (log scales). The solid line represents the linear regression (R2=0.37). (This figure is available in colour at JXB online.)

References

    1. Adam NR, Wall GW, Kimball BA, et al. 2000. Acclimation response of spring wheat in a free-air CO2 enrichment (FACE) atmosphere with variable soil nitrogen regimes. 1. Leaf position and phenology determine acclimation response. Photosynthesis Research 66, 65–77. - PubMed
    1. Ainsworth EA, Long SP. 2005. What have we learned from 15 years of free-air CO2 enrichment (FACE)? A meta-analytic review of the responses of photosynthesis, canopy properties and plant production to rising CO2. New Phytologist 165, 351–371. - PubMed
    1. Ainsworth EA, Rogers A. 2007. The response of photosynthesis and stomatal conductance to rising [CO2]: mechanisms and environmental interactions. Plant, Cell & Environment 30, 258–270. - PubMed
    1. Akin DE, Kimball BA, Windham WR, Pinter PJ, Wall GW, Garcia RL, LaMorte RL, Morrison WH. 1995. Effect of free-air CO2 enrichment (FACE) on forage quality of wheat. Animal Feed Science and Technology 53, 29–43.
    1. Aranjuelo I, Erice G, Sanz-Sáez A, et al. 2015. Differential CO2 effect on primary carbon metabolism of flag leaves in durum wheat (Triticum durum Desf.). Plant, Cell & Environment 38, 2780–2794. - PubMed

Publication types