. 2020 Sep 3;5(17):e140329.
doi: 10.1172/jci.insight.140329.

Severe immunosuppression and not a cytokine storm characterizes COVID-19 infections

Affiliations

Severe immunosuppression and not a cytokine storm characterizes COVID-19 infections

Kenneth E Remy et al. JCI Insight. .

Abstract

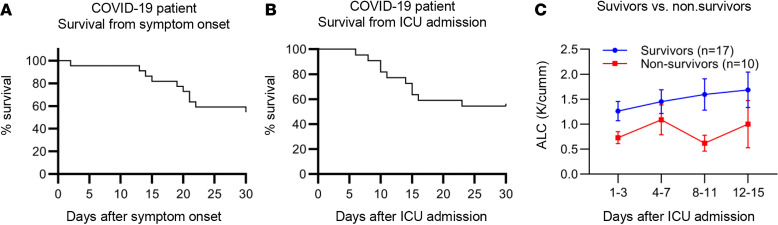
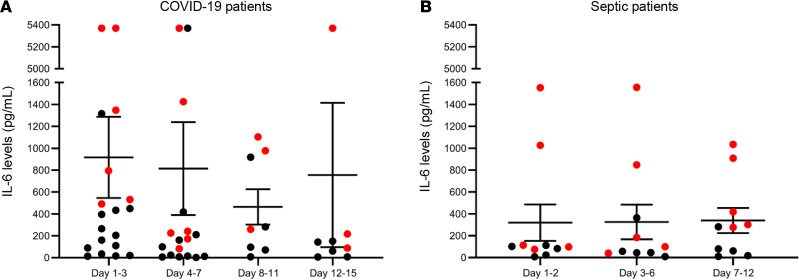
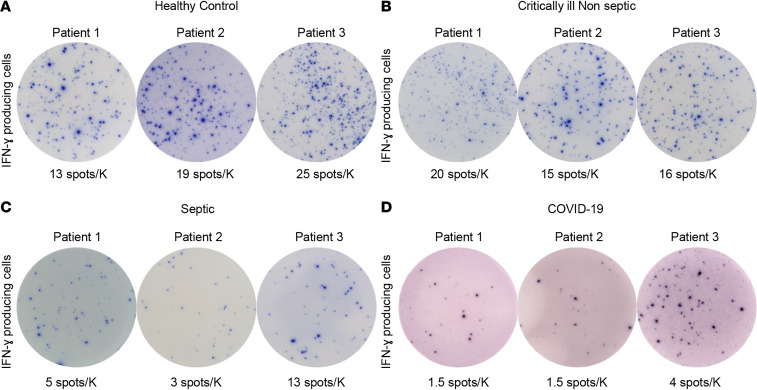
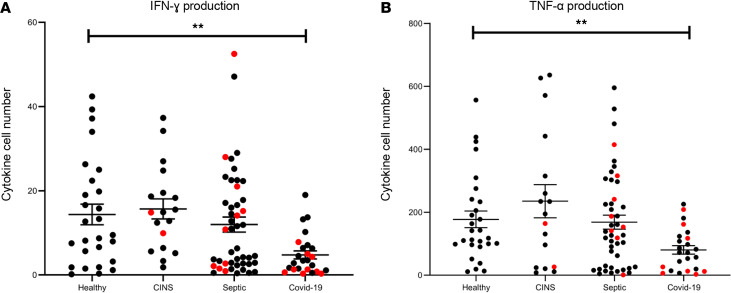
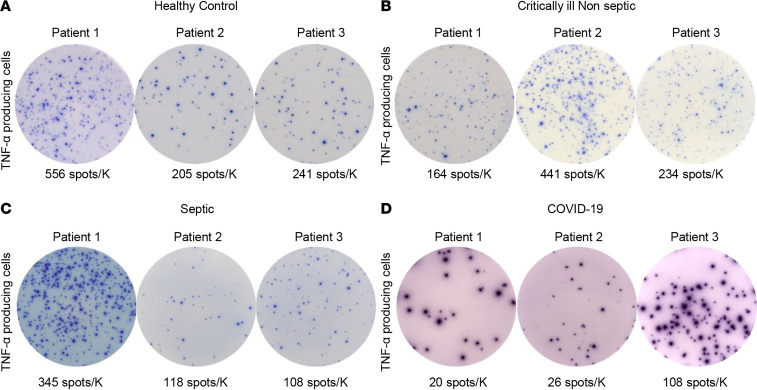
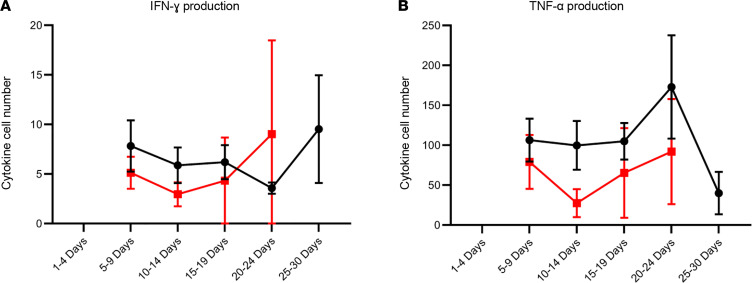
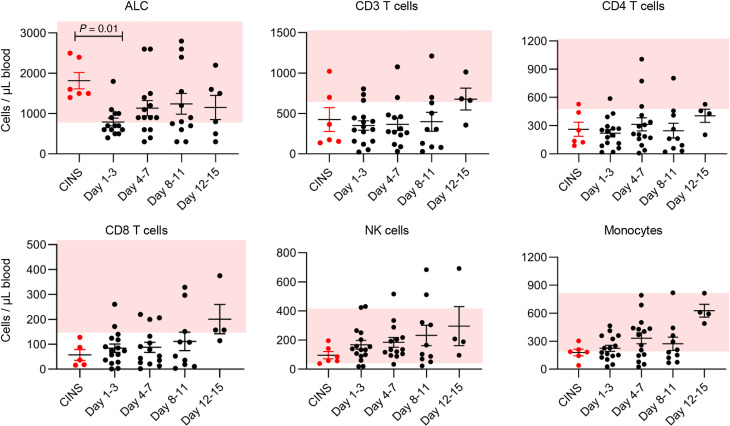
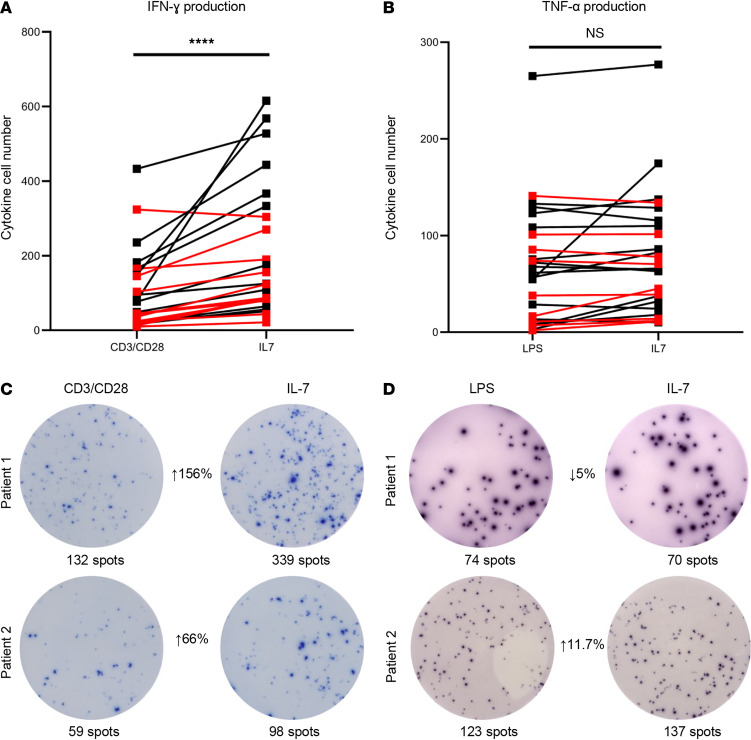
COVID-19-associated morbidity and mortality have been attributed to a pathologic host response. Two divergent hypotheses have been proposed: hyperinflammatory cytokine storm; and failure of host protective immunity that results in unrestrained viral dissemination and organ injury. A key explanation for the inability to address this controversy has been the lack of diagnostic tools to evaluate immune function in COVID-19 infections. ELISpot, a highly sensitive, functional immunoassay, was employed in 27 patients with COVID-19, 51 patients with sepsis, 18 critically ill nonseptic (CINS) patients, and 27 healthy control volunteers to evaluate adaptive and innate immune status by quantitating T cell IFN-ɣ and monocyte TFN-α production. Circulating T cell subsets were profoundly reduced in COVID-19 patients. Additionally, stimulated blood mononuclear cells produced less than 40%-50% of the IFN-ɣ and TNF-α observed in septic and CINS patients, consistent with markedly impaired immune effector cell function. Approximately 25% of COVID-19 patients had increased IL-6 levels that were not associated with elevations in other canonical proinflammatory cytokines. Collectively, these findings support the hypothesis that COVID-19 suppresses host functional adaptive and innate immunity. Importantly, IL-7 administered ex vivo restored T cell IFN-ɣ production in COVID-19 patients. Thus, ELISpot may functionally characterize host immunity in COVID-19 and inform prospective therapies.

Keywords: Adaptive immunity; COVID-19.


Conflict of interest statement

Conflict of interest: RSH, KER, LLM, and SCB are investigators on a clinical trial of IL-7 conducted by RevImmune in sepsis and COVID-19.

Figures

Figure 1
Figure 1. COVID-19 patient survival.
Survival is plotted as a function from symptom onset (A) and ICU admission (B). Difference in ALC over time between survivors and nonsurvivors (C). Total patients n = 27; survivors n = 17, nonsurvivors n = 10.
Figure 2
Figure 2. Plasma IL-6 levels in patients with COVID-19 and sepsis.
Dot plot representing plasma IL-6 levels for COVID-19 patients (A) and patients with sepsis (B) at various time points after ICU admission. Data bars represent mean ± SEM. Red dots represent nonsurvivors. Septic patients n = 10; COVID-19 days 1–3 n = 19, days 4–7 17, days 8–11 n = 8, days 12–15 n = 8.
Figure 3
Figure 3. Adaptive immune suppression in COVID-19 patients.
Representative ELISpot photomicrographs displaying IFN-ɣ production following overnight stimulation with anti-CD3/anti-CD28 antibodies for (A) healthy volunteers, (B) CINS patients, and (C) septic non–COVID-19 patients. (D) Three representative COVID-19–positive samples. Number of spots demonstrates the number of cytokine-producing T cells. Counts are presented as the corrected number of spots per thousand lymphocytes plated as fraction of the 2.5 × 10⁴ PBMCs plated in each well. Note the reduction in IFN-ɣ production in both septic and COVID-19 patients compared with CINS patients. Note also a degree of heterogeneity in IFN-ɣ production in COVID-19 and septic patients. Each photomicrograph was captured with the same magnification, and each image is to scale. ELISpot assays were performed using the PBMC fraction from freshly drawn whole blood. Each condition was run in duplicate for control samples and triplicate for COVID-19 samples.
Figure 4
Figure 4. Functional immune cytokine production measured by ELISpot in COVID-19, CINS, and septic patients and healthy volunteers.
Comparison graphs for ex vivo cytokine production using ELISpot, comparing healthy volunteers and CINS, septic, and COVID-19 patients. (A) Number of spots per 1000 lymphocytes plated following overnight culture stimulated with anti-CD3/anti-CD28 for IFN-ɣ samples. (B) Number of spots per 1000 myeloid cells plated, stimulated with LPS for TNF-α production. Each dot represents an individual patient. Red dots represent nonsurvivors. Horizontal bars represent mean ± SEM. Healthy n = 27 for IFN-ɣ, 28 for TNF-α; CINS n = 18; septic n = 46; COVID-19 n = 25 for IFN-ɣ, 24 for TNF-α. ANOVA comparing all groups for IFN-γ production showed that there was a difference between COVID-19 and the other groups (P = 0.003); and for TNF-α groups there was a statistically significant difference as well (P = 0.009). **P < 0.01.
Figure 5
Figure 5. Suppressed innate immune TNF-α response in COVID-19.
Representative ELISpot photomicrographs displaying baseline innate immune (monocyte) function with LPS-stimulated TNF-α production in PBMCs. Comparison between different donor types, including (A) healthy control volunteers and (B) CINS, (C) septic, and (D) COVID-19 patients. Number of spots demonstrates the number of cytokine-producing monocytes, and counts are presented as corrected number of spots per thousand monocytes plated as fraction of the 2.5 × 10³ PBMCs plated in each well. COVID-19 patients had suppressed TNF-α production when compared with controls. Each photomicrograph was captured with the same magnification, and each image is to scale. ELISpot assays were performed using the PBMC fraction from freshly drawn whole blood. Each condition was run in duplicate for control samples and triplicate for COVID-19 samples.
Figure 6
Figure 6. Number of cytokine-producing cells in COVID-19 patients serially over time.
Time course analysis of ELISpot results comparing (A) IFN-ɣ and (B) TNF-α production in COVID-19 survivors versus nonsurvivors (red) from onset of illness throughout ICU admission. There was no statistical significance between survivors and nonsurvivors using a modified t test. Day of illness data were collected via chart review. Horizontal bars represent mean ± SEM. For each time point, there are the following number of samples: IFN-ɣ survivors: 0, 8, 10, 10, 8, 4; IFN-ɣ nonsurvivors: 0, 4, 7, 3, 3, 0; TNF-α survivors: 0, 8, 7, 9, 6, 3; TNF-α nonsurvivors: 0, 5, 5, 4, 3, 0.
Figure 7
Figure 7. COVID-19 induces profound depletion of circulating immune effector cells.
Absolute numbers of various white blood cell types (displayed as cells/μL) were determined in COVID-19–positive and CINS patients (red dots). ALC was determined by Barnes-Jewish Hospital Clinical Laboratory as part of patient clinical laboratory tests. CD3+ T, CD4+ T, CD8+ T, and NK cell and monocyte quantification was performed using flow cytometry as described in Methods. Pink shading represents normal reference values for healthy individuals at Barnes-Jewish Hospital Laboratories. Analysis by ANOVA with Dunnett’s multiple comparison tests showed a significant decrease in ALC from CINS to COVID-19 days 1–3; P = 0.01. ALC for CINS n = 6; ALC for COVID-19 days 1–3 n = 15, days 4–7 n = 14, days 8–11 n = 12, days 12–15 n = 6. Cell counts for CD3+, CD4+, CD8+, and NK cells and monocytes: CINS n = 6; COVID-19 days 1–3 n = 15, days 4–7 n = 14, days 8–11 n = 10, days 12–15 n = 4.
Figure 8
Figure 8. IL-7 restores adaptive immune function in patients with COVID-19.
Line plot demonstrating change in the number of cytokine-producing cells using ELISpot between control (anti-CD3/anti-CD28 antibody or LPS) samples and stimulation with IL-7 for IFN-ɣ (A) and TNF-α (B). Each dot represents and individual patient. Red lines represent values for patients who died. IL-7 caused a significant increase in the number of IFN-ɣ–producing T cells in COVID-19 patients; ****P < 0.0001. IL-7 did not increase monocyte TNF-α production. (C and D) Representative photomicrographs demonstrating ELISpot change from control sample to IL-7 stimulated for IFN-ɣ and TNF-α. Paired samples were analyzed using a paired Wilcoxon’s rank-sum test. IFN-ɣ n = 25, TNF-α n = 25.

References

    1. doi: 10.1093/cid/ciaa449. Chen X, et al. Detectable serum SARS-CoV-2 viral load (RNAaemia) is closely correlated with drastically elevated interleukin 6 (IL-6) level in critically ill COVID-19 patients [published online April 17, 2020]. Clin Infect Dis . - DOI - PMC - PubMed
    1. Guo YR, et al. The origin, transmission and clinical therapies on coronavirus disease 2019 (COVID-19) outbreak - an update on the status. Mil Med Res. 2020;7(1):11. - PMC - PubMed
    1. McGonagle D, Sharif K, O’Regan A, Bridgewood C. Interleukin-6 use in COVID-19 pneumonia related macrophage activation syndrome. Autoimmun Rev. 2020;19(6):102537. doi: 10.1016/j.autrev.2020.102537. - DOI - PMC - PubMed
    1. Qin C, et al. Dysregulation of immune response in patients with coronavirus 2019 (COVID-19) in Wuhan, China. Clin Infect Dis. 2020;71(15):762–768. doi: 10.1093/cid/ciaa248. - DOI - PMC - PubMed
    1. Sarzi-Puttini P, et al. COVID-19, cytokines and immunosuppression: what can we learn from severe acute respiratory syndrome? Clin Exp Rheumatol. 2020;38(2):337–342. - PubMed

Publication types

MeSH terms