. 2020 Jul 20;16(7):e1008050.
doi: 10.1371/journal.pcbi.1008050. eCollection 2020 Jul.

Cross-species regulatory sequence activity prediction

Affiliations

Cross-species regulatory sequence activity prediction

David R Kelley. PLoS Comput Biol. .

Abstract

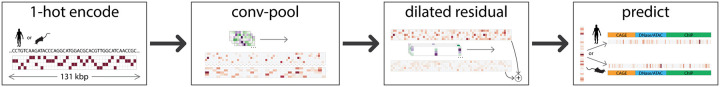
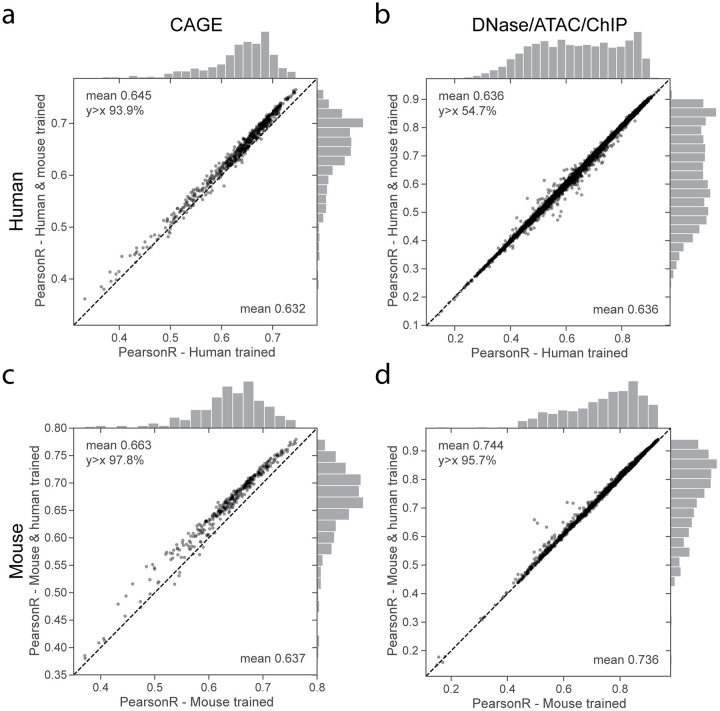
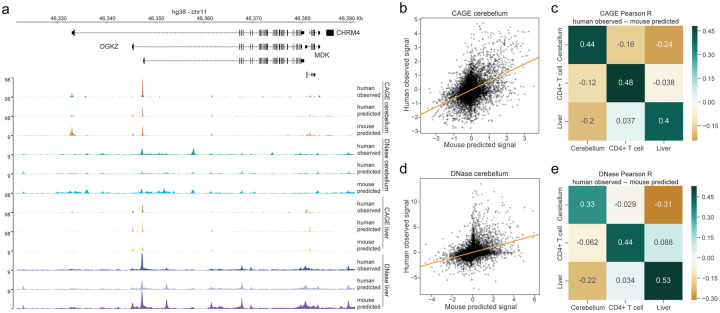
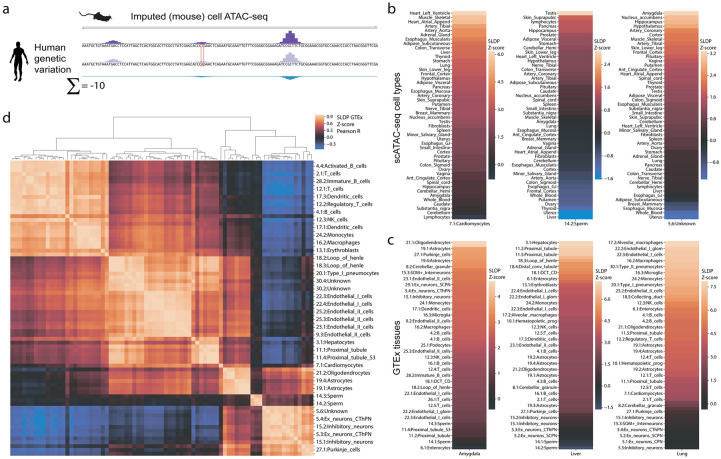
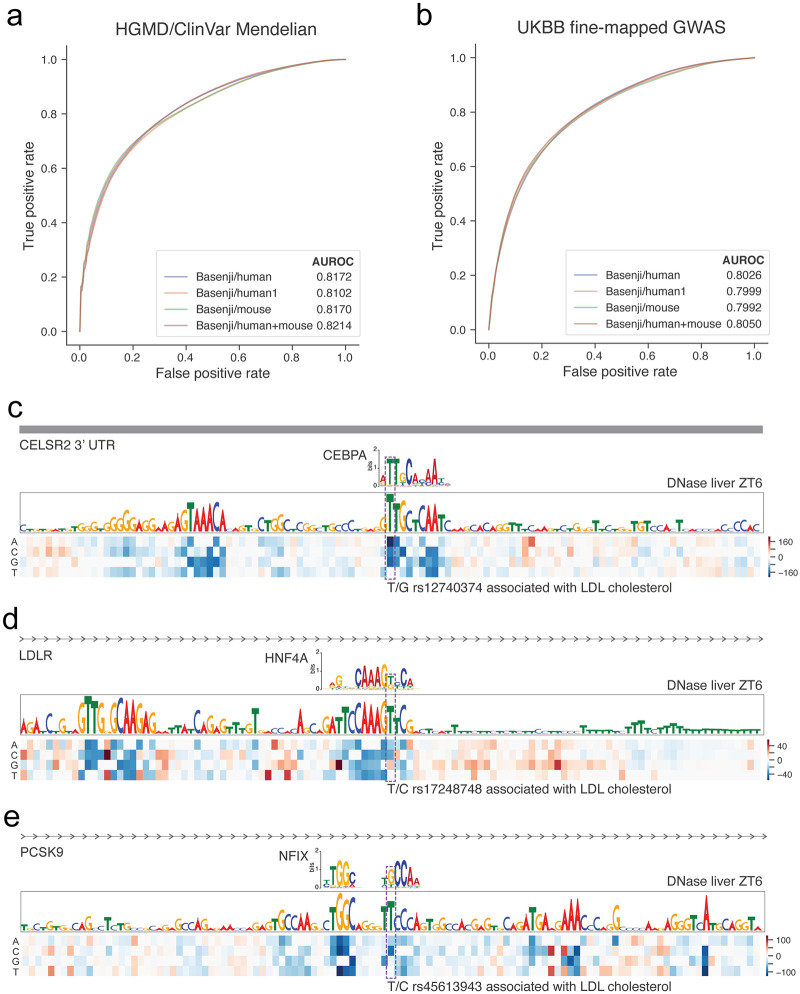
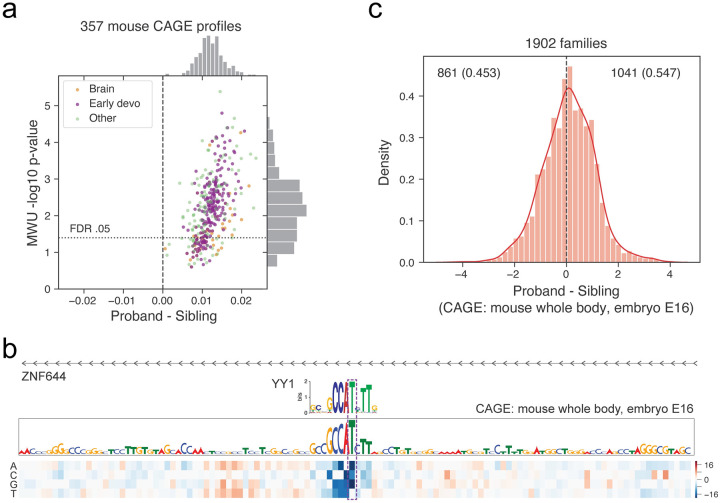
Machine learning algorithms trained to predict the regulatory activity of nucleic acid sequences have revealed principles of gene regulation and guided genetic variation analysis. While the human genome has been extensively annotated and studied, model organisms have been less explored. Model organism genomes offer both additional training sequences and unique annotations describing tissue and cell states unavailable in humans. Here, we develop a strategy to train deep convolutional neural networks simultaneously on multiple genomes and apply it to learn sequence predictors for large compendia of human and mouse data. Training on both genomes improves gene expression prediction accuracy on held out and variant sequences. We further demonstrate a novel and powerful approach to apply mouse regulatory models to analyze human genetic variants associated with molecular phenotypes and disease. Together these techniques unleash thousands of non-human epigenetic and transcriptional profiles toward more effective investigation of how gene regulation affects human disease.


Conflict of interest statement

DRK is employed by Calico LLC.

Figures

Fig 1
Fig 1. Predicting regulatory sequence activity for human and mouse genomes.
We predict the regulatory activity of DNA sequences for multiple genomes in several stages (Methods). The model takes in 131,072 bp DNA sequences, encoded as a binary matrix of four rows representing the four nucleotides. We transform this representation with seven iterated blocks of convolution and max pooling adjacent positions to summarize the sequence information in 128 bp windows. Green and purple heatmaps represent convolution filter weights; red and white heatmaps represent pooled sequence vectors. To share information across the long sequence, we apply eleven dilated residual blocks, consisting of a dilated convolution with exponentially increasing dilation rate followed by addition back into the input representation. Finally, we apply a linear transform to predict thousands of regulatory activity signal tracks for either human or mouse. All parameters are shared between species except for the final layer.
Fig 2
Fig 2. Training on human and mouse data improves generalization accuracy.
We trained three separate models with the same architecture on human data alone, mouse data alone, and both human and mouse data jointly. For each model, we computed the Pearson correlation of test set predictions and observed experimental data for thousands of datasets from various experiment types. Points in the scatter plots represent individual datasets, with single genome training accuracy on the x-axis and joint training accuracy on the y-axis. For CAGE, training on multiple genomes increases test set accuracy on nearly all datasets for both (a) human and (c) mouse. (b,d) For DNase/ATAC/ChIP-seq, test set accuracy improves by a smaller average margin. See S3 Fig for additional splits by assay and ChIP immunoprecipitation target.
Fig 3
Fig 3. Regulatory grammars are largely conserved across species.
(a) Tissue-specific regulatory grammars can be learned and transferred across species, exemplified here by CAGE and DNase data and predictions for cerebellum and liver. The “human predicted” tracks describe predictions for the human datasets displayed as “human observed”; “mouse predicted” tracks describe predictions for the matched mouse dataset. We scaled coverage tracks by their genome-wide means separately within all CAGE and all DNase/ATAC data. (b,d) Mouse predictions for cerebellum CAGE and DNase correlate strongly with human data. For CAGE, points represent the top 50% most variable TSSs. Data or predictions were quantile normalized to align sample distributions, log transformed, and mean-normalized across samples. For DNase, points represent the top 10% most variable genomic sites (less than CAGE because we consider the whole genome rather than TSSs). Data or predictions were similarly quantile normalized to align sample distributions and mean-normalized across samples. The statistical trends were robust to top variable threshold choice. Scatter plot lines represent ordinary least squares regressions. (c,e) These correlations are specific to the matched tissues and not shared by others.
Fig 4
Fig 4. Mouse cell type accessibility predictions show a strong and specific statistical relationship with human eQTLs.
(a) We predicted the effect of human genetic variants on imputed regulatory signal trained on mouse single cell ATAC-seq (scATAC) cluster profiles. We scored variants by subtracting the signal from the minor allele from that of the major and summing across the sequence. (b) We used signed linkage disequilibrium profile (SLDP) regression to compare the cell type-specific variant effect predictions to tissue-specific eQTL summary statistics from GTEx. Cell type profiles correspond best with the expected tissues. (c) GTEx tissues correspond best with the expected cell types. (d) Clustering scATAC cell types by their Z-scores across GTEx tissues reveals the expected structure.
Fig 5
Fig 5. Multi-species predictions improve variant pathogenicity classification.
(a) The line plots display ROC curves derived from classifiers trained to predict 660 validated noncoding pathogenic variants curated from the HGMD and ClinVar databases from a negative set chosen to control for nucleotide composition and genomic region. “Basenji/human1” uses variant features produced by a model trained on human only, while all other versions use a model trained jointly on both human and mouse. Using this jointly trained model, “Basenji/human”, “Basenji/mouse”, and “Basenji/human+mouse” produce variant features from predictions for human datasets, mouse datasets, and both human and mouse datasets respectively. For each feature set, we trained random forest classifiers in 200 iterations of eight fold cross validation. (b) We performed an analogous exercise using a set of 1524 variants fine-mapped to have high causal probability > 0.95 for complex traits in the UK BioBank relative to variants with fine-mapped causal probability 0.001 − 0.01. Below, we display three example variants causally implicated to affect LDL cholesterol levels that have large Basenji scores for DNase-seq over a 24 hour time course in mouse liver. (c) rs12740374 creates a CEBPA binding motif in the 3’ UTR of CELSR2, and has been experimentally validated to increased liver expression of SORT1 to alter plasma LDL [35]. (d) rs17248748 creates an HNF4A binding motif in in the first intron 6 kb from the TSS of low-density lipoprotein receptor LDLR. (e) rs45613943 breaks an NFI family binding motif in an intron 13 kb downstream of the TSS of PCKS9. Coding mutations in LDLR and PCKS9 have been extensively studied in Mendelian hypercholesterolemia.
Fig 6
Fig 6. Human de novo variant predictions for mouse data enrich for autism probands versus their siblings.
(a) We predicted the influence of 234k de novo variants split between probands and sibling controls on 357 CAGE datasets in mouse. For each dataset, we computed a Mann-Whitney U (MWU) test between proband and sibling sets and corrected for multiple hypotheses using the Benjamini-Hochberg procedure. Predictions for many datasets were enriched for greater values in the probands, driven largely by early developmental profiles. Each dataset’s x-axis position is the mean natural log over proband variants minus the equivalent over control variants. (b) A proband variant at chr1:91021795 modifies a critical T in a YY1 motif to an A in the promoter region of ZNF644. (c) At the individual level, a simple score summing variant predictions for a leading developmental dataset describing mouse CAGE whole body at embryonic stage E16 significantly separates probands from their matched sibling controls (binomial test p-value 2 × 10⁻⁵).

References

    1. Ghandi M, Lee D, Mohammad-Noori M, Beer MA. Enhanced regulatory sequence prediction using gapped k-mer features. PLoS Comput Biol. 2014;10(7):e1003711 10.1371/journal.pcbi.1003711 - DOI - PMC - PubMed
    1. Alipanahi B, Delong A, Weirauch MT, Frey BJ. Predicting the sequence specificities of DNA- and RNA-binding proteins by deep learning. Nature Biotechnology. 2015;33:831–838. 10.1038/nbt.3300 - DOI - PubMed
    1. Lee D, Gorkin DU, Baker M, Strober BJ, Asoni AL, McCallion AS, et al. A method to predict the impact of regulatory variants from DNA sequence. Nature Genetics. 2015;47:955–961. 10.1038/ng.3331 - DOI - PMC - PubMed
    1. Kelley DR, Snoek J, Rinn JL. Basset: learning the regulatory code of the accessible genome with deep convolutional neural networks. Genome research. 2016;26(7):990–999. 10.1101/gr.200535.115 - DOI - PMC - PubMed
    1. Kelley DR, Reshef YA, Bileschi M, Belanger D, McLean CY, Snoek J. Sequential regulatory activity prediction across chromosomes with convolutional neural networks. Genome Research. 2018;28(5):739–750. 10.1101/gr.227819.117 - DOI - PMC - PubMed