

Levels of self-reported and objective physical activity in individuals with age-related macular degeneration
- PMID: 32689987
- PMCID: PMC7372878
- DOI: 10.1186/s12889-020-09255-7
Levels of self-reported and objective physical activity in individuals with age-related macular degeneration
Abstract
Background: Self-report in people with age-related macular degeneration (AMD) shows that they lead less active lifestyles. Physical activity is important as it has been shown to improve quality of life, reduce co-morbidity and also slow down the progression of AMD. Self-reported measures of physical activity are prone to subjective biases and therefore less accurate in quantifying physical activity. This study compared self-reported and objective (accelerometer-based) physical activity levels and patterns in older adults with AMD.
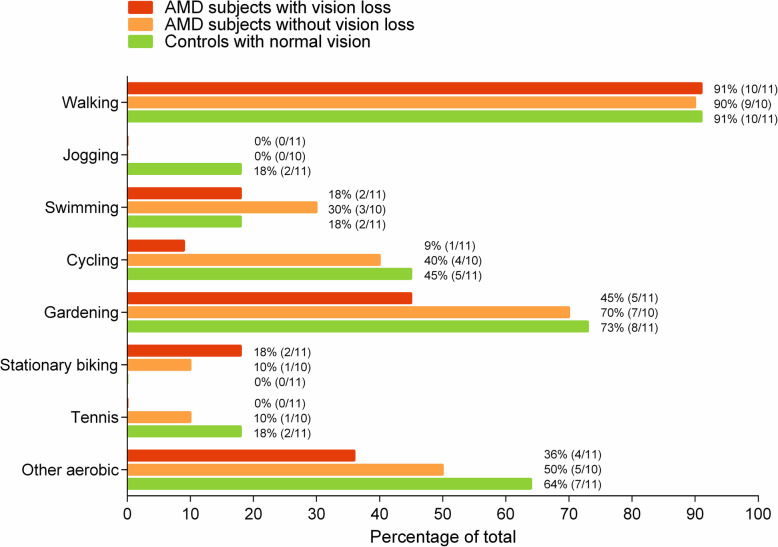
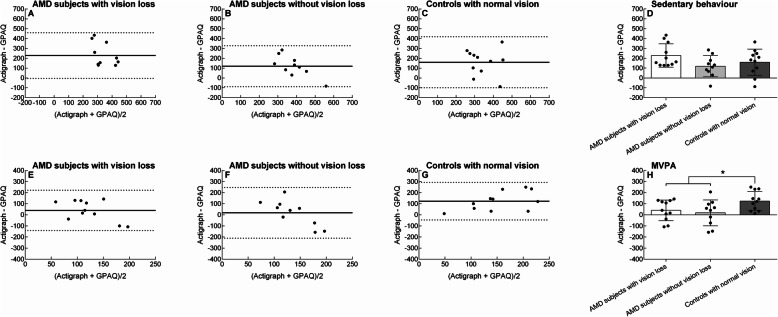
Methods: Data were collected in 11 AMD subjects with binocular vision loss (aged 76 ± 7 years), 10 AMD subjects with good binocular vision (aged 76 ± 7 years), and 11 controls (aged 70 ± 4 years). Binocular vision was established using visual acuity score. Contrast sensitivity and visual fields were also measured. Self-reported sedentary behaviour and moderate-to-vigorous physical activity (MVPA) was assessed using the Global Physical Activity Questionnaire. Objective measurements were obtained with an Actigraph GT3X accelerometer being worn for seven consecutive days on the hip. The objective physical activity measures were sedentary behaviour, light physical activity, MVPA, and step count.
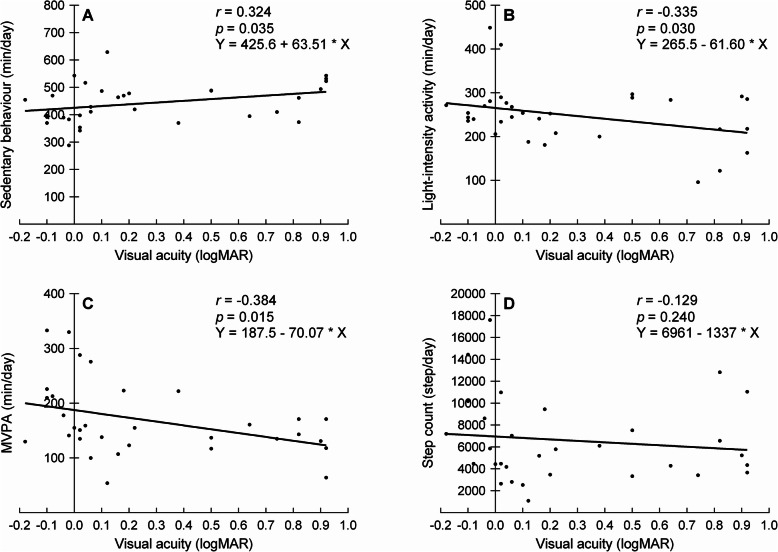
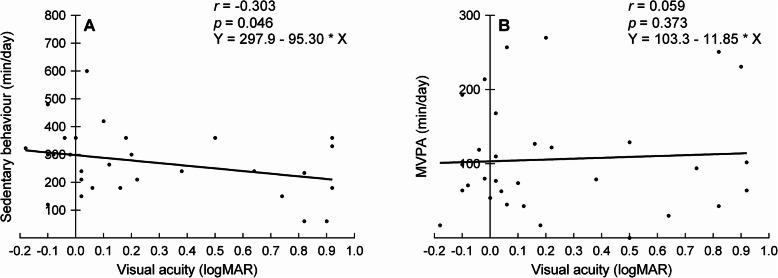
Results: Objectively measured MVPA was 33-34% higher for controls compared to both AMD groups (p < 0.05). There were no group differences for any of the other objectively measured physical activity variables and self-reported physical activity variables were also not significantly different (all p > 0.05). Comparing the objective with the self-report physical activity measure showed that all groups under-reported their sedentary behaviour and MVPA, but controls under-reported their MVPA more than both AMD groups (p < 0.05). Weak to moderate correlations were observed between the severity of vision loss and objective physical activity measures (all - 0.413 ≥ r ≤ 0.443), while correlations for self-reported physical activity measures were less strong (all - 0.303 ≥ r ≤ 0.114).
Conclusions: People with AMD, irrespective of whether they were vision impaired, were better able to estimate the time spent in MVPA compared to controls. However, objectively measured MVPA, was higher in controls than AMD subjects. Although clinicians may use self-report to monitor the compliance of AMD subjects with any prescribed exercise programs, they should be aware that a valid comparison with healthy controls can only be made when MVPA is objectively measured.
Keywords: Accelerometer; Exercise; GPAQ; Older adults; Physical activity; Sedentary behaviour; Vision loss; Visual impairment.
Conflict of interest statement
The authors declare that they have no competing interests.
Figures
References
-
- Capella-McDonnall M. The need for health promotion for adults who are visually impaired. Journal of Visual Impairment & Blindness. 2007;101(3):133–145. doi: 10.1177/0145482X0710100302. - DOI
-
- Economics A. Future sight loss UK 1: the economic impact of partial sight and blindness in the UK adult population. London: RNIB; 2009.
MeSH terms
Supplementary concepts
Grants and funding
LinkOut - more resources
Full Text Sources
Medical
