. 2020 Jul 21:9:e54066.
doi: 10.7554/eLife.54066.

Tracking cells in epithelial acini by light sheet microscopy reveals proximity effects in breast cancer initiation

Affiliations

Tracking cells in epithelial acini by light sheet microscopy reveals proximity effects in breast cancer initiation

Ashna Alladin et al. Elife. .

Abstract

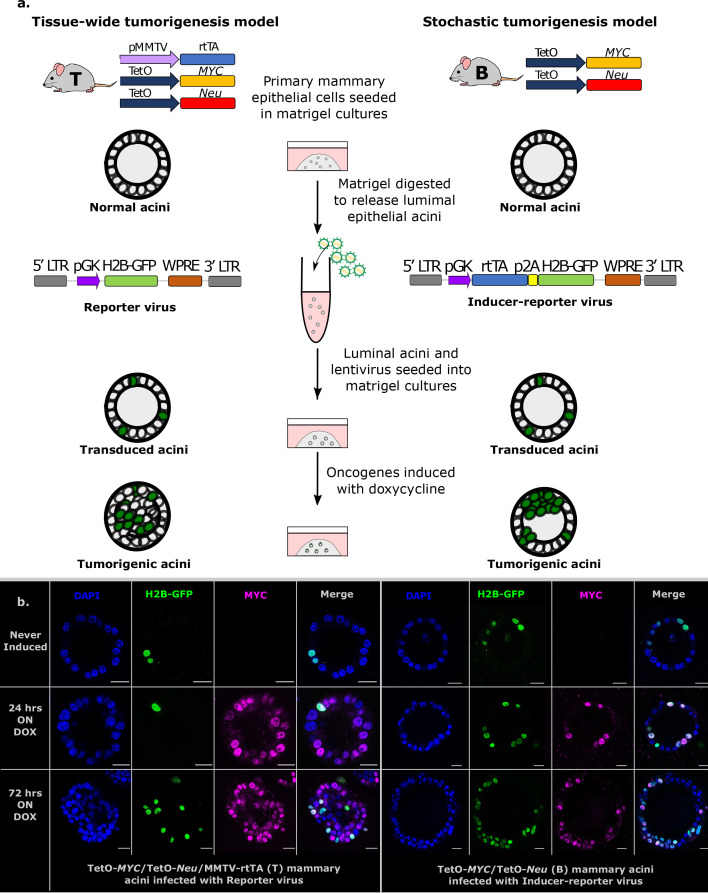
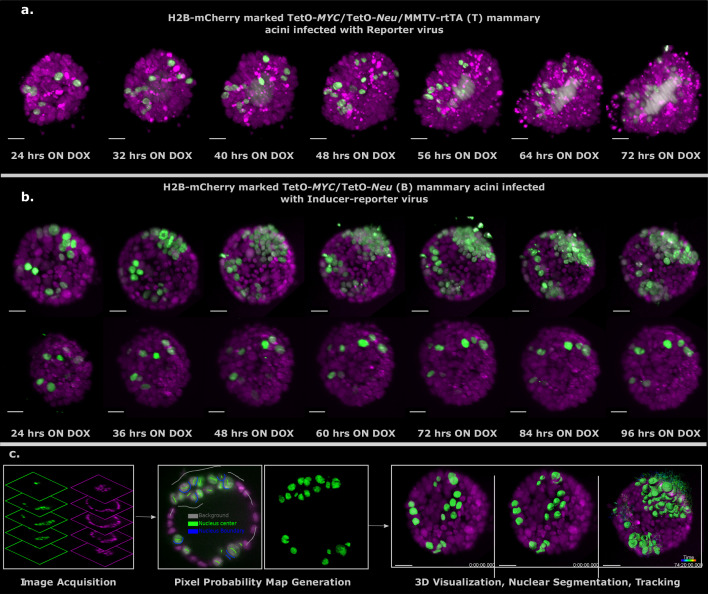
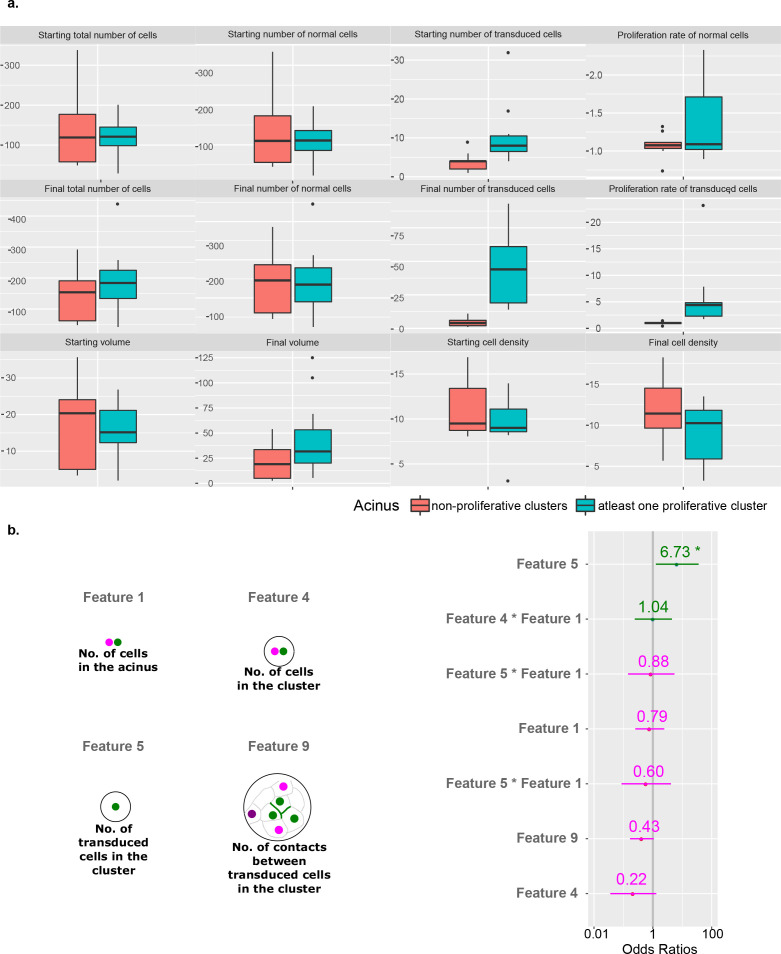
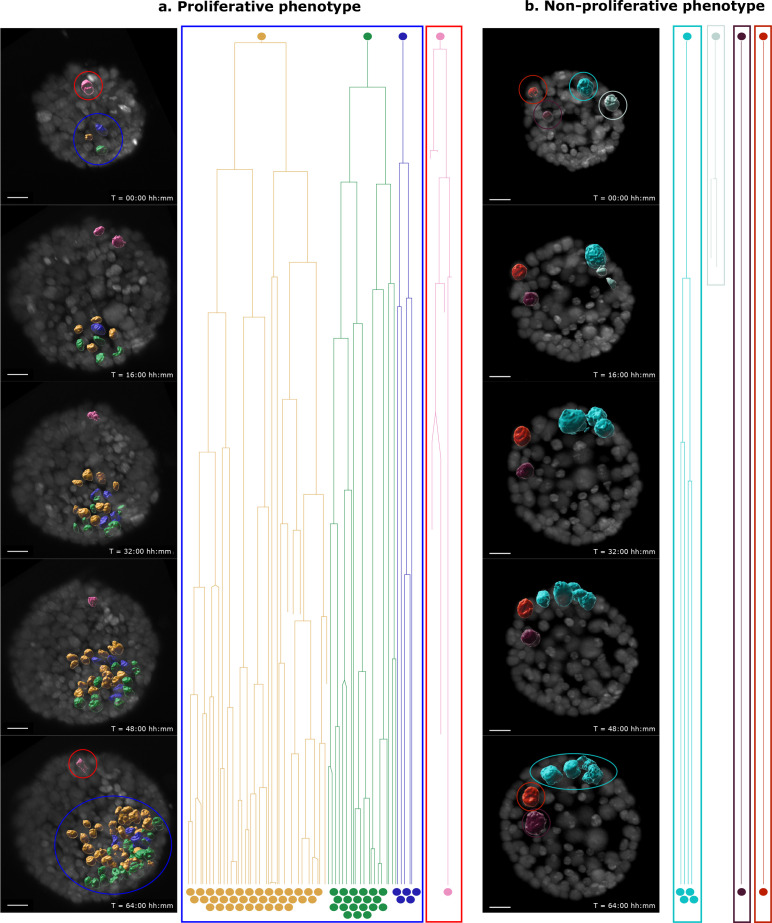
Cancer clone evolution takes place within tissue ecosystem habitats. But, how exactly tumors arise from a few malignant cells within an intact epithelium is a central, yet unanswered question. This is mainly due to the inaccessibility of this process to longitudinal imaging together with a lack of systems that model the progression of a fraction of transformed cells within a tissue. Here, we developed a new methodology based on primary mouse mammary epithelial acini, where oncogenes can be switched on in single cells within an otherwise normal epithelial cell layer. We combine this stochastic breast tumor induction model with inverted light-sheet imaging to study single-cell behavior for up to four days and analyze cell fates utilizing a newly developed image-data analysis workflow. The power of this integrated approach is illustrated by us finding that small local clusters of transformed cells form tumors while isolated transformed cells do not.

Keywords: cancer biology; cell biology; interaction requirements for tumor initiation; light sheet imaging technology; mouse; organoid technology of primary mammary epithelium; scalable big image data analysis pipeline; tractable tumor induction system.

Plain language summary

There are now drugs to treat many types of cancer, but questions still remain around how these diseases start in the first place. Researchers think that tumor growth begins when a single cell suffers damage to certain sites in its DNA that eventually cause it to divide uncontrollably. That damaged cell, and its descendants, go on to form a lump, or tumor. The trouble with proving this theory is that it is hard to watch it happening in real time. Doctors usually only meet people with cancer when their tumors start to cause health problems. By this point, the tumors contain millions of cells. A way to watch the very beginnings of a cancer could reveal risk factors within a tissue that foster the growth of a tumor. But first, researchers need to test their theory about how the disease begins in the first place. One way to do this is to surround a single cancer cell with healthy cells and watch what happens next. To do this, Alladin, Chaible et al. took healthy cells from the breast tissue of mice and grew them in the laboratory into mini-organs called organoids. These organoids share a lot of features with actual mouse breast tissue; they can even make milk if given the right hormones. Once the organoids were ready, Alladin, Chaible et al then started modifying a small number of single cells inside them by switching on genes called oncogenes, which are known to drive cancer formation in humans. Using fluorescent proteins and a sheet of laser light it was possible to watch what happened to the cells over time. This revealed that, even though all the oncogene-driven single cells received the same signals, not all of them started to divide uncontrollably. In fact, a single modified cell had a low chance of forming a tumor on its own. The more oncogene-driven cells there were near to each other, the more likely they were to form tumors. Alladin, Chaible et al. think that this is because the healthy tissue interacts with the modified, oncogene-driven cells to suppress tumor formation. It is only when a larger number of modified cells group together and start to communicate with each other that they can override the inhibitory messages of the healthy tissue. How healthy tissue stops single modified cells from forming tumors is not yet clear. But, with this new mini-organ system, researchers now have the tools to investigate. In the future, this could lead to new strategies to stop cancer before it has a chance to get started.


Conflict of interest statement

AA, LC, LG, RS, JH, CT, MJ No competing interests declared, ML Monika Loeschinger is employed by Luxendo GmbH, FM BU, Bruker Nano Surfaces, Heidelberg, Germany, the manufacturer of the InVi SPIM light-sheet microscope, MW Malte Wachsmuth is employed by Luxendo GmbH, FM BU, Bruker Nano Surfaces, Heidelberg, Germany, the manufacturer of the InVi SPIM light-sheet microscope

Figures

Figure 1.
Figure 1.. Establishment of stochastic tumorigenesis in mammary acini.
(a) Schematic representation of the mouse models and the in vitro culture methods used. Acini are grown from single cells harvested from the mammary glands of either bi-trangenic (B) or tri-trangenic (T) mice, transduced with lentiviral particles in solution and re-seeded into 3D cultures. Doxycycline is added to the medium to induce the expression of oncogenes in cells expressing rtTA. B mice have the MYC and Neu oncogene constructs in their genome. These oncogenes are activated in single cells infected with the Inducer-reporter (pLenti-rtTA-GFP) lentiviral particles in the presence of doxycycline, modeling stochastic breast tumorigenesis (right panel). T mice have the rtTA transducer construct along with the oncogenes and all cells in T acini can be induced to express oncogenes in 3D culture in the presence of doxycycline. T mice infected with Reporter (pLenti-NULL-GFP) lentiviral particles are used as infection controls (left panel). Both viral particles mark single cells in the acini with H2B-GFP. (b) Representative immunofluorescence staining images of fixed 3D gels with B acini transduced with Inducer-reporter virus or T acini transduced with Reporter virus before induction (top), 24 hr post induction and (middle) and 72 hr post induction (bottom) with doxycycline. GFP expressing transduced cells (green), MYC oncoprotein (magenta), DAPI nuclear stain (blue). Scale bar, 10 µm.
Figure 1—figure supplement 1.
Figure 1—figure supplement 1.. Normalization of doxycycline concentration for the stochastic model using qPCR analysis.
Fold changes in the mRNA expression of transgenes, MYC and Neu, in transduced mammary epithelial cells of B mice (n = 2) infected with Inducer-reporter virus or T mice (n = 2) with Reporter virus. The doxycycline dosage of 800 ng/ml (T800) is well established in the T cells and was used as control to normalize the gene expression, and to determine the dose for transduced B cells (600 ng/ml). Data represented as mean ± SEM; *p<0.05.
Figure 2.
Figure 2.. Characterization of stochastic tumorigenesis in mammary acini.
(a) Representative immunofluorescence staining images of fixed 3D gels with T acini transduced with Reporter virus (left panels) and B acini transduced with Inducer-reporter virus (right panels), before induction and 96 hr post induction with doxycycline. Polarity markers include alpha-6-Integrin (magenta) and ZO-1 (yellow). Transduced cells are marked with GFP (green) and nucleus is counterstained with DAPI (blue). Scale bar, 20 µm.(b) Representative immunofluorescence staining images of fixed 3D gels with B acini transduced with Inducer-reporter virus before induction (top panels) and 96 hr post induction (middle and bottom panels) with doxycycline. GFP expressing transduced cells (green), MYC oncoprotein (magenta), DAPI nuclear stain (blue). Scale bar, 50 µm.
Figure 3.
Figure 3.. Light sheet imaging of stochastic tumorigenesis in mammary acini 3D images of selected timepoints during live-cell time-lapse microscopy of induced T acini transduced with Reporter virus.
(a) or B acini transduced with Inducer-reporter virus (b). All cells in the acini express H2B-mCherry (magenta) and only cells transduced with lentiviral particles express H2B-GFP (green). Imaging was started 24 hr after oncogenic induction with doxycycline. In (b) the upper panel shows the proliferative phenotype seen with stochastic transformation, whereas the lower panel shows the non-proliferative phenotype observed in some stochastically transformed acini. (Imaging conditions: H2B-mCherry 594 nm Ex, 610 LP Em; H2B-GFP 488 nm Ex and 497–554 nm Em). Scale bar, 20 µm. (c) Schematic representation of the big-image data analysis pipeline developed to analyze the light sheet microscopy images. Images are acquired in two channels (H2B-mCherry in magenta and H2B-GFP in green) at 10 min intervals for 3–4 days. Big Data Processor Fiji plugin is used to pre-process the raw images and CATS Fiji plugin is used for generation of pixel probability maps (Figure 3—figure supplement 2). Image pixels of the H2B-GFP images are classified into background (black), nucleus center (green), nucleus boundary (blue) classes by manual training. Processed raw images along with the probability maps from the nucleus center channel (green) are exported to Imaris for 3D visualization, nuclear segmentation and single-cell tracking.
Figure 3—figure supplement 1.
Figure 3—figure supplement 1.. Sample holder preparation and sample mounting.
The FEP membrane is glued onto the sample holder (a) with the help of a mold and biocompatible glue (b). Gel slivers are transferred to the FEP sheet trough in the sample holder (c) and overlaetO-Neu (B). Reporter H2B-mCherry was crossed into the B and T lines using a R26-H2B-mCherry line (Abe and Fujimori, 2013) (RIKEN, CDB0239K). All ten mammary glands were harvested (from virgin female mice between 8 and 10 weeks old), digested and singularized for establishing acinar cultures. All mice used in this study were housed according to the guidelines of the Federation of European Laboratory Animal Science Associations (FELASA). .
Figure 3—figure supplement 2.
Figure 3—figure supplement 2.. Image pre-processing and pixel probability generation using Fiji plugins.
(a) The Big Data Processor Fiji plugin was employed for pre-processing light-sheet microscopy images. Two-channel raw images were lazily loaded in 2D slice mode for visual inspection. Channel shift correction was performed to align the two channels. Then, the whole dataset was cropped in x,y,z to remove black pixels and empty planes. The cropped dataset was then saved in an 8-bit Imaris format with 3 × 3 binning applied in x and y. (b) The CATS Fiji plug-in was used to generate pixel probability maps for H2B-GFP images. Left panel shows the manual training done by drawing labels on the dataset to classify pixels into 3 classes: background (grey), nucleus boundary (red) and nucleus center (green). The right panel shows the pixel probability output for all three classes overlaid on the intensity data. Only the pixel probabilities from the nucleus center class were exported from CATS and linked to the Imaris dataset for further segmentation and tracking on Imaris.
Figure 3—figure supplement 3.
Figure 3—figure supplement 3.. Cell segmentation accuracy Image panels show the H2B-mCherry signal (magenta) along with the segmented H2B-GFP cells of an acinus at four equidistant timepoints.
Segmentation accuracy was assessed, counting: True Positives (correctly segmented cells, highlighted in green), False Merges (two cells merged as one, highlighted in orange), and False Splits (one cell split in two, highlighted in purple). Unidentified cells are indicated as False Negatives and Ground Truth indicates the actual number of cells at each timepoint. The average True Positive to Ground Truth ratio for the four timepoints is 0.92. Scale bar, 20 μm.
Figure 4.
Figure 4.. Proximity of transformed cells in a normal epithelium enhances tumor proliferation and establishment.
(a) Single-cell tracking results for every cell in a representative B acinus transduced with the Inducer-reporter virus. Top panel shows the acinus at the beginning of the time-lapse (24 hr post induction) with each transduced cell surface rendered with Imaris. The middle panel shows the lineage trees of each individual cell over the time-lapse recording. Lineage trees of single cells are grouped into proliferative (highlighted in red, orange) and non-proliferative (highlighted in blue) cell clusters. The bottom panel shows the acinus at the end of the time-lapse (~76 hr post induction with doxycycline). Color coding of each cell maintained in all panels. Scale bar, 15 µm. (b) Schematic representation of the 9 features of stochastically transformed cells extracted at the beginning of time-lapse imaging. These features were assessed for their impact on tumor cell proliferation within B acini transduced with the Inducer-reporter virus using logistic regression. Lower right panel: Coefficients (represented as odds ratios) of the three features included in the best logistic regression model, colored horizontal bars represent the 95% confidence interval of the estimate. ** indicates p-value (of having no effect)<0.01, * indicates p-value<0.05. The vertical grey line indicates the position of no effect. (c) Representative B mammary acini stochastically transduced with the Inducer-reporter virus and induced with doxycycline. Left panels show acini 24 hr post induction. Color highlights indicate clusters of transduced cells identified from hierarchical clustering (shown in middle panels) with proliferative clusters highlighted in orange and non-proliferative clusters highlighted in blue. Right panels show the same acini ~ 72–76 hr post induction. Scale bar, 20 µm.
Figure 4—figure supplement 1.
Figure 4—figure supplement 1.. Acini feature analysis to exclude acinus-specific effects on proliferation of transduced cell clusters.
(a) Comparison of acinus level features including numbers of cells (all, transduced and normal cells), cell proliferation rate (transduced and normal cells), acinus volume and acinus cell density for B acini grouped by the presence (blue) of at least one proliferative cluster or non-proliferative clusters (orange). (b) Mixed model regression analysis to identify features linked to tumorigenic outcome (using an Odds Ratio), including the three most important fixed effect features (Feature 5, 4 and 9) with random effect for each acinus and interaction terms for the Feature 1 (comparable to acinus size).
Figure 4—figure supplement 2.
Figure 4—figure supplement 2.. Proliferative and non-proliferative cell clusters can be found within the same B acinus.
Single-cell tracking results are presented for every cell in representative B acini transduced with the Induced-reporter virus starting at 24 hr post doxycycline induction. (a) Acinus with differential outcome for 2 cell clusters – one with a single transduced cell (red) and the other with 3 transduced cells (blue). The cluster containing 3 cells shows heightened cell proliferation and establishment of a multi-layered neoplastic region, while the single cell fails to substantially expand. This demonstrates differential outgrowth of clusters within the same acinus, similar to the example shown in Figure 3a. (b) Acinus with a non-proliferative phenotype is similar in size to (a) and has 4 single cell clusters. None of these clusters show heightened proliferation of transduced cells, but either display normal cell division rates over 64 hr (turquoise), no proliferation at all (red, purple) or inability to survive following a division (grey). (a,b) Images show selected timepoints (0, 16, 32, 48 and 64 hr) of the time-lapse recording. Each transduced cell surface is rendered with Imaris and color coded according to the lineage. Lineage trees of single cells are grouped into proliferative and non-proliferative cell clusters. Color coding is maintained in all panels. Scale bar, 15 μm.

Similar articles

Cited by

References

    1. Abe T, Fujimori T. Reporter mouse lines for fluorescence imaging. Development, Growth & Differentiation. 2013;55:390–405. doi: 10.1111/dgd.12062. - DOI - PubMed
    1. Al-Kuraya K, Schraml P, Torhorst J, Tapia C, Zaharieva B, Novotny H, Spichtin H, Maurer R, Mirlacher M, Köchli O, Zuber M, Dieterich H, Mross F, Wilber K, Simon R, Sauter G. Prognostic relevance of gene amplifications and coamplifications in breast Cancer. Cancer Research. 2004;64:8534–8540. doi: 10.1158/0008-5472.CAN-04-1945. - DOI - PubMed
    1. Arteaga CL, Sliwkowski MX, Osborne CK, Perez EA, Puglisi F, Gianni L. Treatment of HER2-positive breast Cancer: current status and future perspectives. Nature Reviews Clinical Oncology. 2012;9:16–32. doi: 10.1038/nrclinonc.2011.177. - DOI - PubMed
    1. Binnewies M, Roberts EW, Kersten K, Chan V, Fearon DF, Merad M, Coussens LM, Gabrilovich DI, Ostrand-Rosenberg S, Hedrick CC, Vonderheide RH, Pittet MJ, Jain RK, Zou W, Howcroft TK, Woodhouse EC, Weinberg RA, Krummel MF. Understanding the tumor immune microenvironment (TIME) for effective therapy. Nature Medicine. 2018;24:541–550. doi: 10.1038/s41591-018-0014-x. - DOI - PMC - PubMed
    1. Bitplane AG 3/4D Image Visualization and Analysis Software. v. x64Imaris. 2020 http://bitplane.com