. 2020 Oct;10(10):1489-1499.
doi: 10.1158/2159-8290.CD-19-1366. Epub 2020 Jul 20.

Immune Surveillance in Clinical Regression of Preinvasive Squamous Cell Lung Cancer

Affiliations

Immune Surveillance in Clinical Regression of Preinvasive Squamous Cell Lung Cancer

Adam Pennycuick et al. Cancer Discov. 2020 Oct.

Abstract

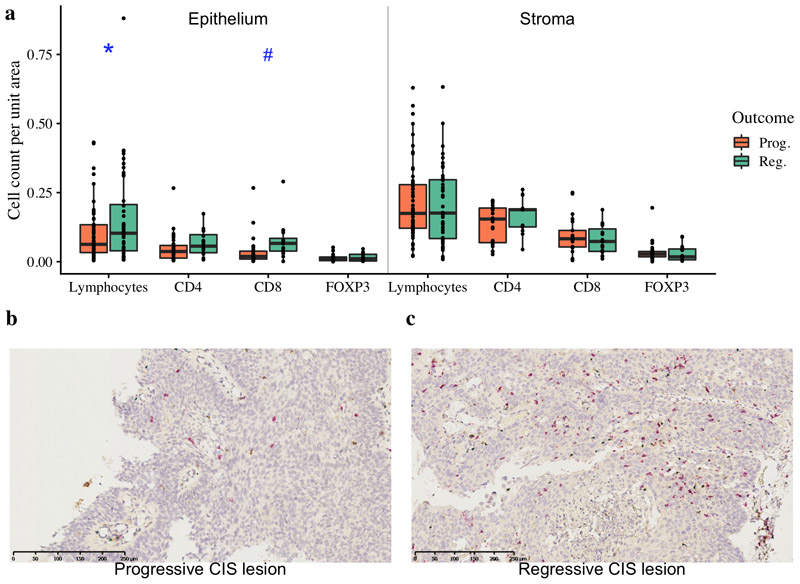
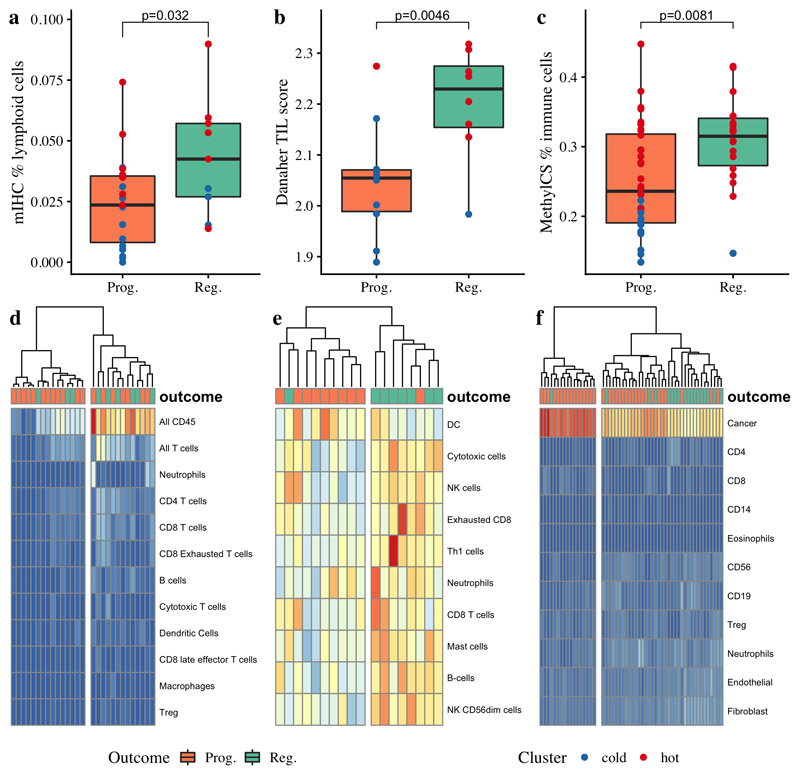
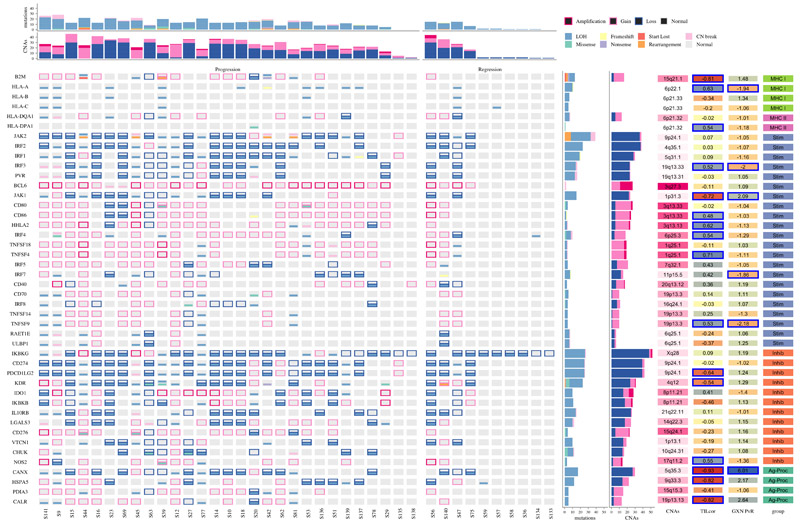
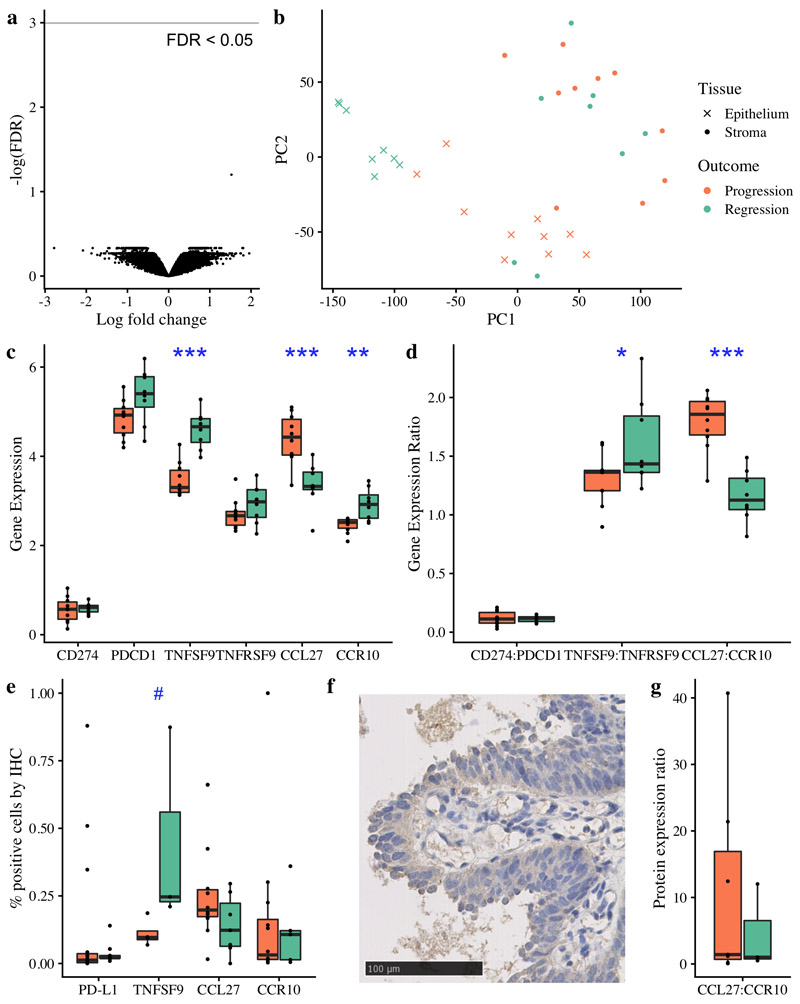
Before squamous cell lung cancer develops, precancerous lesions can be found in the airways. From longitudinal monitoring, we know that only half of such lesions become cancer, whereas a third spontaneously regress. Although recent studies have described the presence of an active immune response in high-grade lesions, the mechanisms underpinning clinical regression of precancerous lesions remain unknown. Here, we show that host immune surveillance is strongly implicated in lesion regression. Using bronchoscopic biopsies from human subjects, we find that regressive carcinoma in situ lesions harbor more infiltrating immune cells than those that progress to cancer. Moreover, molecular profiling of these lesions identifies potential immune escape mechanisms specifically in those that progress to cancer: antigen presentation is impaired by genomic and epigenetic changes, CCL27-CCR10 signaling is upregulated, and the immunomodulator TNFSF9 is downregulated. Changes appear intrinsic to the carcinoma in situ lesions, as the adjacent stroma of progressive and regressive lesions are transcriptomically similar. SIGNIFICANCE: Immune evasion is a hallmark of cancer. For the first time, this study identifies mechanisms by which precancerous lesions evade immune detection during the earliest stages of carcinogenesis and forms a basis for new therapeutic strategies that treat or prevent early-stage lung cancer.See related commentary by Krysan et al., p. 1442.This article is highlighted in the In This Issue feature, p. 1426.


Conflict of interest statement

Conflict of Interest Statement

S.A.Q. and C.S. are co-founders of Achilles Therapeutics. C.S. is a shareholder of Apogen Biotechnologies, Epic Bioscience, GRAIL, and has stock options in Achilles Therapeutics. R.R. and N.M. have stock options in and have consulted for Achilles Therapeutics. L.M.C. is a paid consultant for Cell Signaling Technologies, received reagent and/or research support from Plexxikon Inc., Pharmacyclics, Inc., Acerta Pharma, LLC, Deciphera Pharmaceuticals, LLC, Genentech, Inc., Roche Glycart AG, Syndax Pharmaceuticals Inc., Innate Pharma, and NanoString Technologies, and is a member of the Scientific Advisory Boards of Syndax Pharmaceuticals, Carisma Therapeutics, Zymeworks, Inc, Verseau Therapeutics, Cytomix Therapeutics, Inc., and Kineta Inc.

Figures

Figure 1
Figure 1. Immune cell infiltration of lung carcinoma-in-situ lesions.
a) Combined quantitative immunohistochemistry data of CD4, CD8 and FOXP3 staining (n=44; 28 progressive, 16 regressive) with total lymphocyte quantification from H&E images (n=112; 68 progressive, 44 regressive) shown. We observe increased lymphocytes (p=0.049) and CD8+ cells (p=0.055) per unit area of epithelium within regressive CIS lesions compared to progressive. Stromal regions adjacent to CIS lesions showed no significant differences in immune cells between progressive and regressive lesions. p-values are calculated using linear mixed effects models to account for samples from the same patient; #p<0.1, *p<0.05. (b-c) Immunohistochemistry images of (b) progressive CIS lesion and (c) regressive CIS lesion with CD4+ T helper cells stained in brown, CD8+ cytotoxic T-cells in red and FOXP3+ T regulatory cells in blue. Immune cells are separately quantified within the CIS lesion and in the surrounding stroma.
Figure 2
Figure 2. Identification of immune ‘hot’ and ‘cold’ carcinoma in-situ lesions by immune cell clustering.
Regressive lesions harbored significantly more infiltrating lymphocytes as assessed by multiplex immunohistochemistry (a; p=0.032 comparing percentage of all nucleated cells identified as T-cells (CD45+CD3+) or B-cells (CD45+CD3-CD20+) between 19 progressive and 9 regressive lesions). This finding was corroborated by molecular data in partially overlapping datasets; regressive lesions had higher gene-expression derived Tumor Infiltrating Lymphocyte (TIL) scores (b; p=0.0046; n=10 progressive, 8 regressive) and a higher proportion of immune cells as estimated from methylation data using methylCIBERSORT (c; p=0.0081; n=36 progressive, 18 regressive). d) Immune cell quantification from IHC data (n=28) shows an ‘immune cold’ cluster (left) in which most lesions progressed to cancer, and an ‘immune hot’ cluster (right) in which the majority regressed. Similar clustering patterns are seen in deconvoluted gene expression data (e; n=18) and on methylation-derived cell subtypes using methylCIBERSORT (f; n=54). p-values are calculated using mixed effects models to account for samples from the same patient.
Figure 3
Figure 3. Genomic aberrations affecting immune genes in lung carcinoma in-situ lesions.
The mutational status is shown for 62 genes involved in the immune response, which are expressed by antigen presenting (tumor) cells. Genes are categorized as belonging to the Major Histocompatibility Complex (MHC) class I or II; stimulators (Stim) and inhibitors (Inhib) of the immune response, and genes involved in antigen processing (Ag-Proc). Mutations and copy number aberrations (CNAs) are shown for each of 29 progressive and 10 regressive samples. Loss of heterozygosity (LOH) events are shown as mutations to avoid confusion with copy number loss, relative to ploidy. The GXN PvR column displays the fold-change in expression of each gene between progressive and regressive samples, defined in a partially overlapping set of 18 samples. Significant genes, defined as False Discovery Rate < 0.05, are highlighted in blue. The TILcor column displays the Pearson’s correlation coefficient between the expression of each gene and the gene-expression based tumour infiltrating lymphocyte (TIL) score, derived by the Danaher method. Progressive samples had more mutations (p=0.028) and CNAs (p=0.0038) than regressive in this gene set. dN/dS analysis identified B2M, CHUK, KDR and CD80 as showing evidence of selection.
Figure 4
Figure 4. Immune escape mechanisms in CIS beyond antigen presentation.
(a) Volcano plot of gene expression differential analysis of laser-captured stroma comparing progressive (n=10) and regressive (n=8) CIS samples. No genes were significant with FDR < 0.05 following adjustment for multiple testing. (b) Principle component analysis plot of the same 18 CIS samples, showing laser-captured epithelium and matched stroma. (c-d) RNA analysis of immunomodulatory molecules and cytokine:receptor pairs in n=18 CIS samples identified TNFSF9 and CCL27:CCR10 as significantly differentially expressed between progressive and regressive samples (p=0.0000058 and p=0.0000019 respectively). (e) Immunohistochemistry showed that TNFSF9 was similarly differentially expressed at the protein level (p=0.057; n=7 with successful staining). (f) Illustrative immunohistochemistry staining for TNFSF9. CCL27 and CCR10 showed a similar trend at the protein level to the RNA level (e,g); whilst these data did not achieve a significance threshold (g; p=0.49 for CCL27:CCR10 ratio, n=10) we observe several outliers in the progressive group. Analysis of PD-L1 (encoded by CD274) and its receptor PD-1 (encoded by PDCD1) is included due to its relevance in clinical practice; again we do not achieve statistically significant results but do observe three marked outliers with PD-L1 expression >25%, all of which progressed to cancer. All p-values are calculated using linear mixed effects modeling to account for samples from the same patient; ***p < 0.001 **p < 0.01 *p<0.05 #p<0.1. Units for gene expression figures represent normalised microarray intensity values.

Comment in

References

    1. Nicholson AG, Perry LJ, Cury PM, Jackson P, McCormick CM, Corrin B, et al. Reproducibility of the WHO/IASLC grading system for pre-invasive squamous lesions of the bronchus: a study of inter-observer and intra-observer variation. Histopathology. 2001;38:202–8. - PubMed
    1. Mascaux C, Angelova M, Vasaturo A, Beane J, Hijazi K, Anthoine G, et al. Immune evasion before tumour invasion in early lung squamous carcinogenesis. Nature. 2019;571:570–5. - PubMed
    1. George PJ, Banerjee AK, Read CA, O’Sullivan C, Falzon M, Pezzella F, et al. Surveillance for the detection of early lung cancer in patients with bronchial dysplasia. Thorax. 2007;62:43–50. - PMC - PubMed
    1. Teixeira VH, Pipinikas CP, Pennycuick A, Lee-Six H, Chandrasekharan D, Beane J, et al. Deciphering the genomic, epigenomic, and transcriptomic landscapes of pre-invasive lung cancer lesions. Nat Med. 2019;25:517–25. - PMC - PubMed
    1. AbdulJabbar K. Geospatial immune variability illuminates differential evolution of lung adenocarcinoma. Nature Medicine (accepted for publication) 2020 - PMC - PubMed

Publication types

MeSH terms