. 2021 Mar;70(3):544-554.
doi: 10.1136/gutjnl-2019-319866. Epub 2020 Jul 20.

Image-based consensus molecular subtype (imCMS) classification of colorectal cancer using deep learning

Affiliations

Image-based consensus molecular subtype (imCMS) classification of colorectal cancer using deep learning

Korsuk Sirinukunwattana et al. Gut. 2021 Mar.

Abstract

Objective: Complex phenotypes captured on histological slides represent the biological processes at play in individual cancers, but the link to underlying molecular classification has not been clarified or systematised. In colorectal cancer (CRC), histological grading is a poor predictor of disease progression, and consensus molecular subtypes (CMSs) cannot be distinguished without gene expression profiling. We hypothesise that image analysis is a cost-effective tool to associate complex features of tissue organisation with molecular and outcome data and to resolve unclassifiable or heterogeneous cases. In this study, we present an image-based approach to predict CRC CMS from standard H&E sections using deep learning.

Design: Training and evaluation of a neural network were performed using a total of n=1206 tissue sections with comprehensive multi-omic data from three independent datasets (training on FOCUS trial, n=278 patients; test on rectal cancer biopsies, GRAMPIAN cohort, n=144 patients; and The Cancer Genome Atlas (TCGA), n=430 patients). Ground truth CMS calls were ascertained by matching random forest and single sample predictions from CMS classifier.

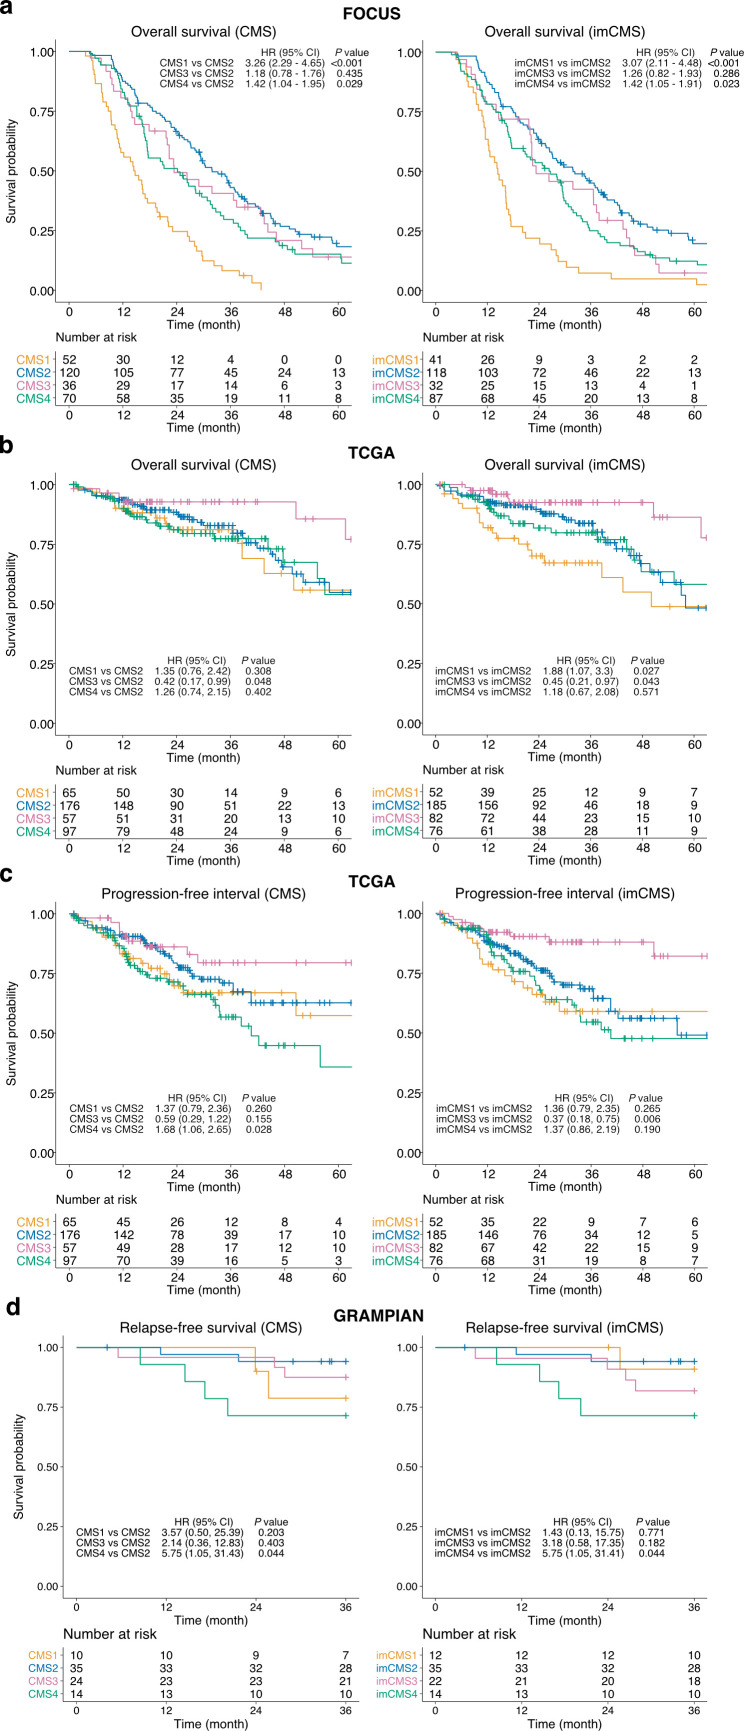
Results: Image-based CMS (imCMS) accurately classified slides in unseen datasets from TCGA (n=431 slides, AUC)=0.84) and rectal cancer biopsies (n=265 slides, AUC=0.85). imCMS spatially resolved intratumoural heterogeneity and provided secondary calls correlating with bioinformatic prediction from molecular data. imCMS classified samples previously unclassifiable by RNA expression profiling, reproduced the expected correlations with genomic and epigenetic alterations and showed similar prognostic associations as transcriptomic CMS.

Conclusion: This study shows that a prediction of RNA expression classifiers can be made from H&E images, opening the door to simple, cheap and reliable biological stratification within routine workflows.

Keywords: colorectal pathology; computerised image analysis; molecular pathology.


Conflict of interest statement

Competing interests: KS and JR are co-founders of University of Oxford spinout Ground Truth Labs

Figures

Figure 1
Figure 1
Data, study design and imCMS classification framework. Three independent datasets (FOCUS, TCGA and GRAMPIAN) were used in this study. (A) The distribution of the samples stratified by the CMS calls in each dataset. (B) The FOCUS dataset was primarily used for learning the imCMS discriminative model, while the TCGA and GRAMPIAN datasets were used for testing. (C) Training of the imCMS discriminative model based on the domain adversarial approach. Image tiles were extracted from annotated tumour regions. Tiles from the FOCUS cohort were categorised by CMS class of the original slide and were used to train the model to predict the imCMS classes on unseen datasets. Tiles from the TCGA and GRAMPIAN cohorts were unlabelled and were used together with those from the FOCUS cohort in the cohort (domain) prediction. Domain adversarial training forced the cohort classifier to perform poorly, which in turn encouraged the model to learn indiscriminative features across datasets. Five distinct models were produced. (D) At the inference time, the ensemble of the learnt models predicts the imCMS class for each of the image tiles extracted from annotated tumour regions of a slide. A slide is assigned to the imCMS class with the maximum prediction score (ie, highest number of tiles in the slide). imCMS, image-based consensus molecular subtype; TCGA, The Cancer Genome Atlas.
Figure 2
Figure 2
Image-based consensus molecular subtype (imCMS) classification. (A) Receiver operating curves of the imCMS classifier, optimised by the domain adversarial approach, on the FOCUS (n slides=510, 3×), TCGA (n slides=431, 3×) and GRAMPIAN cohorts (n slides=265, 12×). (B) Correspondences between CMS and imCMS classes in different datasets. All samples labelled as unclassified by RNA-based CMS calls were reclassified by imCMS. (C) Examples of image tiles with high prediction confidence for each imCMS class in FOCUS. Histological patterns associated with imCMS1 are mucin and lymphocytic infiltration. In imCMS2, evident cribriform growth patterns and comedo-like necrosis are observed, while imCMS3 is characterised by ectatic, mucin-filled glandular structures in combination with a minor component showing papillary and cribriform morphology. imCMS4 is predominantly associated with infiltrative CRC growth pattern, a prominent desmoplastic stromal reaction and frequent presence of single cell invasion (tumour budding). Scale bar ~1 mm. (D) Molecular associations of the CMS classified samples (black) and the CMS unclassified samples that have been classified by imCMS (grey). The molecular profiles of reclassified samples are largely consistent with those of the classified CMS samples. Statistically significant differences (p<0.05) are marked with a red asterisk. AUC, area under the curve; TCGA, The Cancer Genome Atlas.
Figure 3
Figure 3
Intratumoural heterogeneity of the imCMS molecular subtypes. (A) Visualisation of the regional classification of the imCMS classifier. imCMS classification of a tumour sample can exhibit uniform results (left) or a degree of variation in the predicted imCMS class and the level of confidence (right). The colour overlay indicates the imCMS classes and the opacity reflects the classification confidence. (B) Heterogeneity of the CMS and imCMS classification scores. Each bar represents classification scores of a sample, and samples are sorted by the entropy of the prediction scores from the molecular-based random forest CMS classifier. (C) Heterogeneity of the CMS classification. A secondary CMS call was derived by relaxing the classification threshold of the random forest CMS classifier. (D) Cosine similarity between the imCMS and CMS prediction scores, stratified by the primary and secondary CMS calls. The levels of similarity were compared against those produced by a random classifier. Statistical analysis was performed using Wilcoxon rank-sum test, adjusted for the false discovery rate. P value <0.05 was considered statistically significant. n indicates the number of patients. Note that two diagnostic slides (serial sections) were available for the majority of cases in the FOCUS and GRAMPIAN cohorts. In cases where two slides were available, the analyses for each slide were performed separately. Panels (B) and (D) report the results for the first slide. The matched results for the second slide are provided in online supplementary figure S10. imCMS predictions represent the calls made by the domain adversarially trained imCMS classifier. imCMS, image-based consensus molecular subtype; TCGA, The Cancer Genome Atlas.
Figure 4
Figure 4
Prognostic associations of the image-based consensus molecular subtypes (imCMSs). Overall survival (OS) outcomes of the FOCUS cohort (n=278 patients, (A)) and TCGA cohort (n=395 patients, (B)), progression-free interval (PFI) outcome of the TCGA cohort (n=395, (C)) and relapse-free survival (RFS) outcome (n=83, (D)) as stratified by the transcriptional-based CMS classification and imCMS classification produced by the domain adversarially trained imCMS classifier. Kaplan–Meier estimator was used to estimate the survival probability, and pairwise log-rank test and univariate Cox proportional hazards regression were performed between CMS groups and imCMS groups. HRs and 95% CI for pairwise comparisons were reported. Test results with p value<0.05 were considered statistically significant. TCGA, The Cancer Genome Atlas.

References

    1. Dienstmann R, Vermeulen L, Guinney J, et al. . Consensus molecular subtypes and the evolution of precision medicine in colorectal cancer. Nat Rev Cancer 2017;17:79–92. 10.1038/nrc.2016.126 - DOI - PubMed
    1. Van Cutsem E, Köhne C-H, Hitre E, et al. . Cetuximab and chemotherapy as initial treatment for metastatic colorectal cancer. N Engl J Med 2009;360:1408–17. 10.1056/NEJMoa0805019 - DOI - PubMed
    1. Trusheim MR, Berndt ER, Douglas FL. Stratified medicine: strategic and economic implications of combining drugs and clinical biomarkers. Nat Rev Drug Discov 2007;6:287–93. 10.1038/nrd2251 - DOI - PubMed
    1. Sepulveda AR, Hamilton SR, Allegra CJ, et al. . Molecular biomarkers for the evaluation of colorectal cancer: guideline from the American Society for clinical pathology, College of American pathologists, association for molecular pathology, and the American Society of clinical oncology. J Clin Oncol 2017;35:1453–86. 10.1200/JCO.2016.71.9807 - DOI - PubMed
    1. Punt CJA, Koopman M, Vermeulen L. From tumour heterogeneity to advances in precision treatment of colorectal cancer. Nat Rev Clin Oncol 2017;14:235–46. 10.1038/nrclinonc.2016.171 - DOI - PubMed

Publication types