. 2020 Aug 12;40(33):6357-6366.
doi: 10.1523/JNEUROSCI.0937-20.2020. Epub 2020 Jul 20.

Age-Related Hearing Loss Is Dominated by Damage to Inner Ear Sensory Cells, Not the Cellular Battery That Powers Them

Affiliations

Age-Related Hearing Loss Is Dominated by Damage to Inner Ear Sensory Cells, Not the Cellular Battery That Powers Them

Pei-Zhe Wu et al. J Neurosci. .

Abstract

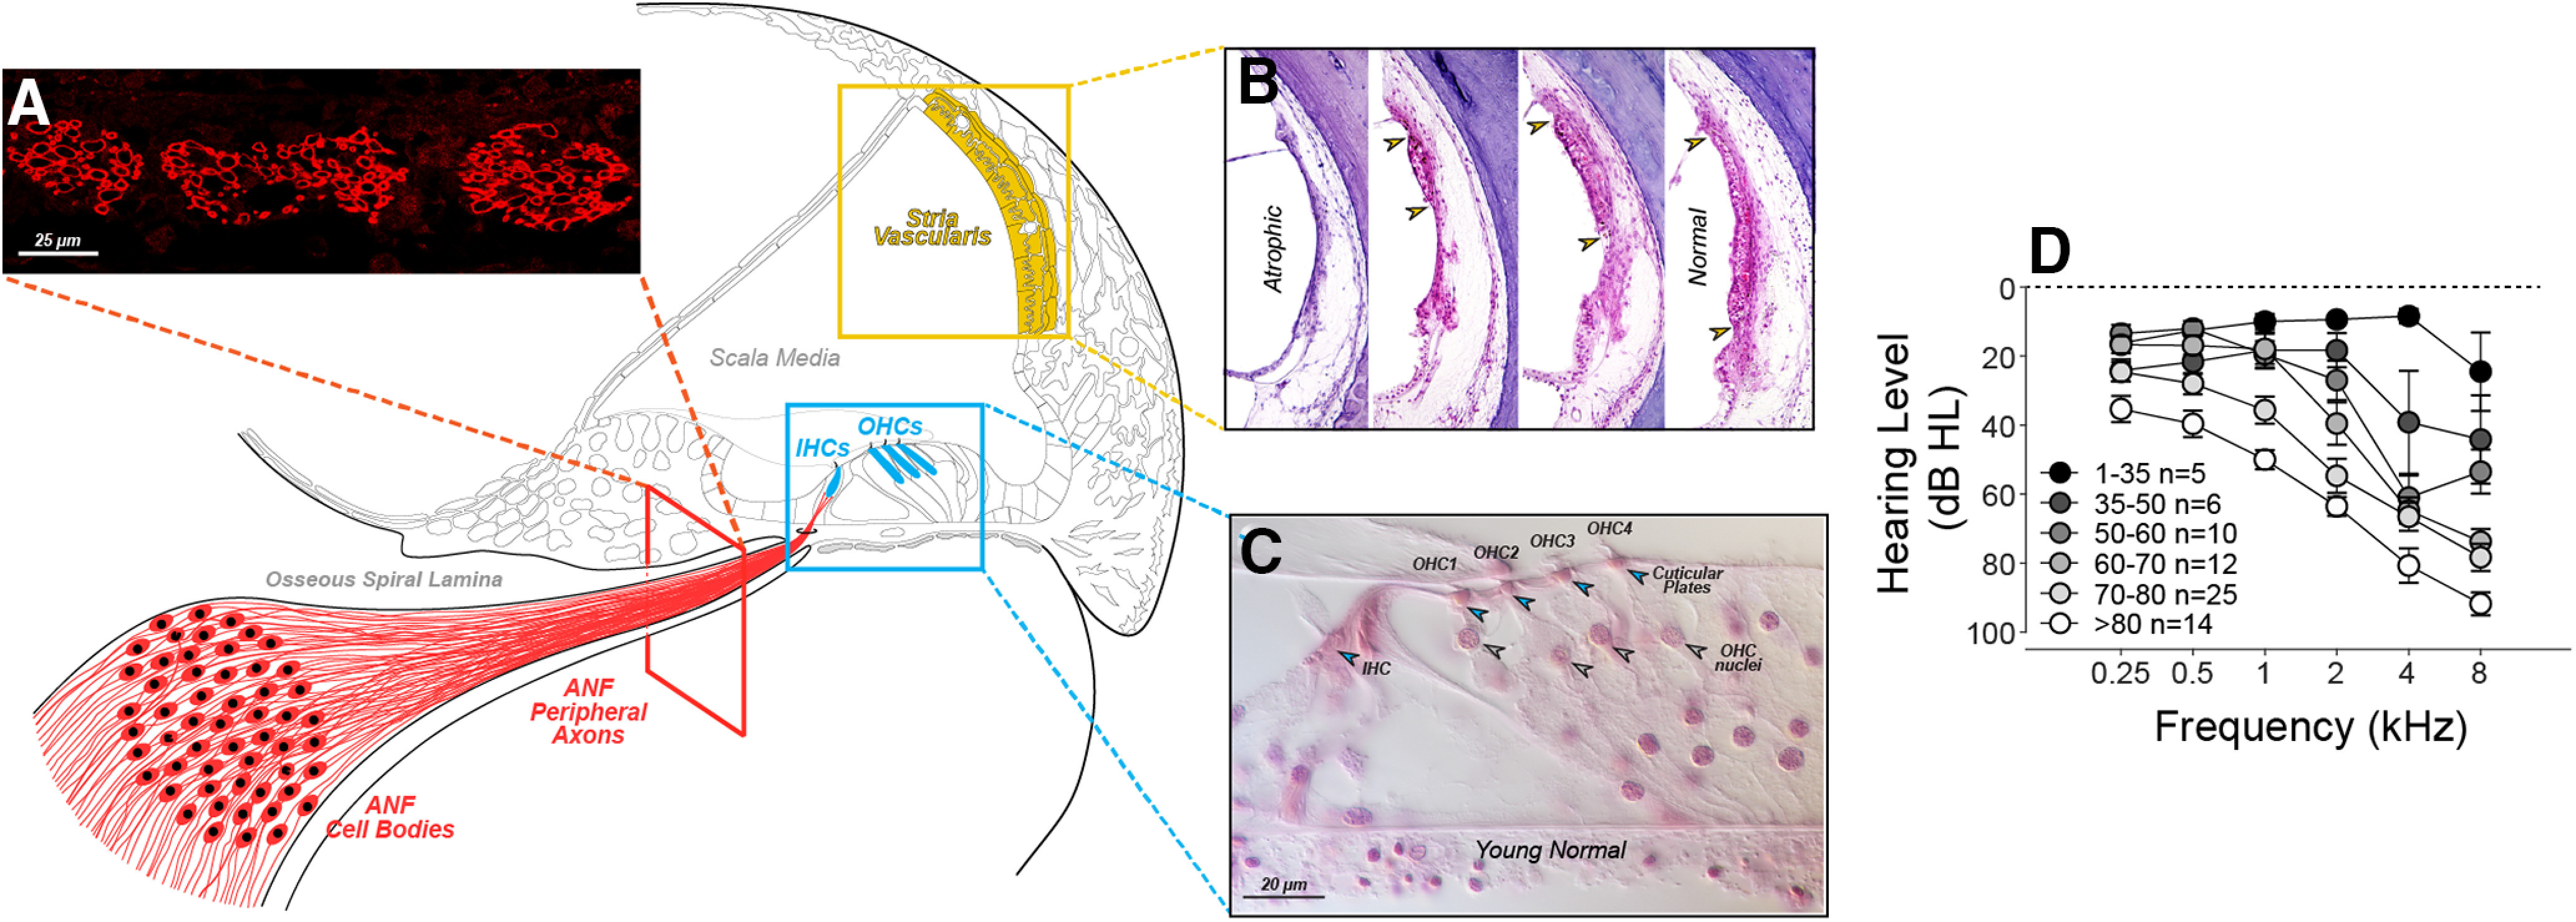
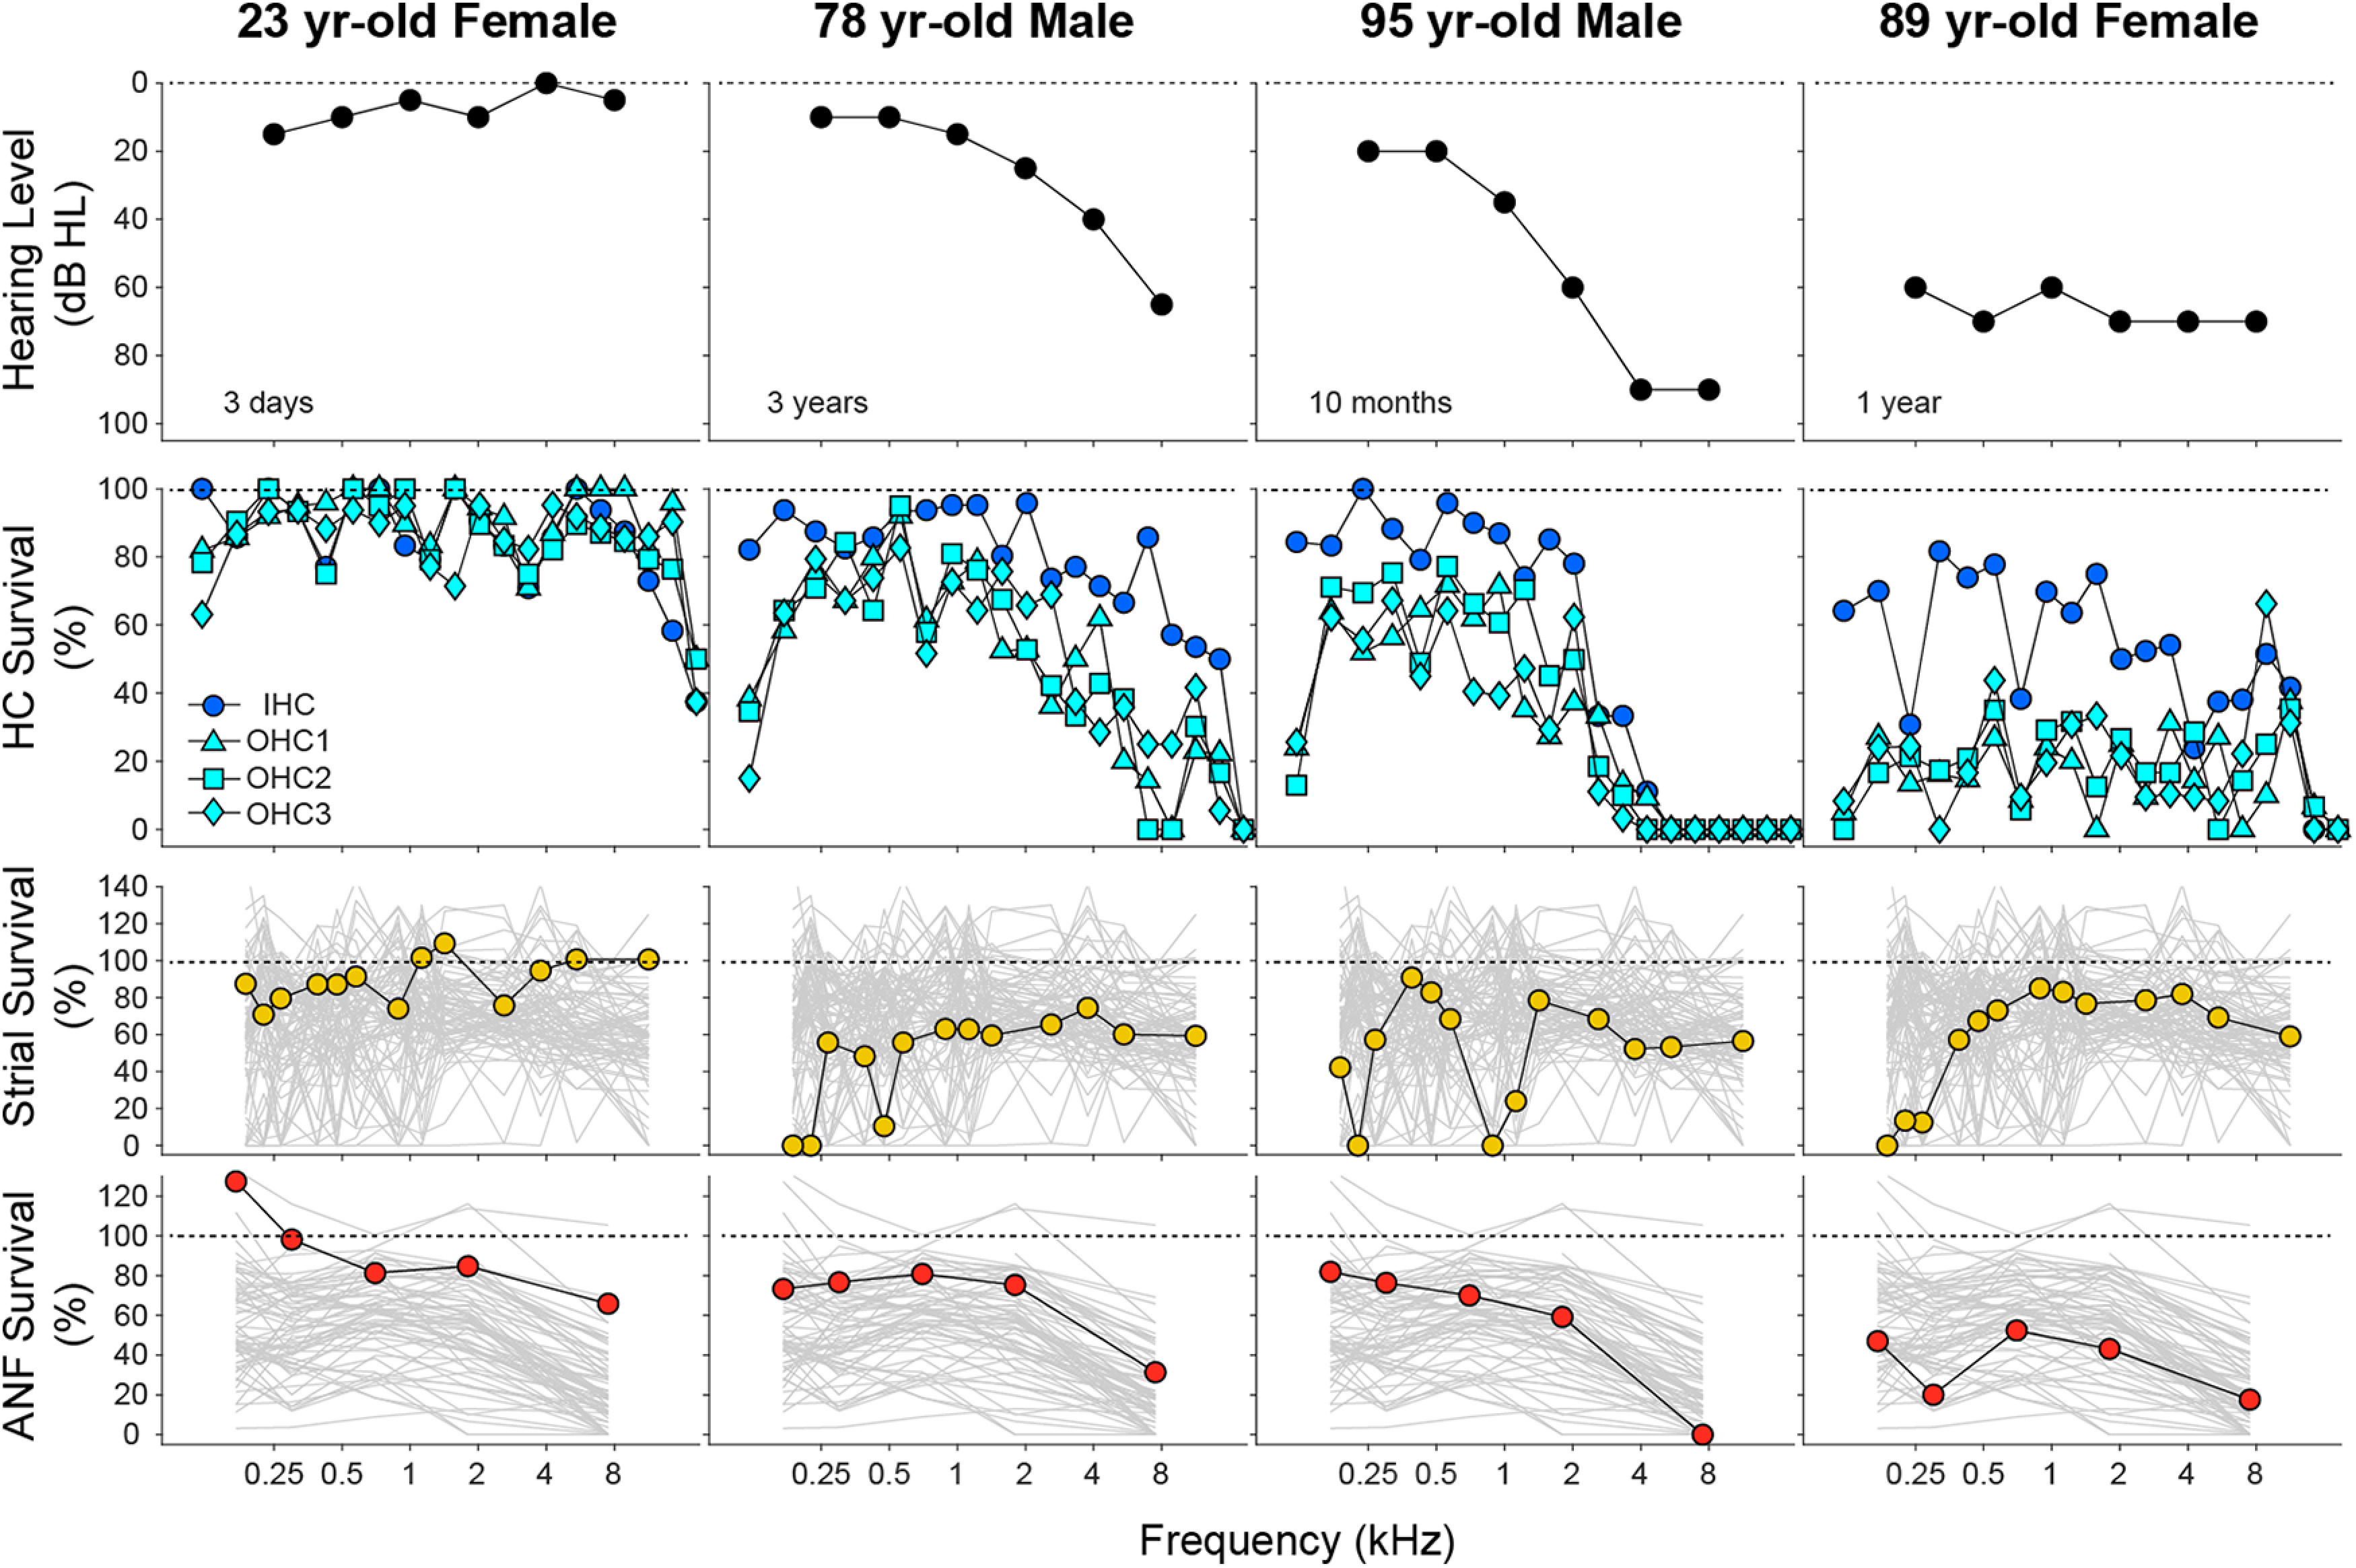
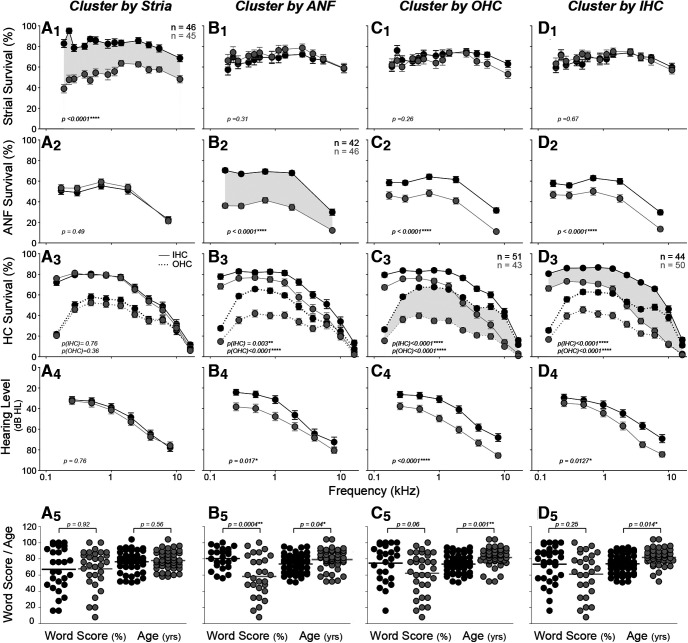
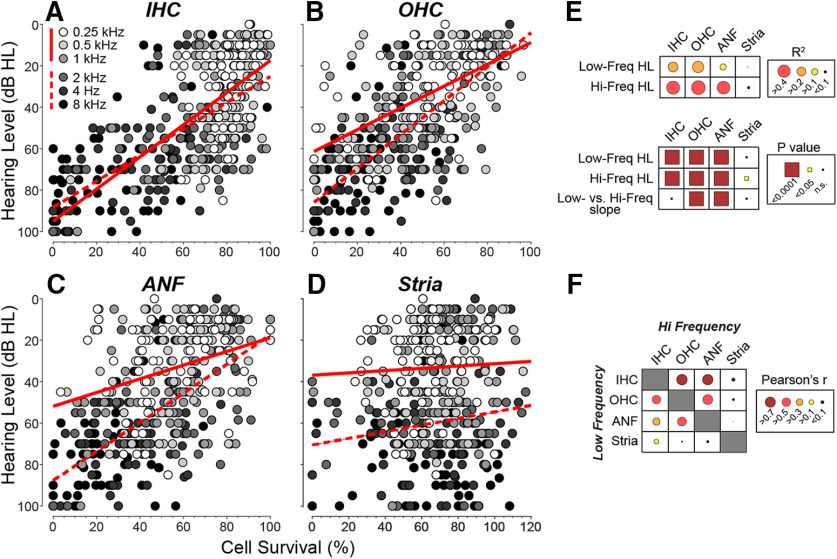
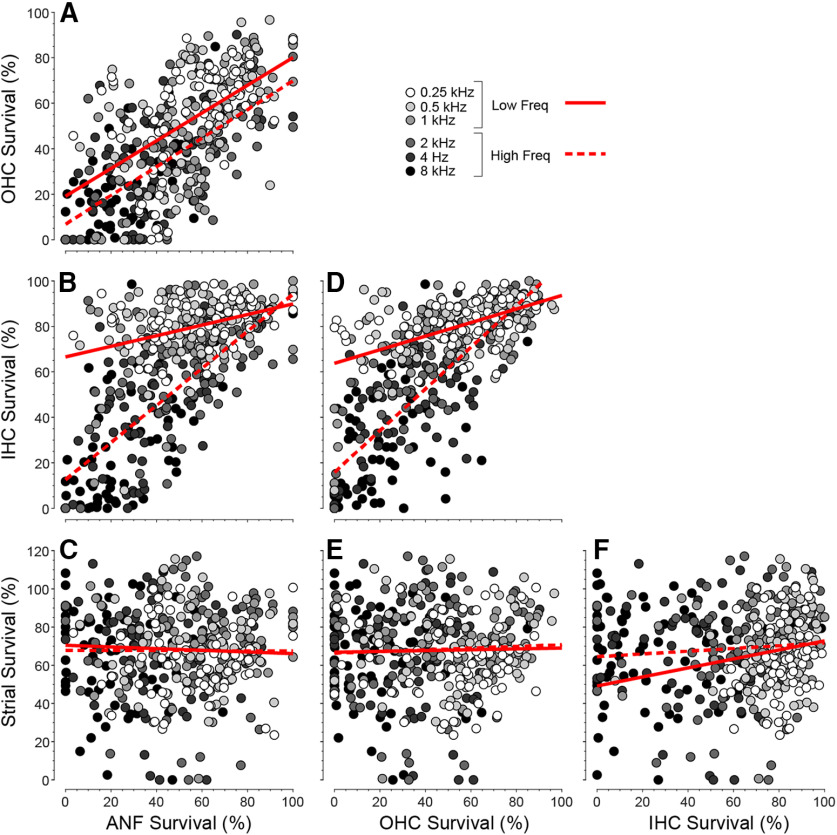
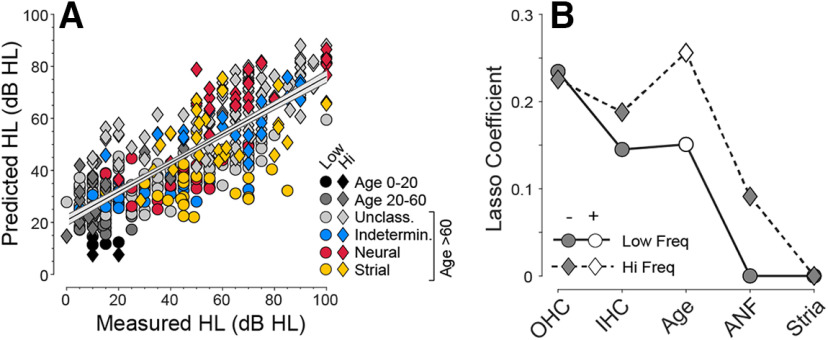
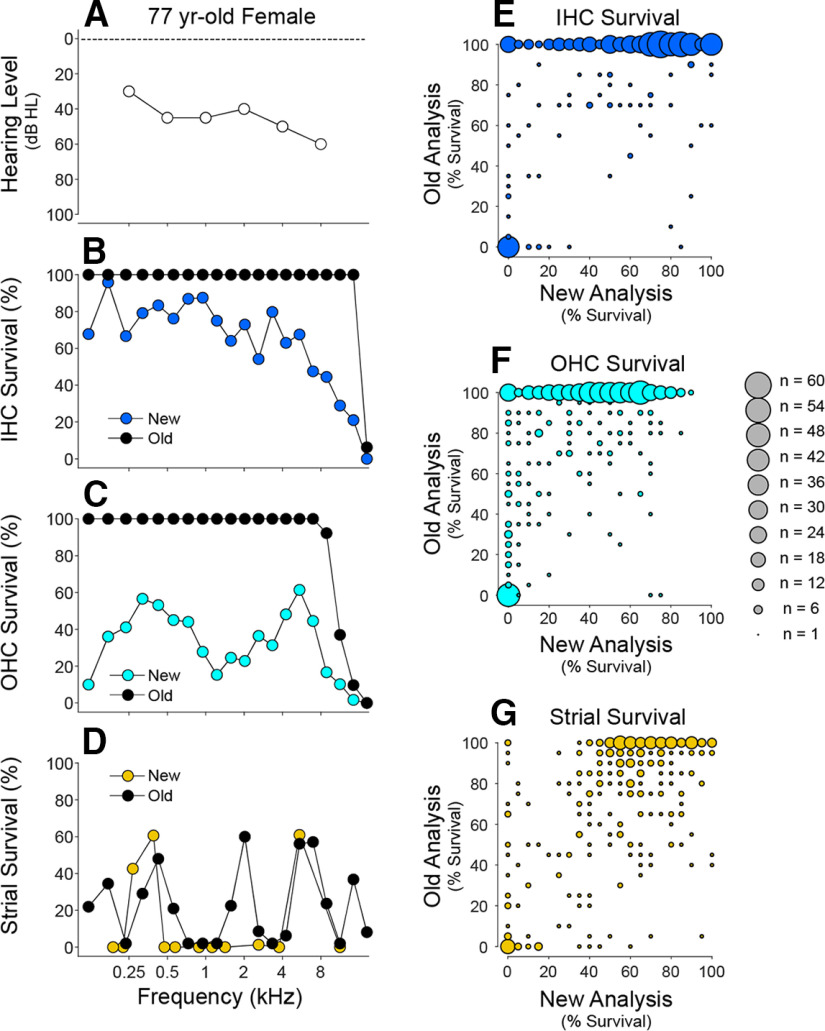
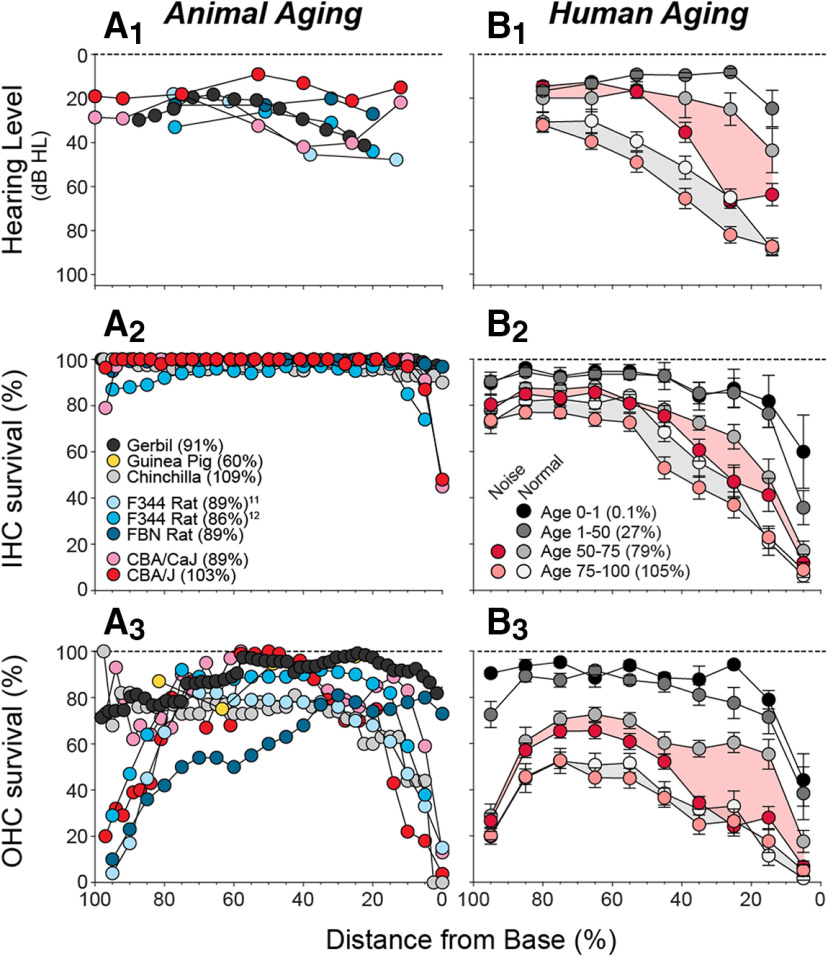
Age-related hearing loss arises from irreversible damage in the inner ear, where sound is transduced into electrical signals. Prior human studies suggested that sensory-cell loss is rarely the cause; correspondingly, animal work has implicated the stria vascularis, the cellular "battery" driving the amplification of sound by hair cell "motors." Here, quantitative microscopic analysis of hair cells, auditory nerve fibers, and strial tissues in 120 human inner ears obtained at autopsy, most of whom had recent audiograms in their medical records, shows that the degree of hearing loss is well predicted from the amount of hair cell loss and that inclusion of strial damage does not improve the prediction. Although many aging ears showed significant strial degeneration throughout the cochlea, our statistical models suggest that, by the time strial tissues are lost, hair cell death is so extensive that the loss of battery is no longer important to pure-tone thresholds and that audiogram slope is not diagnostic for strial degeneration. These data comprise the first quantitative survey of hair cell death in normal-aging human cochleas, and reveal unexpectedly severe hair cell loss in low-frequency cochlear regions, and dramatically greater loss in high-frequency regions than seen in any aging animal model. Comparison of normal-aging ears to an age-matched group with acoustic-overexposure history suggests that a lifetime of acoustic overexposure is to blame.SIGNIFICANCE STATEMENT This report upends dogma about the causes of age-related hearing loss. Our analysis of over 120 autopsy specimens shows that inner-ear sensory cell loss can largely explain the audiometric patterns in aging, with minimal contribution from the stria vascularis, the "battery" that powers the inner ear, previously viewed as the major locus of age-related hearing dysfunction. Predicting inner ear damage from the audiogram is critical, now that clinical trials of therapeutics designed to regrow hair cells are underway. Our data also show that hair cell degeneration in aging humans is dramatically worse than that in aging animals, suggesting that the high-frequency hearing losses that define human presbycusis reflect avoidable contributions of chronic ear abuse to which aging animals are not exposed.

Keywords: auditory; disorders of nervous system; sensory and motor system.


Figures

Figure 1.
Figure 1.
Three histologic features (A-C) were quantified as histologic predictors of hearing level (D). Peripheral axons of ANFs were counted in cross-sections (A). The stria vascularis (B), shown from 4 cases (Merchant and Nadol, 2010), was quantified by measuring surviving epithelial area (regions between the arrowheads). IHCs and OHCs (C) were counted using stereocilia and cuticular plates (open arrowheads) as markers of survival (Wu et al., 2019). Audiograms (D) show group mean hearing loss (±SEMs) for all cases analyzed, except 5 that were excluded (from this plot only) because they were chosen for prior study based solely on their unusual audiometric pattern (Pauler et al., 1988). Cases are separated into six age groups as shown in the key. The male (M)/female (F) mix for each group is as follows: age 1-35, 1 M, 4 F; age 35-50, 5 M, 1 F; age 50-60, 10 M, 0 F; age 60-70, 11 M, 1 F; age 70-80, 17 M, 8 F, and age >80, 8 M, 6 F.
Figure 2.
Figure 2.
Histopathological analyses from 4 of the normal-aging cases in the present study. For each case, the most recent audiogram is shown in the top row, and the histopathological data for hair cells, stria vascularis, and ANFs are summarized in the second, third, and fourth rows, respectively. Hair cell data are binned into 5% increments of cochlear length, and the key at the left applies to all columns. Strial and neuronal data are unbinned and are plotted with the profiles from all cases studied (gray). For the histopathological measures, cochlear location has been converted into frequency according to the cochlea frequency map for human (Greenwood, 1990).
Figure 3.
Figure 3.
Cluster analysis shows interactions among predictors and the contribution of each to hearing level and word scores. In each column, k-means clustering was performed based on fractional survival of a different histologic metric, as indicated in the header: A1–A5, stria; B1–B5, ANF; C1–C5, OHCs; and D1–D5, IHCs. Clustering was adjusted to define two groups of approximately equal size, as shown by the paired functions separated by gray shading (n values are group sizes). For the top three rows, mean values (±SEMs) are shown for the histologic metric indicated on the y axis at the left. The bottom two rows represent the outcomes for each cluster: means (±SEMs) for audiograms (A4, B4, C4, D4) and dot plots for word scores (A5, B5, C5, D5). Ages are shown in the bottom row, along with statistics for the pairwise comparisons: Student's t test for the bottom row; profile analysis for the top three rows. The dataset for hair cell counts includes all cases older than 50 years (n = 94: 58 M, 36 F); strial measurements were impossible in 3 cases because of gross portmortem artifact (n = 91: 57 M, 34 F), and ANF counts were impossible in 6 cases because of faint staining (n = 88: 57M, 31F).
Figure 4.
Figure 4.
Regression analyses of the four histologic predictors of hearing level (A–E), and the pairwise correlations among them (F), show that strial atrophy is relatively independent of the other three metrics and is poorly predictive of threshold. Each point in each scatterplot represents the mean of the relevant metric, binned over cochlear loci appropriate to the audiometric frequency, as coded in grayscale (key in A also applies to B–D). The regression was assessed separately for low (0.25, 0.5, and 1.0) versus high (2.0, 4.0, and 8.0) frequencies, and the best-fit straight lines are shown by solid and dashed lines, respectively. The r2 values and p values for the least-squares regression are indicated graphically in E, along with p values for the significance of the difference of slope between low- and high-frequency regressions. The Pearson's r values for the pairwise correlations between each of the histologic predictors are indicated graphically in F: the raw scatterplots are in Figure 5. Hair cell measures were completed in 77 cases (43 M, 34 F), ANF measure in 72 cases (39 M, 33 F), and strial measures in 76 cases (43 M, 33 F).
Figure 5.
Figure 5.
A–F, Pairwise correlations among the histologic predictors. As in Figure 4, the histologic data in each case are binned and averaged over the cochlear locations appropriate to each audiometric frequency: thus, each case produces 6 points on each graph. Data were derived from the 71 cases (39 M, 32 F) with recent audiograms and complete histologic data. Least-squares best-fit straight lines are separately computed for low- versus high-frequency regions (solid vs dashed lines).
Figure 6.
Figure 6.
Multivariable LASSO regression was used to derive the best weightings (coefficients) of the histologic metrics (plus age; B) should be used to predict hearing level (A). As for Figure 4, the regression analysis was separately conducted for low- versus high-frequency regions (circles vs diamonds in A and B). The regression line, plus 95% CI, is shown for both frequency regions combined. The differences in coefficient polarity (B) arise because hearing level is expressed as a loss and is positively correlated with age, while histologic metrics are expressed as survival and are negatively correlated with hearing level. The data are derived from the 71 cases (39 M, 32 F) with recent audiograms (<5.5 years) and complete histologic data. The younger ears (<60 years) are grouped as shown in key (age 0-20, 0 M, 1 F; age 20-60, 6 M, 4 F; unclassified, 25 M, 11 F; indeterminate, 5 M, 3 F; neural, 1 M, 7 F; strial, 2 M, 6 F). The older ears (≥ 60 years) comprise all the exemplars of the four presbycusis types previously studied (n = 24 of 35) (Schuknecht and Gacek, 1993; Merchant and Nadol, 2010), except 11 that were excluded (from this plot only) because ANF counts were impossible or recent audiograms (<5.5 years) were unavailable. The unclassified group comprises additional normal-aging individuals from the Massachusetts Eye and Ear collection not previously studied.
Figure 7.
Figure 7.
Comparison of hair cell and strial survival metrics from the same slide sets: published data, that is, “Old analysis” (Schuknecht and Gacek, 1993) versus the “New Analysis” in the present study. A–D, One example case, including the audiogram (A) and a comparison of results for IHCs (B), OHCs (C), and stria (D). E–G, Summary comparisons from all the exemplar cases (n = 35) from the presbycusis studies of Schuknecht and colleagues (Schuknecht and Gacek, 1993; Merchant and Nadol, 2010). To create the summary plots in E–G, we scanned the published graphs, digitized and extracted the histogram values, and converted the data into mean survival for each cell type, within each 5% cochlear-length bin. For the same cases, we computed the mean survival for each cell type over the same 5% length bin as assessed in the present study. To display the results, we rounded each mean value to the nearest 5% survival bin, and created these scatterplots in which the area of the symbol is proportional to the number of observations falling within each bin of the matrix.
Figure 8.
Figure 8.
Histologic and audiometric measures of age-related hearing loss in animals (A1–A3) versus humans (B1–B3). A1, Cochlear threshold shifts from animal studies. B1, Mean (±SEMs) audiograms from the present study, grouped by age as indicated (B2), and separated into those with or without a noise-exposure history (age 0-1, 3 M, 1 F; age 1-50, 5 M, 5 F; age 50-75 with noise history, 19 M, 0 F; age 50-75 without noise history, 3 M, 9 F; age 75-100 with noise history, 21 M, 3 F; age 75-100 without noise history, 7 M, 9 F). A2, A3, B2, B3, Mean values of IHC or OHC survival as indicated. A1–A3, Data were from the following studies: mouse (Ohlemiller et al., 2010), gerbil (Tarnowski et al., 1991), rat (Turner and Caspary, 2005; Bielefeld et al., 2008), chinchilla (Bohne et al., 1990), and guinea pig (Ulehlova, 1975). B1–B3, Shading aids visual pairing of normal and noise-history groups within each age range. Parenthetical values in keys (A2, B1) indicate mean age, expressed as percentage of median lifespan: gerbil 39 months (Arrington et al., 1973), chinchilla 15 years (Nowal, 2018), guinea pig 5 years (Nowal, 2018), F344 rat 28 months (Solleveld et al., 1984), FBN rat 36 months (Lipman et al., 1996), CBA/CaJ mouse 27 months (Yuan et al., 2012), and CBA/J mouse 23 months (Fox et al., 1997).

References

    1. Arrington LR, Beaty TC Jr, Kelley KC (1973) Growth, longevity, and reproductive life of the Mongolian gerbil. Lab Anim Sci 23:262–265. - PubMed
    1. Bhatt KA, Liberman MC, Nadol JB Jr (2001) Morphometric analysis of age-related changes in the human basilar membrane. Ann Otol Rhinol Laryngol 110:1147–1153. 10.1177/000348940111001212 - DOI - PubMed
    1. Bhattacharyya TK, Dayal VS (1985) Age-related cochlear hair cell loss in the chinchilla. Ann Otol Rhinol Laryngol 94:75–80. 10.1177/000348948509400116 - DOI - PubMed
    1. Bielefeld EC, Coling D, Chen GD, Li M, Tanaka C, Hu BH, Henderson D (2008) Age-related hearing loss in the Fischer 344/NHsd rat substrain. Hear Res 241:26–33. 10.1016/j.heares.2008.04.006 - DOI - PMC - PubMed
    1. Bohne BA, Gruner MM, Harding GW (1990) Morphological correlates of aging in the chinchilla cochlea. Hear Res 48:79–91. 10.1016/0378-5955(90)90200-9 - DOI - PubMed

Publication types