. 2020 Aug 15;205(4):1009-1023.
doi: 10.4049/jimmunol.2000243. Epub 2020 Jul 20.

E3 Ubiquitin Ligase Von Hippel-Lindau Protein Promotes Th17 Differentiation

Affiliations

E3 Ubiquitin Ligase Von Hippel-Lindau Protein Promotes Th17 Differentiation

Alisha Chitrakar et al. J Immunol. .

Abstract

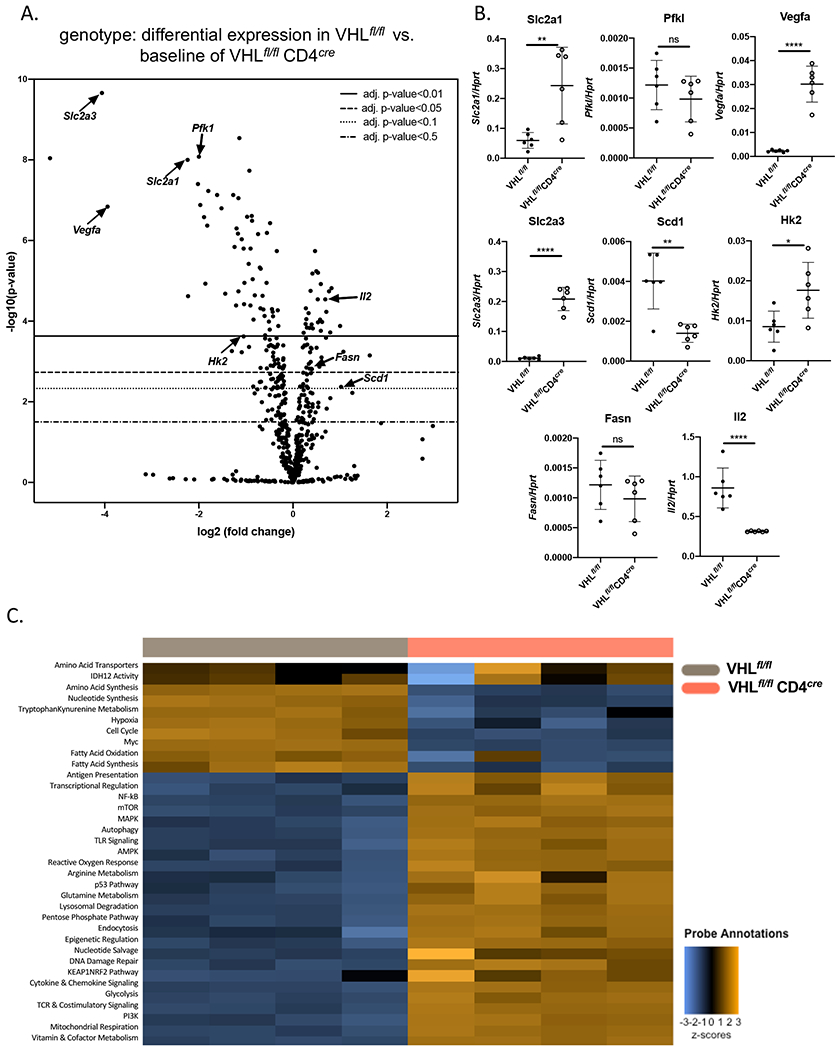
Von Hippel-Lindau (VHL) is an E3 ubiquitin ligase that targets proteins, including HIF-1α, for proteasomal degradation. VHL and HIF regulate the balance between glycolysis and oxidative phosphorylation, which is critical in highly dynamic T cells. HIF-1α positively regulates Th17 differentiation, a complex process in which quiescent naive CD4 T cells undergo transcriptional changes to effector cells, which are commonly dysregulated in autoimmune diseases. The role of VHL in Th17 cells is not known. In this study, we hypothesized VHL negatively regulates Th17 differentiation and deletion of VHL in CD4 T cells would elevate HIF-1α and increase Th17 differentiation. Unexpectedly, we found that VHL promotes Th17 differentiation. Mice deficient in VHL in their T cells were resistant to an autoimmune disease, experimental autoimmune encephalomyelitis, often mediated by Th17 cells. In vitro Th17 differentiation was impaired in VHL-deficient T cells. In the absence of VHL, Th17 cells had decreased activation of STAT3 and SMAD2, suggesting that VHL indirectly or directly regulates these critical signaling molecules. Gene expression analysis revealed that in Th17 cells, VHL regulates many cellular pathways, including genes encoding proteins involved indirectly or directly in the glycolysis pathway. Compared with wild-type, VHL-deficient Th17 cells had elevated glycolysis and glycolytic capacity. Our finding has implications on the design of therapeutics targeting the distinct metabolic needs of T cells to combat chronic inflammatory diseases.


Conflict of interest statement

Conflict of Interest

The authors have no conflicts of interest to report.

Figures

Figure 1
Figure 1. Mice lacking VHL in T cells are resistant to EAE
Vhlfl/fl CD4cre and control wild-type mice (Vhlfl/fl) were injected with MOG35-55 peptide emulsified in CFA s.c. and injected i.p. with 200 ng pertussis toxin at the time of injection and 36-48 hrs later. (A) Mice were scored daily for development of disease. Incidence of disease over time. (B) Disease severity over time. (C) At day 14 post-immunization, the peak of disease onset, % mass change and score were observed. (D-E) At day 21 post-immunization mice were euthanized and T cells in the spleen and spinal cord were assessed by (D) FACS and (E) histology. (F) Vhlfl/fl CD4cre and control wild-type mice (Vhlfl/fl) were injected with MOG35-55 peptide emulsified in CFA s.c. and injected i.p. with 200 ng pertussis toxin at the time of injection and 36-48 hrs later. Ten days post-immunization, mice were euthanized. Splenocytes were cultured in the presence MOG35-55 peptide for 72 hrs. Secreted cytokines were measured in the supernatants by ELISA. Each symbol represents one mouse, horizontal line indicates mean and error bars are SD. For B, multiple t test of EAE score. For C, D and F unpaired t test. * p<0.05, ** p<0.01, *** p<0.001, **** p<0.0001. The experiment was performed three times with n=6-8 mice per group.
Figure 2
Figure 2. The in vivo defect of VHL deficient CD4 T cells is cell-intrinsic
CD45.1 mice were sublethally irradiated and then injected with bone marrow from CD45.2 Vhlfl/fl CD4cre or wild-type control (Vhlfl/fl) mice. (A) Eight weeks later mice were bled (left, representative FACS plots shown) to examine the ratio of CD45.1:CD45.2 cells (right). (B-C) Mice were then injected to induce EAE and 19 days post-immunization were euthanized. (B) EAE score. Shown is the mean±SD. (C) T cells (CD4+ TCRβ+) from the spleens or spinal cords were isolated and analyzed by FACS. Shown are representative plots. Host (CD45.1) and donor (CD45.2) cells were examined. Panel A and C each point represents one mouse, line indicates mean and bars indicate SD. * p<0.05, *** p<0.001, ns = not significant (p>0.05) by unpaired t test. Two independent experiments were performed with 4-5 mice per group and shown are data from one experiment.
Figure 3
Figure 3. VHL-deficient CD4 T cells are defective in in vitro Th17 differentiation
(A) Naïve CD4 T cells from wild-type control (Vhlfl/fl) or VHL deficient (Vhlfl/fl CD4cre) mice were activated in vitro with plate bound α-CD3 and α-CD28 mAbs in the presence of (A) Th1-, Th17 or Th22- skewing conditions. Three days post-differentiation, expression and production of the cytokines IL-17, IL-22 and IFNγ were examined by real time RT-PCR, intracellular cytokine staining (ICS) and FACS, and ELISA. (Top) Shown is a representative FACS plots for IL-17 ICS, number indicates the percent cells within the gate. (Other rows) IL-17, IL-22 and IFNγ were examined by (left) mRNA levels by real time RT-PCR, (middle) secreted protein by ELISA or (right) intracellular cytokine levels by ICS. Experiment was performed more than three times with similar results. Each symbol represents a different sample, line indicates mean and bars are SD. * p<0.05, ** p<0.01, *** p<0.001, ns = not significant (p>0.05) by unpaired t test. (B) Naïve CD4 T cells from wild-type control (Vhlfl/fl) or VHL deficient (Vhlfl/fl CD4cre) mice were activated in vitro with plate bound α-CD3 and α-CD28 mAbs in the presence of Treg-inducing conditions or under neutral Th0 conditions. Three days post-differentiation cells were intranuclearly stained for the transcription factor Foxp3. (Left) Representative FACS plots. (Right) Summary data of multiple samples (n=3). Experiment was performed more than three times with similar results. Each symbol represents a different sample, line indicates mean and bars are SD. ns = not significant (p>0.05) by unpaired t test.
Figure 4
Figure 4. VHL deficient CD4 T cells do not have major defects in apoptosis or proliferation
(A) Naïve CD4 T cells from wild-type control (Vhlfl/fl) or VHL deficient (Vhlfl/fl CD4cre) mice were differentiated in vitro under Th0- or Th17-skewing conditions. Three days post-activation cells were stained with a fluorescent substrate to measure active caspase 3. Experiment was performed three times with similar results. Each symbol represents a different sample, line indicates mean and bars are SD. *** p<0.001, ns = not significant (p>0.05) by unpaired t test. (B-C) Naïve CD4 T cells from wild-type control (Vhlfl/fl) or VHL deficient (Vhlfl/fl CD4cre) mice were labeled with CFSE and then differentiated in vitro under Th17-skewing conditions. (B) 24, 48 and 72 hrs post-activation, cell division was analyzed by FACS. Shown are representative histograms. (C) At the indicated time post-activation, cells were restimulated with PMA and ionomycin in the presence of BFA for 5 hrs. Cells were then intracellularly stained for IL-17 and analyzed by FACS. Shown are representative plots showing IL-17 production by CFSE. Gates are drawn on each cell division, with percent of cells within each gate shown below. (D) The percent of IL-17+ cells in each division at 72 hrs. (E) The proliferation and division index at different time points. The proliferation index is the total number of cell divisions divided by the number of cells that went into division. The division index is the average number of divisions that a cell in the original population has undergone. Experiment was performed more than three times with similar results.
Figure 5
Figure 5. VHL deficient Th17 differentiation impairment is independent of IL-23
(A) Naïve CD4 T cells from wild-type control (Vhlfl/fl) or VHL deficient (Vhlfl/fl CD4cre) mice were activated in vitro with plate bound α-CD3 and α-CD28 mAbs in the presence of two different types of Th17-inducing conditions; inflammatory (our typical cultures with IL-6, TGF-β, IL-1β and IL-23) and classic conditions which only contain IL-6 and TGF-β. Three days post-activation supernatants were harvested and secreted IL-17 was analyzed by ELISA. Cells were restimulated with PMA and ionomycin in the presence of BFA, intracellularly cytokine stained for IL-17 and analyzed by FACS. (Left) Representative FACS plots. (Middle) Summary data for ICS data. (Right) ELISA data. Each point represents one sample, line indicates mean, bars represent SD. * p<0.05, ** p<0.01 by unpaired t test. (B) Naïve CD4 T cells from wild-type control (Vhlfl/fl) or VHL deficient (Vhlfl/fl CD4cre) mice were activated in vitro with plate bound α-CD3 and α-CD28 mAbs in the presence of Th17-inducing conditions. Three days post-activation cells were surface stained for IL-23R, or with an isotype control. (Left) Sample FACS plots. (Right) Summary data for the percent IL-23R+ cells. Each point represents one well, line indicates mean, bars represent SD. Experiment was performed three times with similar results. **** p<0.0001 by unpaired t test.
Figure 6
Figure 6. VHL deficient Th17 cells have reduced activation of SMAD2 and STAT3
Wild-type (Vhlfl/fl) or VHL deficient (Vhlfl/fl CD4cre) naïve CD4 T cells were differentiated under Th17-skewing conditions for up to 72 hrs. At different times points (0, 12, 24 48 and 72 hrs) cells were harvested and protein levels were analyzed by western blotting. (A) phosphorylated-SMAD2 (p-SMAD2), total SMAD2 or actin. (B) phosphorylated-STAT3 (p-STAT3), total STAT3 or actin. Blots are representative of three similar independent experiments. Western blots have been cropped.
Figure 7
Figure 7. VHL regulates multiple signaling pathways in T cells
Wild-type (Vhlfl/fl) or VHL deficient (Vhlfl/fl CD4cre) naïve CD4 T cells were differentiated under Th17-skewing conditions for 48 hrs. RNA expression profiling was performed via nCounter Analysis Technology (NanoString; Seattle, WA) using a nCounter mouse metabolic pathways panel with 768 genes and 20 internal reference genes for normalization. (A) Volcano plot showing differentially expressed genes between wild-type and VHL deficient Th17 cells. Volcano plot showing adjusted p-value using Benjamini-Yekutieli (adj. p-value) method of False discovery rate. Experiment was performed once, n=4. (B) Selected mRNA transcripts found to be differentially quantitated by NanoString analysis were validated by real time RT-PCR analysis. Each symbol represents one sample, lines indicates mean, bars are SD. * p<0.05, ** p<0.01, **** p<0.0001, ns = not significant by unpaired t test. (C) Differential expression of genes involved in differential cellular pathways.
Figure 8
Figure 8. VHL deficient Th17 cells undergo increased glycolysis
(A) Nuclear extracts from in vitro differentiated Th17 cells from wild-type control (Vhlfl/fl) or VHL deficient (Vhlfl/fl CD4cre) mice were subjected to western blotting to semi-quantitate levels of HIF-1α. Histone 3 (H3) was analyzed as a control. Western blots have been cropped. (B, C) Naïve CD4 T cells from wild-type control (Vhlfl/fl) or VHL deficient (Vhlfl/fl CD4cre) mice were activated in vitro with plate bound α-CD3 and α-CD28 mAbs in the presence of Th17-inducing conditions for three days and then sorted for live cells. Cells were then subjected to XFp Cell Mito Stress Test Kit to measure OCR (B) and XFp Glycolysis Stress Test to measure ECAR (C). (B) Mitochondrial respiration was profiled by adding oligomycin, FCCP and rotenone/antimycin A to Th17 cells and measuring changes in OCR. Basal respiration was calculated by subtracting non-mitochondrial OCR from the OCR before adding oligomycin. ATP production was calculated by subtracting basal OCR from post-oligomycin addition. Maximal OCR was calculated by subtracting non-mitochondrial OCR from OCR post-FCCP addition. (C) Glycolytic function was profiled by adding glucose, oligomycin and 2-DG to Th17 cells and measuring changes in ECAR. Glycolysis was measured by subtracting non-glycolytic ECAR from ECAR post-glucose addition. Glycolytic capacity was measured by subtracting non-glycolytic ECAR from ECAR post-oligomycin addition. Glycolytic reserve was measured by subtracting glycolysis from glycolytic capacity. Experiment was performed three times, n=6-12. Each point represents one well, line indicates mean±SD. * p<0.05, **** p<0.0001, ns = not significant by unpaired t test.

References

    1. Zenewicz LA, Abraham C, Flavell RA, and Cho JH. 2010. Unraveling the genetics of autoimmunity. Cell 140: 791–797. - PMC - PubMed
    1. Rosenblum MD, Remedios KA, and Abbas AK. 2015. Mechanisms of human autoimmunity. J Clin Invest 125: 2228–2233. - PMC - PubMed
    1. Gaffen SL, Jain R, Garg AV, and Cua DJ. 2014. The IL-23-IL-17 immune axis: from mechanisms to therapeutic testing. Nat Rev Immunol 14: 585–600. - PMC - PubMed
    1. Stockinger B, and Omenetti S. 2017. The dichotomous nature of T helper 17 cells. Nat Rev Immunol 17: 535–544. - PubMed
    1. Peck A, and Mellins ED. 2010. Precarious balance: Th17 cells in host defense. Infect Immun 78: 32–38. - PMC - PubMed

Publication types

Substances