. 2020 Jul;8(2):e000588.
doi: 10.1136/jitc-2020-000588.

Monocyte-derived APCs are central to the response of PD1 checkpoint blockade and provide a therapeutic target for combination therapy

Affiliations

Monocyte-derived APCs are central to the response of PD1 checkpoint blockade and provide a therapeutic target for combination therapy

Sjoerd T T Schetters et al. J Immunother Cancer. 2020 Jul.

Abstract

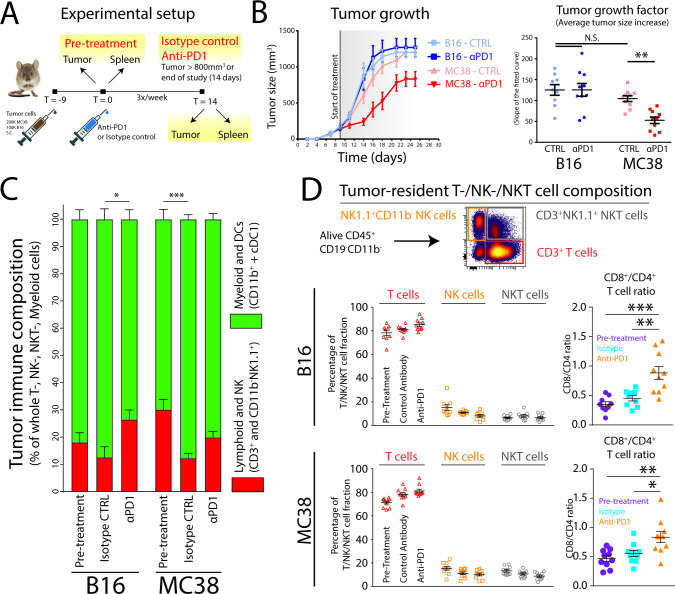
Background: PD1 immune checkpoint blockade (αPD1 ICB) has shown unparalleled success in treating many types of cancer. However, response to treatment does not always lead to tumor rejection. While αPD1 ICB relies on cytotoxic CD8+ T cells, antigen-presenting cells (APCs) at the tumor site are also needed for costimulation of tumor-infiltrating lymphocytes (TILs). It is still unclear how these APCs develop and function before and during αPD1 ICB or how they are associated with tumor rejection.

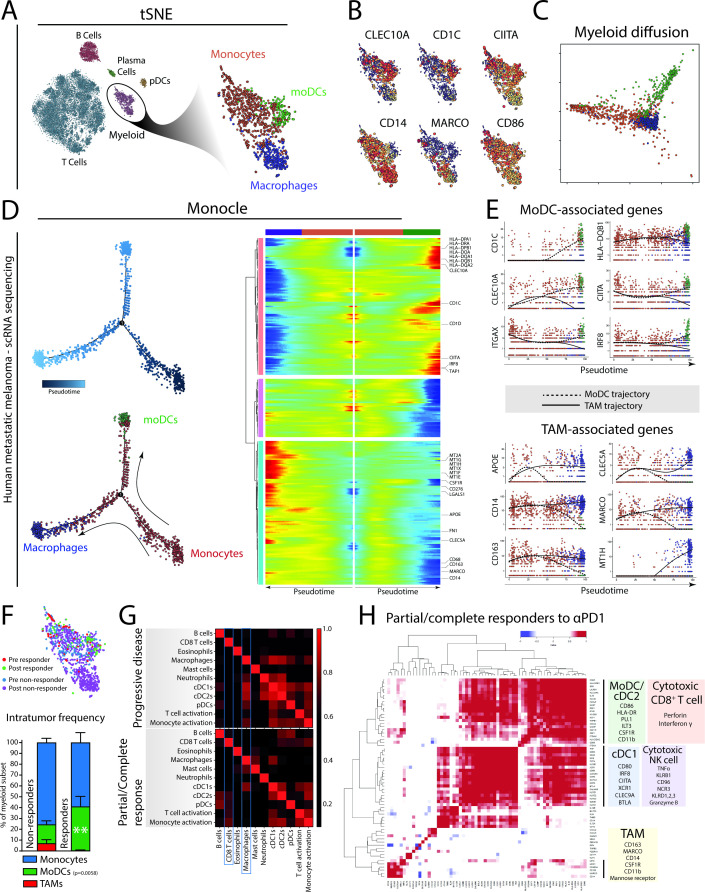
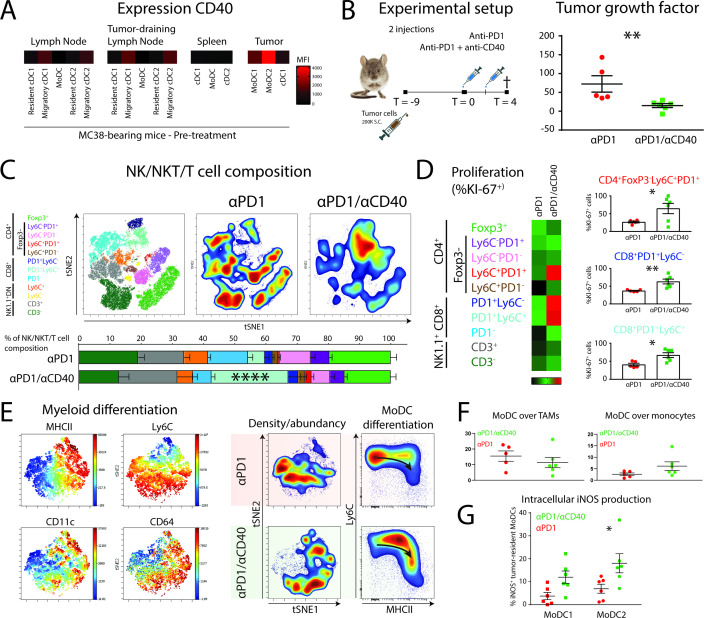
Methods: Here, we used B16 mouse melanoma and MC38 colorectal carcinoma tumor models, which show differential responses to αPD1 ICB. The immune composition of ICB insensitive B16 and sensitive MC38 were extensively investigated using multi-parameter flow cytometry and unsupervised clustering and trajectory analyses. We additionally analyzed existing single cell RNA sequencing data of the myeloid compartment of patients with melanoma undergoing αPD1 ICB. Lastly, we investigated the effect of CD40 agonistic antibody on the tumor-infiltrating monocyte-derived cells during αPD1 ICB.

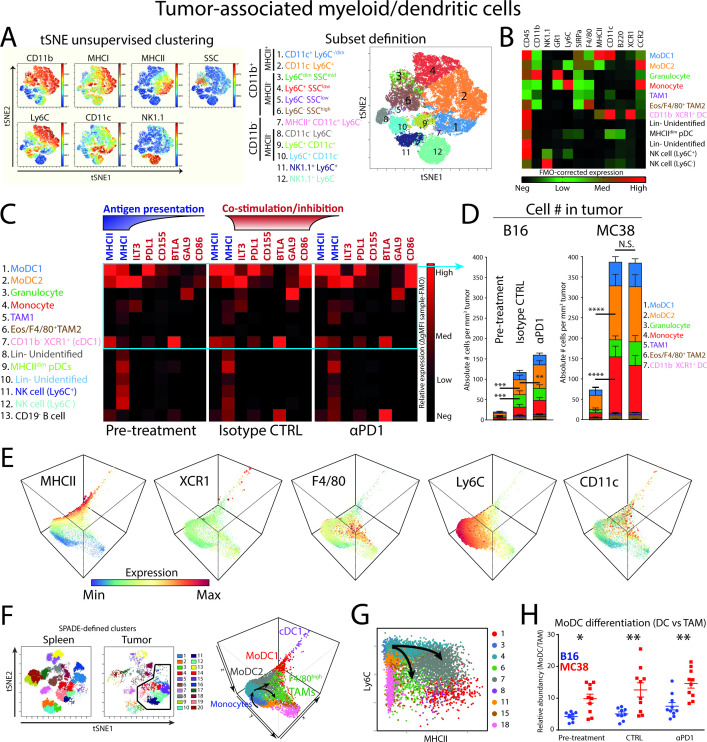
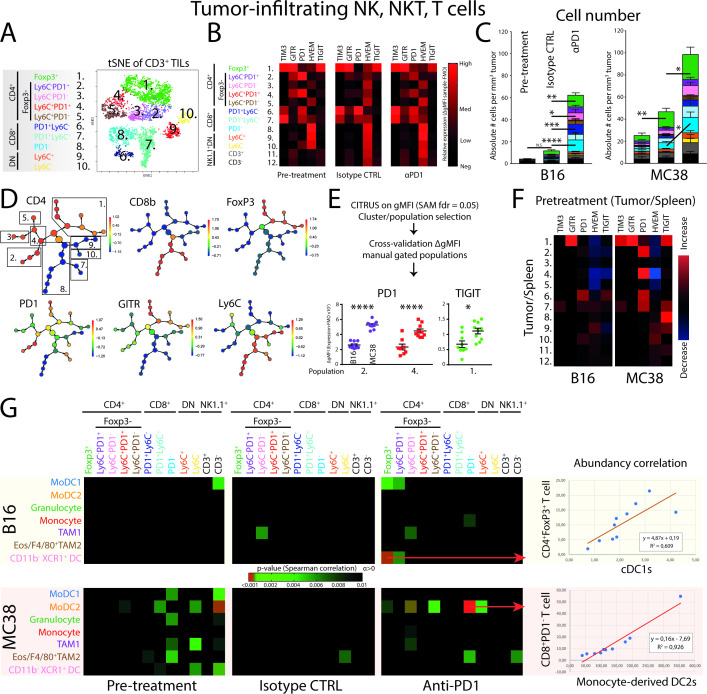
Results: We show that monocyte-derived dendritic cells (moDCs) express high levels of costimulatory molecules and are correlated with effector TILs in the tumor microenvironment (TME) after αPD1 ICB only in responding mouse tumor models. Tumor-resident moDCs showed distinct differentiation from monocytes in both mouse and human tumors. We further confirmed significant enrichment of tumor-resident differentiated moDCs in patients with melanoma responding to αPD1 ICB therapy compared with non-responding patients. Moreover, moDCs could be targeted by agonistic anti-CD40 antibody, supporting moDC differentiation, effector T-cell expansion and anti-tumor immunity.

Conclusion: The combined analysis of myeloid and lymphoid populations in the TME during successful and non-successful PD1 ICB led to the discovery of monocyte-to-DC differentiation linked to expanding T-cell populations. This differentiation was found in patients during ICB, which was significantly higher during successful ICB. The finding of tumor-infiltrating monocytes and differentiating moDCs as druggable target for rational combination therapy opens new avenues of anti-tumor therapy design.

Keywords: costimulatory and inhibitory T-cell receptors; dendritic cells; immunotherapy; programmed cell death 1 receptor; tumor microenvironment.


Conflict of interest statement

Competing interests: None declared.

Figures

Figure 1
Figure 1
Established MC38 colorectal carcinoma tumors, but not established B16 melanoma tumors, are responsive to αPD1 checkpoint blockade. (A) Syngeneic B16 melanoma or MC38 colon carcinoma tumors were subcutaneously grown for 9 days to similar size, after which treatment was started. (B) Growth curves of B16 and MC38 tumors over time show the difference between B16 and MC38 responsiveness to αPD1 checkpoint blockade. Growth curves were quantified by fitting a linear curve (y=αx+β) and plotting the α (ie, the average growth per day). (C) The immune composition of B16 and MC38 tumors before and after treatment (αPD1 or isotype control) as defined by CD11b+ myeloid cells, conventional DC1s (cDC1s), CD3+ T cell, CD11bNK1.1+ NK/NKT cell compartment. (D) Relative changes in tumor-infiltrating T, NK and NKT cells in B16 and MC38 tumors, as well as differences in the ratio of CD8+/CD4+ TILs. Data shown as mean±SEM, n=9–10 per group. Statistics performed: two-way (B) or one-way (C, D) ANOVA with Tukey post hoc; *p<0.05, **p<0.01, ***p<0.001, ****p<0.0001. Representative of 2 individual experiments.
Figure 2
Figure 2
Tumor-associated myeloid cells/dendritic cells in αPD1-responsive tumors and the differentiation from monocytes. (A) tSNE unsupervised clustering of CD45+CD3CD19 MC38 tumor-resident cells reveals six CD11b+ myeloid cell types (pop 1–6) and one CD11b APC type (pop 7). (B) Additional high-dimensional flow cytometry experiments verified the identity of tumor-associated dendritic cells (pop 1, 2, 7), granulocytes (G-MDSCs; pop 3), macrophages (pop 5–6), monocytes (pop 4), pDCs (Pop 9), Lin cells (pop 8,10) and NK1.1+ NK cells (pop 11, 12). (C) Marker expression as FMO-corrected gMFI of checkpoint ligands, MHCI and MHCII. (D) Absolute cell number per tumor volume (# cells/tumor volume mm3) of myeloid cells and cDCs. (E) 3-dimensional diffusion mapping of myeloid cells (LinCD11b+) and cDC1s (LinCD11c+MHCII+XCR1+). (F) Unsupervised clustering of tumor-infiltrating and spleen-derived CD45+CD19CD3 cells by tSNE and subsequent SPADE clustering on tSNE variables allows unbiased delineation of different cell populations. Diffusion mapping of pre-defined myeloid (CD11b+; clusters 1, 3, 4, 6, 7, 11, 15, 18) and cDC1 (MCHII+XCR1+; cluster 8) clusters in the tumor microenvironment shows differentiation trajectories of tumor-infiltrating monocytes toward moDCs (expressing CD11c, MHC class II and losing Ly6C) or F4/80high TAMs. (G) Diffusion mapping shows similar monocyte differentiation trajectories into moDCs or macrophages based on the Ly6C/MHCII plot, in line with previous reports. (H) moDC/TAM differentiation balance reveals enriched moDC differentiation in MC38 tumors. Data presented as mean±SEM (n=10 per group). Statistics performed: (D/H) two-way ANOVA with Tukey post hoc; *p<0.05, **p<0.01, ***p<0.001, ****p<0.0001. Graphs are representative of 2 individual experiments.
Figure 3
Figure 3
Unsupervised clustering analyses of tumor-infiltrating lymphocytes reveal early establishment of T-cell heterogeneity and specific checkpoint receptor expression. (A) tSNE-guided gating strategy of high-dimensional flow cytometry data derived from all conditions revealed 10 CD45+CD11bNK1.1CD3+ T-cell populations; five CD4+ (pop 1–5), three CD8+ (pop 6–8) and two DN (pop 9,10) T-cell populations. Manual gating overlay to the tSNE plot identified TIL clusters (online supplementary figure 3a.) Representative of both B16 and MC38 conditions (online supplementary figure 3b). (B) GMFI corrected with subset-specific FMOs showed TIL subset-specific expression of checkpoint receptors. Data shown of MC38 TILs and representative for both B16 and MC38 models. (C) Absolute cell number per tumor volume (# cells/tumor volume mm3) of TILs in both the B16 and MC38 tumors. (D) CITRUS clustering analysis for hierarchical clustering and statistical analysis of differences in expression of checkpoint receptors between B16 and MC38 TILs. (E) Applying significance-analysis-of-microarrays (SAM, fdr=0.05) was applied on the data set yielding significantly different clusters, which were subsequently cross-validated with the FMO-corrected gMFI of manual gated populations. (F) The tumor-driven upregulation of checkpoint receptors was calculated as the paired differences between TIL and peripheral lymphocyte subset equivalent derived from the spleen. (G) Correlation of absolute abundances (number of cells per tumor volume; corrected p value <0.01) of defined myeloid subsets with defined lymphoid subsets. Data presented as mean±SEM (n=10 per group). Statistics performed: (C) two-way ANOVA with Tukey post hoc; (E) unpaired 2-sided Fisher t-test; (G) Spearman correlation analysis. *p<0.05, **p<0.01, ***p<0.001, ****p<0.0001. Graphs are representative of 2 individual experiments.
Figure 4
Figure 4
Monocyte-derived cells in human patients with melanoma show a bimodal differentiation pattern related to the therapeutic response of αPD1 therapy. (A) Single-cell RNA sequencing data of tumor biopsies of patients with metastatic melanoma treated with αPD1 therapy identify myeloid cells, including monocytes, moDCs and macrophages. (B) Expression of several key genes are differentially distributed in the tumor-resident myeloid cells. (C) Bimodal differentiation of monocytes to macrophages or moDCs can be seen using an unsupervised diffusion map. (D) Using the three identified subsets as landmarks, Monocle was used to order cells in pseudotime (the total transcriptional change a cell undergoes as it differentiates along this variable25) and allows the visualization of the differentiation process of monocytes to macrophages or dendritic cells. (E) Ordering expression of moDC-related and TAM-related genes of single cells of both moDC and TAM differentiation trajectories in pseudotime. (F) Quantification of monocytes, TAMs and moDCs from tumor biopsies of patients with melanoma either responding or not responding to PD1 checkpoint blockade. (G) Using annotated immune gene sets on bulk transcriptomics of tumor biopsies from patients with advanced melanoma treated with PD1 checkpoint blockade (Riaz et al 2017) reveals different gene set correlations (Spearman R) in patients showing a durable response, compared with patients showing progressive disease. (H) Single gene correlation matrix of partial/complete responders indicates co-regulated gene enrichment of moDC/cDC2 genes with genes enriched in cytotoxic CD8+ T cell. cDC1-related gene expression was correlated to gene expression related to cytotoxic NK cell activity. Gene expression related to TAMs did not cluster with NK or CD8 T-cell genes, although some genes like CD14 were coregulated with cDC2/moDC genes. Data in (F) presented as mean±SEM (n=30 non-responders; 14 responders). Statistics performed: (F) two-way ANOVA with Sidak post hoc, significance shown of multiple comparison.
Figure 5
Figure 5
CD40 on tumor-infiltrating MoDCs can be targeted by agonistic anti-CD40 antibodies to augment differentiation of iNOS-producing Tip-DCs and the expansion of effector CD8+ and CD4+ T cells. (A) Expression levels (FMO-corrected gMFI) of CD40 on DC subsets in MC38-bearing mice at pre-treatment conditions. (B) Mice with established MC38 tumors were either injected with αPD1 or αPD1/anti-CD40 combination therapy at day 9 and day 11 post-tumor cell inoculation. At day 4 after start of the treatment, mice were sacrificed. Tumor growth factor was determined by fitting a linear curve (y=αx+β) to the growth measurements and plotting α (ie, the average growth per day). (C) tSNE unsupervised clustering and manual gating strategies (of CD45+CD19CD11bNK1.1) identified the 10 T-cell populations for quantification. (D) T-cell proliferation was measured by intracellular Ki-67 staining in each individual T-cell subset. (E) tSNE unsupervised clustering of myeloid (CD45+CD19CD3NK1.1CD11b+GR1hi) cells shows differentiation of monocytes driven by agonistic anti-CD40 antibody treatment. (F) Monocyte-to-TAM and monocyte-to-moDC differentiation as indicated by the relative abundance. (G) iNOS production was measured by intracellular staining of iNOS in moDC subsets. Data presented as mean±SEM (n=5 per group). Statistics performed: unpaired 2-sided Fisher t-test (B/D); one-way ANOVA with Tukey post hoc (C); two-way ANOVA with Tukey post hoc (F); *p<0.05, **p<0.01, ***p<0.001, ****p<0.0001.

Similar articles

Cited by

References

    1. Topalian SL, Drake CG, Pardoll DM. Immune checkpoint blockade: a common denominator approach to cancer therapy. Cancer Cell 2015;27:450–61. 10.1016/j.ccell.2015.03.001 - DOI - PMC - PubMed
    1. Spranger S, Spaapen RM, Zha Y, et al. . Up-regulation of PD-L1, IDO, and T(regs) in the melanoma tumor microenvironment is driven by CD8(+) T cells. Sci Transl Med 2013;5:200ra116. 10.1126/scitranslmed.3006504 - DOI - PMC - PubMed
    1. Topalian SL, Hodi FS, Brahmer JR, et al. . Safety, activity, and immune correlates of anti-PD-1 antibody in cancer. N Engl J Med 2012;366:2443–54. 10.1056/NEJMoa1200690 - DOI - PMC - PubMed
    1. Rizvi NA, Hellmann MD, Snyder A, et al. . Mutational landscape determines sensitivity to PD-1 blockade in non–small cell lung cancer. Science 2015;348:124–8. 10.1126/science.aaa1348 - DOI - PMC - PubMed
    1. Hugo W, Zaretsky JM, Sun L, et al. . Genomic and transcriptomic features of response to anti-PD-1 therapy in metastatic melanoma. Cell 2016;165:35–44. 10.1016/j.cell.2016.02.065 - DOI - PMC - PubMed

Publication types

Substances