. 2020 Aug 4;117(31):18810-18821.
doi: 10.1073/pnas.2009425117. Epub 2020 Jul 20.

Redistribution of metabolic resources through astrocyte networks mitigates neurodegenerative stress

Affiliations

Redistribution of metabolic resources through astrocyte networks mitigates neurodegenerative stress

Melissa L Cooper et al. Proc Natl Acad Sci U S A. .

Abstract

In the central nervous system, glycogen-derived bioenergetic resources in astrocytes help promote tissue survival in response to focal neuronal stress. However, our understanding of the extent to which these resources are mobilized and utilized during neurodegeneration, especially in nearby regions that are not actively degenerating, remains incomplete. Here we modeled neurodegeneration in glaucoma, the world's leading cause of irreversible blindness, and measured how metabolites mobilize through astrocyte gap junctions composed of connexin 43 (Cx43). We elevated intraocular pressure in one eye and determined how astrocyte-derived metabolites in the contralateral optic projection responded. Remarkably, astrocyte networks expand and redistribute metabolites along distances even 10 mm in length, donating resources from the unstressed to the stressed projection in response to intraocular pressure elevation. While resource donation improves axon function and visual acuity in the directly stressed region, it renders the donating tissue susceptible to bioenergetic, structural, and physiological degradation. Intriguingly, when both projections are stressed in a WT animal, axon function and visual acuity equilibrate between the two projections even when each projection is stressed for a different length of time. This equilibration does not occur when Cx43 is not present. Thus, Cx43-mediated astrocyte metabolic networks serve as an endogenous mechanism used to mitigate bioenergetic stress and distribute the impact of neurodegenerative disease processes. Redistribution ultimately renders the donating optic nerve vulnerable to further metabolic stress, which could explain why local neurodegeneration does not remain confined, but eventually impacts healthy regions of the brain more broadly.

Keywords: astrocyte; astrocyte network; gap junction; metabolism; neurodegeneration.


Conflict of interest statement

The authors declare no competing interest.

Figures
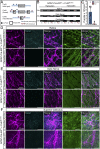
Fig. 1.
Fig. 1.
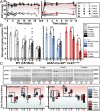
Cx43 reduction in GFAP-Cre-ERT2 x Cx43flox/flox mice. (A) Conditional mutagenesis of Cx43flox/flox showing primers (arrows) for genotyping (blue) and verification of excision (red). (B) PCR products from nervous tissue in Cx43flox/flox with genotype (G) and KO verification following induction. (C) Cx43+ puncta/mm3 decreased in KO retina, optic nerve, and SC compared to KO-Ctrl (P < 0.001; mouse numbers indicated). (DF) KO reduces Cx43 immunolabel in GFAP-expressing astrocytes compared to KO-Ctrl. CTB labels retinal ganglion cells and their axon projections. (Scale bars, 40 μm in D and E and 20 μm in F.)
Fig. 2.
Fig. 2.
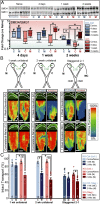
Glycogen redistribution through astrocyte Cx43. (A) Elevated (Δ, +35%) vs. contralateral (C) IOP in WT (Left) and transgenic (Right) mouse eyes. (B) In WT mice (Left), microbead-elevated (M) IOP reduces glycogen vs. naïve (N) optic nerve (#P ≤ 0.005). Glycogen diminishes with elevated IOP after 4 d but increases at 1 and 2 wk vs. contralateral (C, *P ≤ 0.05). For transgenic mice (Right), elevation decreases glycogen for both KO-Ctrl and KO vs. each respective naïve (#P ≤ 0.02). In KO-Ctrl mice, glycogen decreases after 4 d elevation but increases after 1 wk vs. contralateral nerve (*P ≤ 0.01); for KO, glycogen decreases with both elevations vs. contralateral (*P < 0.001). In KO-Ctrl, elevation increased glycogen compared to contralateral (*P = 0.04), while in KO the opposite occurred (*P < 0.001). (C) Western blots probing pAMPK, AMPK, and GPBB in naïve optic nerves (naïve GPBB Ctrl SEM ± 0.149, KO SEM ± 0.28; naïve pAMPK/AMPK Ctrl SEM ± 0.17, KO SEM ± 0.35) and in contralateral (C) vs. 4 d and 1- and 2-wk microbead (M) nerves (Upper). The pAMPK/AMPK ratio (Lower Left) increases in KO-Ctrl nerves (microbead and contralateral) vs. respective naïve (n = 6) for 4 d (n = 5) and 2 wk (n = 5) and in contralateral only at 1-wk (n = 6) microbead elevation (*P ≤ 0.04); ratio in KO nerves (M and C) does not change vs. respective naïve (n = 6, P ≥ 0.20) and is less than ratio in KO-ctrl contralateral for all times (n = 4, n = 7, n = 5; *P ≤ 0.01). Ratio in KO-ctrl contralateral exceeds microbead at 1 wk (*P = 0.05), while microbead exceeds contralateral at 2 wk (*P = 0.02). Fold-change in GPBB (Lower Right) is increased at 4 d in KO-Ctrl contralateral vs. microbead nerves (*P = 0.04) and in KO microbead vs. contralateral and vs. KO-Ctrl microbead nerves (*P ≤ 0.03). At 1 wk, GPBB increased vs. respective naïve in KO-Ctrl and KO nerves from both eyes (*P ≤ 0.002) and in KO-Ctrl contralateral vs. microbead and vs. KO contralateral (*P ≤ 0.04); GPBB increased more in KO microbead vs. contralateral (*P = 0.03).
Fig. 3.
Fig. 3.
Astrocyte coupling increases bilaterally after unilateral stress. Gap junction coupling of astrocytes in naïve (A), contralateral (B), and microbead (C) retinas following 1 wk of unilateral IOP elevation in GFAP-eGFP (green) mice. Coupling visualized by diffusion of neurobiotin (postlabeled with streptavidin-405, blue) dialyzed during patch-clamp physiological recording from astrocytes filled by injection of rhodamine dextran (red), which is too large to permeate gap junctions (67). Lower row shows higher magnification of boxed area. (D) When gap junctions were blocked with carbenoxolone (CBX), neurobiotin no longer transferred between astrocytes. (E) Current responses to voltage-steps (Inset) confirm astrocytes did not produce action potentials. (F) Distance to furthest neurobiotin-labeled astrocyte (biotin signal <20% above background and colocalized with GFAP-bearing cell body) from injected cell (identified with rhodamine dextran) significantly increased in contralateral and microbead retinas compared to naïve (#P < 0.001); coupling in microbead significantly greater than contralateral (*P = 0.007).
Fig. 4.
Fig. 4.
IOP elevation causes metabolite transfer from unstressed tissue through astrocyte gap junctions. (A) One week of unilateral microbead-induced (M) IOP elevation in experimental (vs. naïve) mice followed by contralateral injection of 18F-FDG, a radioactive glucose analog, to determine metabolite transfer between optic projections. (B–F) Representative PET (color) and CT (greyscale) images in naïve (B, n = 10) and microbead-elevated (C, n = 12) WT cohorts, microbead-elevated KO-Ctrl (D, n = 7), and naïve (E, n = 11) and microbead-elevated (F, n = 7) KO mice. (G) Unilateral IOP elevation in WT mice increased contralateral transfer from the unstressed eye by 324% (*P < 0.001). KO produced a 272% reduction in transferred 18F-FDG compared to KO-Ctrl and WT (*P < 0.001). (H) Bladder radioactivity did not differ among groups. (I) When the donating nerve is transected in microbead-elevated mice prior to PET, metabolite transfer no longer occurs; sham surgery (J) does not impact metabolite transfer. (K) Metabolite transfer in the sham (S) condition was significantly elevated above transection (T; *P = 0.025). (L). Both transection and sham resulted in similar bladder 18F-FDG content (P = 0.48).
Fig. 5.
Fig. 5.
Cx43 KO rescues contralateral CAP during glucose depletion. (A) CAP recorded at 5-min intervals as integral of positive voltage response (gray area) to depolarizing pulse. Measurements over 90 min (Inset) from baseline recordings (light blue) in d-glucose (Inset, D), glucose depletion with l-glucose (Inset, L, medium blue), and recovery in D-glucose (dark blue). (B) CAP for naïve WT and KO nerves did not differ (P ≥ 0.09). (C) CAP for WT contralateral diminished compared to IOP-stressed nerve (*P ≤ 0.04); KO rescues contralateral response compared to IOP-stressed nerve (D; *P ≤ 0.04).
Fig. 6.
Fig. 6.
Cx43 KO accelerates axonopathy in the optic projection. (A, Upper) Western blots probing hyperphosphorylated (SMI34) and phosphorylated (SMI31) intermediate filaments in KO and KO-Ctrl optic nerves following unilateral IOP elevation. (Lower) For KO-Ctrl, the ratio of SMI34/31 increased significantly over genotype naïve (#; Ctrl SEM ± 0.09, KO SEM ± 0.22) in both microbead and contralateral nerves after 4 d of unilateral elevation (n = 5), in microbead at 1 wk (n = 6), and in the contralateral nerve at 2 wk (n = 5). At 2 wk, KO-Ctrl microbead was less than its contralateral and the KO microbead (*). For KO microbead, SMI34/31 exceeded its genotype naïve at 4 d (n = 5), 1 and 2 wk (n = 8, 5). In contrast to KO-Ctrl, at 2 wk KO microbead exceeded naïve while contralateral was less (#). #P ≤ 0.02; *P ≤ 0.006. (B, Top) Contralateral (C) eye is naïve for unilateral 1- and 2-wk IOP elevations via microbead (M) injection, in staggered cohort (Right), contralateral received microbead injection (MC) 1 wk later. Both eyes underwent OMR assessment. All eyes received CTB prior to killing. IOPs in SI Appendix, Fig. S2. (Bottom) Coronal section (Middle) through SC demonstrating intact (solid white line) vs. degraded (dashed) anterograde transport. Reconstructed SC retinotopic maps range from 100% (red) to 0% (blue) transport. M: medial; R: rostral. (Scale bars, 500 μm.) (C) Intact transport (percent map with ≥70% CTB) for KO-Ctrl vs. KO in 1-wk (Left), 2-wk (Center), and staggered (Right) cohorts. One-week elevation in KO mice reduced transport vs. the contralateral SC (*P = 0.002) and vs. the corresponding KO-Ctrl SC (*P = 0.03). Two weeks reduced transport in KO-Ctrl (*P = 0.020) and KO (*P < 0.001) vs. unstressed contralateral, while KO deficits exceeded KO-Ctrl (*P = 0.01). In the staggered cohort, transport reduced after 1-wk (MC) and 2-wk (M) elevations in KO-Ctrl vs. unilateral 1- and 2-wk (#P ≤ 0.008) and in 2- (M) vs. 1-wk (MC) KO SC (*P = 0.04).
Fig. 7.
Fig. 7.
Cx43 KO causes rapid deterioration of visual function. Spatial acuity (cycles/degree) determined from OMR for KO-Ctrl (n = 9) and KO (n = 10) mice in staggered cohort following initial microbead injection (M, arrow) and subsequent injection in contralateral eye (MC, arrow); IOP in SI Appendix, Fig. S2. Acuity did not differ for the first four measurements in any group (P ≥ 0.11). Acuity in eye with first elevation (M) for KO-Ctrl and KO diminished below baseline by day 6 (*P < 0.001); decline in KO acuity was worse than KO-Ctrl (P < 0.001). For KO-Ctrl, acuity in the contralateral eye (MC) diminished below baseline by day 9 and continued to decline until the final measurement (*P < 0.001), where it reached acuity in the M eye (P = 0.33). For MC KO eyes, acuity remained above M eye throughout (P < 0.001) and did not decline from baseline until the final measurement (*P < 0.001).
Fig. 8.
Fig. 8.
Summary. KO and control experimental results summarized. For a full table of specific results, see SI Appendix, Table S1.

Similar articles

Cited by

References

    1. Duarte J. M., Girault F. M., Gruetter R., Brain energy metabolism measured by (13)C magnetic resonance spectroscopy in vivo upon infusion of [3-(13)C]lactate. J. Neurosci. Res. 93, 1009–1018 (2015). - PubMed
    1. Falkowska A. et al. ., Energy metabolism of the brain, including the cooperation between astrocytes and neurons, especially in the context of glycogen metabolism. Int. J. Mol. Sci. 16, 25959–25981 (2015). - PMC - PubMed
    1. Mergenthaler P., Lindauer U., Dienel G. A., Meisel A., Sugar for the brain: The role of glucose in physiological and pathological brain function. Trends Neurosci. 36, 587–597 (2013). - PMC - PubMed
    1. Brown A. M. et al. ., Astrocyte glycogen metabolism is required for neural activity during aglycemia or intense stimulation in mouse white matter. J. Neurosci. Res. 79, 74–80 (2005). - PubMed
    1. Swanson R. A., Morton M. M., Sagar S. M., Sharp F. R., Sensory stimulation induces local cerebral glycogenolysis: Demonstration by autoradiography. Neuroscience 51, 451–461 (1992). - PubMed

Publication types