. 2020 Aug 4;117(31):18680-18691.
doi: 10.1073/pnas.2006165117. Epub 2020 Jul 20.

Subdomain cryo-EM structure of nodaviral replication protein A crown complex provides mechanistic insights into RNA genome replication

Affiliations

Subdomain cryo-EM structure of nodaviral replication protein A crown complex provides mechanistic insights into RNA genome replication

Nuruddin Unchwaniwala et al. Proc Natl Acad Sci U S A. .

Abstract

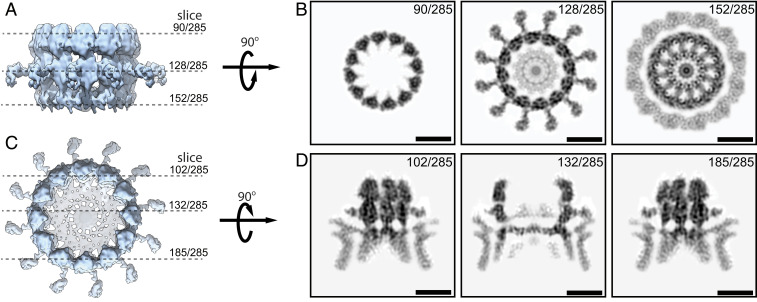
For positive-strand RNA [(+)RNA] viruses, the major target for antiviral therapies is genomic RNA replication, which occurs at poorly understood membrane-bound viral RNA replication complexes. Recent cryoelectron microscopy (cryo-EM) of nodavirus RNA replication complexes revealed that the viral double-stranded RNA replication template is coiled inside a 30- to 90-nm invagination of the outer mitochondrial membrane, whose necked aperture to the cytoplasm is gated by a 12-fold symmetric, 35-nm diameter "crown" complex that contains multifunctional viral RNA replication protein A. Here we report optimizing cryo-EM tomography and image processing to improve crown resolution from 33 to 8.5 Å. This resolves the crown into 12 distinct vertical segments, each with 3 major subdomains: A membrane-connected basal lobe and an apical lobe that together comprise the ∼19-nm-diameter central turret, and a leg emerging from the basal lobe that connects to the membrane at ∼35-nm diameter. Despite widely varying replication vesicle diameters, the resulting two rings of membrane interaction sites constrain the vesicle neck to a highly uniform shape. Labeling protein A with a His-tag that binds 5-nm Ni-nanogold allowed cryo-EM tomography mapping of the C terminus of protein A to the apical lobe, which correlates well with the predicted structure of the C-proximal polymerase domain of protein A. These and other results indicate that the crown contains 12 copies of protein A arranged basally to apically in an N-to-C orientation. Moreover, the apical polymerase localization has significant mechanistic implications for template RNA recruitment and (-) and (+)RNA synthesis.

Keywords: cryotomography; nodavirus; positive-strand RNA virus; replication complexes; replication crown.


Conflict of interest statement

The authors declare no competing interest.

Figures

Fig. 1.
Fig. 1.
Genome organization and protein ORFs of FHV. The bipartite FHV genome, (+)RNA1 and (+)RNA2, express protein A and capsid protein, respectively. Protein A is the master FHV RNA replication protein that is involved in various functions such as membrane association (transmembrane domain and a possible membrane-interacting domain in the Iceberg region), replication complex formation, RNA 5′ capping, and RdRp enzymatic activities. The various functional domains of protein A are highlighted in the ORF and their amino acid coordinates are marked above the ORF. Note that both the indicated core RNA-capping domain and the adjacent Iceberg domain appear to contribute to RNA-capping functions (20). Protein A replicates the viral RNAs to form minus-sense products, likely as dsRNA. During minus-strand synthesis, a FHV RNA1 3′ end coterminal (−)RNA3 is synthesized, which in turn replicates to make the (+)RNA3. RNA3 codes for the B1 and B2 proteins. B1 is a preferentially nuclear protein with unknown function, whereas B2 is a well-established RNAi suppressor.
Fig. 2.
Fig. 2.
Improved cryo-ET procedures to visualize FHV replication complexes at the mitochondria. (A) Section of the reconstructed tomogram showing the side view of FHV replication complexes. Various spherules and the OMM are highlighted with black arrowheads. (B) Section of the reconstructed tomogram showing the top view of the OMM with FHV replication complex crowns. (C and D) Insets of A and B showing a zoomed-in view of a single spherule and three top views of the crown, respectively. (E) False-color representation of C highlighting the various densities and subcellular regions at the replication complex. Blue, crown side view; white, OMM; red, densely coiled internal fibril; translucent orange, cytoplasm; and translucent green, mitochondrial intermembrane space (IMS). (F) False-color representation of D highlighting the top view of the OMM (translucent white), and the crowns (blue).
Fig. 3.
Fig. 3.
Subtomogram averaging of the crown structure reveals important new structural details. (A) High-density threshold (contour level = 4.2) side view of the crown. The dotted gray line through the A, B, and C map the OMM for point of reference. (Inset) Region in A marking the three structurally distinct regions in the crown: apical lobe, basal lobe, and leg. (B) Cross-section view of the low-density threshold crown (from C) as a transparent white shell encasing the high-density crown (from A) in blue. Asterisks indicate unusual densities bridging between denser head group regions of the lipid bilayer, and the dashed lines below the crown depict the continuation of the reshaped OMM into the body of the spherule RNA replication vesicle. (C) Low-density threshold (contour level = 2) side view of the crown show the additional density contributions made by the membrane. (D) Top view of the high-density threshold crown highlights the 12-fold symmetry of the crown complex. (E) Bottom view of the high-density threshold crown.
Fig. 4.
Fig. 4.
Two-dimensional slices of the crown electron-density map display the higher-resolution substructure. (A and B) High-density threshold side view of the crown with dotted lines representing the slices shown in B after 90° rotation. (C and D) High-density threshold top-view of the crown with dotted lines representing the slices shown in D after 90° rotation. (Scale bars in B and D, 10 nm.)
Fig. 5.
Fig. 5.
C terminus of protein A is exposed at the mitochondria in cells replicating FHV. (A) RNA1-GFP11-ΔB1 construct incorporates three distinct changes: 1) M897L amino acid change to knock out B1 expression, 2) *999R amino acid change to extend protein A ORF, and 3) C-terminal extension of protein A ORF to express a 16-aa GFP11 sequence (amino acids 1,008 to 1,023). RNA1-His-ΔB1 disrupts the GFP11 sequence to incorporate the His-tag at amino acid positions 1010 to 1015 within protein A. (B) Northern blot analysis on RNA isolated from cells transfected with the indicated FHV RNA1 expression plasmids to compare in cis RNA replication capacity of the encoded protein A fusions. fs = RNA1fs, GFP11 = RNA1-GFP11-ΔB1, His = RNA1-His-ΔB1, and WT = RNA1-WT. Ribosomal RNA (rRNA) shown as a loading control. RNA1fs is a full-length RNA1 derivative in which an engineered frameshift blocks protein A expression (39). (C) Widefield fluorescence microscopy of S2 cells. (Upper) Cells transfected with expression plasmids RNA1-WT and GFP1-10 and (Lower) cells transfected with RNA1-GFP11- ΔB1 and GFP1-10 plasmids. Immunostained protein A is shown in red and GFP fluorescence shown in cyan. The Merge image includes the three channels to the left. (D) In vitro complementation of mitochondria from FHV-WT or FHV-GFP11-∆B1 infected S2 cells with E. coli-purified MBP-GFP1-10 and measurement of GFP fluorescence over time. (E) Widefield immunofluorescence analysis of S2 cells infected with FHV-WT or FHV-His-ΔB1. S2 cells costained with antibodies against protein A and His-tag.
Fig. 6.
Fig. 6.
Site-specific nanogold labeling maps the protein A polymerase domain to the distal lobe of the crown. (A) Experimental scheme for infection, isolation, and native labeling of His-tagged protein A with 5-nm Ni-NTA-nanogold for cryo-ET imaging. (B) Reconstructed tomograms of mitochondria isolated from FHV-WT (Left) or FHV-His-ΔB1 (Right) after nanogold-labeling. The white arrowheads indicate 10-nm fiducial gold used for alignment during tomogram reconstruction of both samples. The yellow arrowheads indicate the 5-nm Ni-NTA-nanogold. (Right Insets) Two individual spherules showing nanogold-labeling. (C) Representative nanogold-labeled subtomograms from a higher resolution cryo-ET dataset. (D) Subtomogram averaging of nanogold-labeled and unlabeled crowns. Unlabeled = 141 unlabeled crowns used for averaging. Unlabeled + nanogold labeled = 141 unlabeled crown + 184 gold labeled crowns included in averaging. Overlay = Unlabeled crown in blue overlayed with a mesh view of the unlabeled + nanogold-labeled crown in yellow. The black arrow highlights the major additional densities contributed by the nanogold appearing at the apex of the crown.
Fig. 7.
Fig. 7.
Protein A polymerase secondary structure prediction and fitting into the EM density map. (A) iTasser predicted secondary structure of protein A polymerase domain (Pol-Pred, amino acids 453 to 896) shown to the left with the product-exit face in the front. The top four iTasser structural analogs shown (high to low, left to right) in the same orientation as the FHV-predicted polymerase domains. (B) Manual C terminus up and down fit of Pol-Pred into the EM density map. The Pol-Pred structure is rainbow colored from the N to the C terminus going from blue to red. The N-to-C color key is also shown to the right. (C) Top two fits (based on correlation score) obtained from fitting Pol-Pred into the segmented apical lobe using the rigid-body docking tool in Segger.
Fig. 8.
Fig. 8.
Dodecameric arrangement of protein A to form the crown complex. (A) Tilted side view of the crown with alternate segments of the 12-fold symmetric crown colored in blue and white. The floor densities are shown in transparent white with black silhouette. (B) Single predicted protein A segment shown in two-color in side view with the mapped polymerase domain in yellow and remainder of protein A N-terminal densities in blue. The remaining crown segments are shown in transparent white with black silhouettes for unobstructed viewing of the highlighted crown segment. The asterisks mark the two separate membrane-interaction sites of each crown segment. A protein A linear map from the N terminus to the C terminus is shown to the right with the same color scheme as the density map. The asterisks in the protein A linear map indicate the well-characterized N-terminal transmembrane domain TM and the possible membrane-interaction domain within the Iceberg region.

Similar articles

Cited by

References

    1. den Boon J. A., Diaz A., Ahlquist P., Cytoplasmic viral replication complexes. Cell Host Microbe 8, 77–85 (2010). - PMC - PubMed
    1. Harak C., Lohmann V., Ultrastructure of the replication sites of positive-strand RNA viruses. Virology 479–480, 418–433 (2015). - PMC - PubMed
    1. Maier H. J. et al. ., Extensive coronavirus-induced membrane rearrangements are not a determinant of pathogenicity. Sci. Rep. 6, 27126 (2016). - PMC - PubMed
    1. Knoops K. et al. ., SARS-coronavirus replication is supported by a reticulovesicular network of modified endoplasmic reticulum. PLoS Biol. 6, e226 (2008). - PMC - PubMed
    1. Kopek B. G., Perkins G., Miller D. J., Ellisman M. H., Ahlquist P., Three-dimensional analysis of a viral RNA replication complex reveals a virus-induced mini-organelle. PLoS Biol. 5, e220 (2007). - PMC - PubMed

Publication types

MeSH terms

LinkOut - more resources