. 2020 Oct;16(10):1052-1061.
doi: 10.1038/s41589-020-0584-z. Epub 2020 Jul 20.

Pharmacologic IRE1/XBP1s activation confers targeted ER proteostasis reprogramming

Affiliations

Pharmacologic IRE1/XBP1s activation confers targeted ER proteostasis reprogramming

Julia M D Grandjean et al. Nat Chem Biol. 2020 Oct.

Abstract

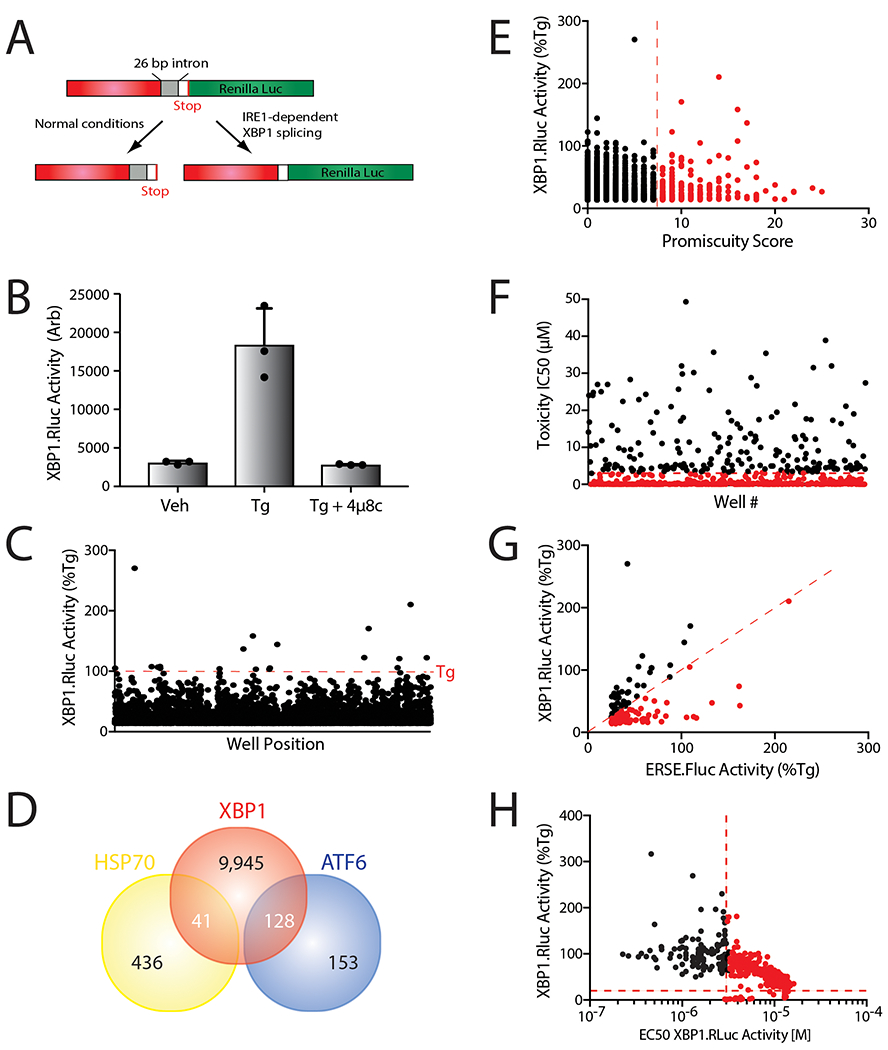
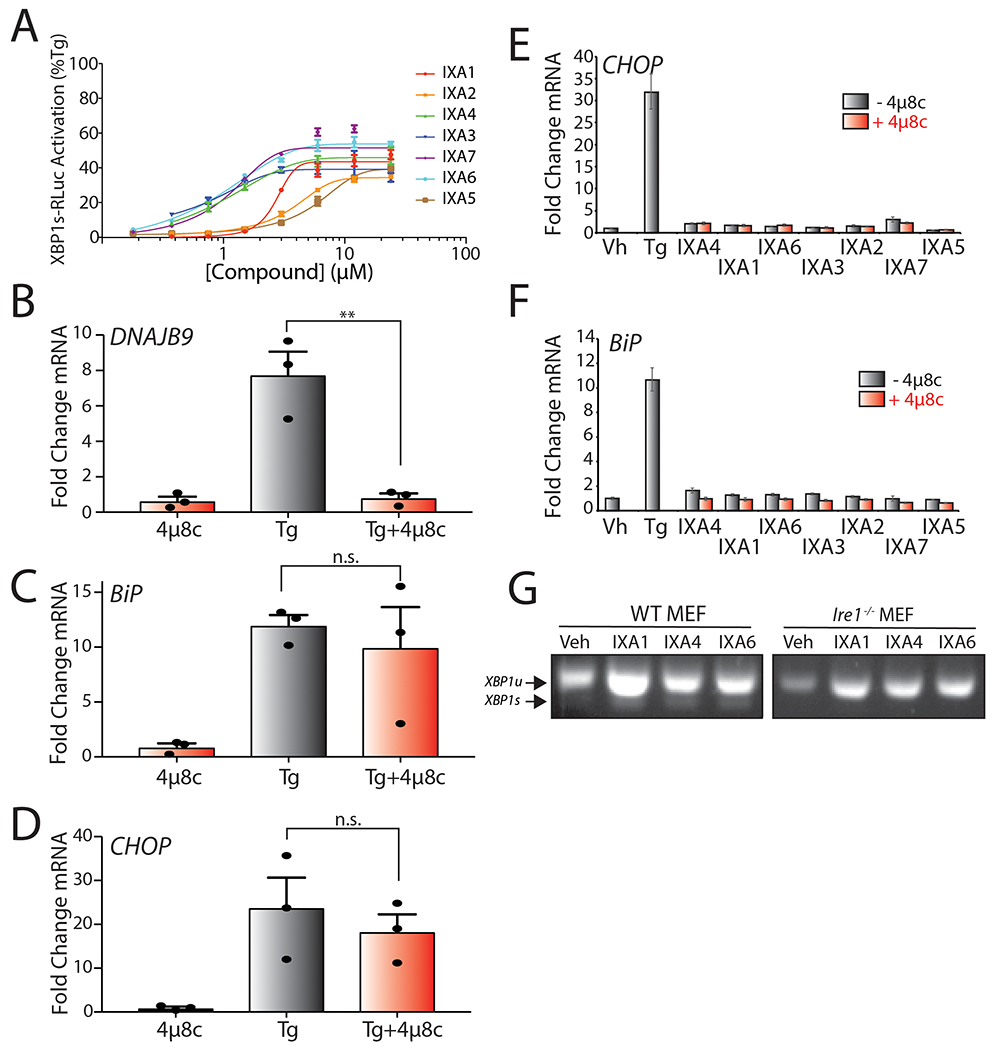
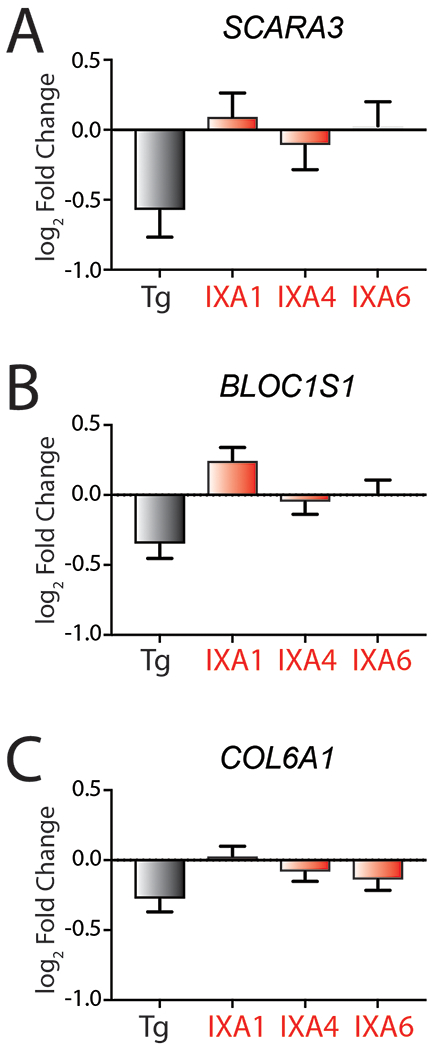
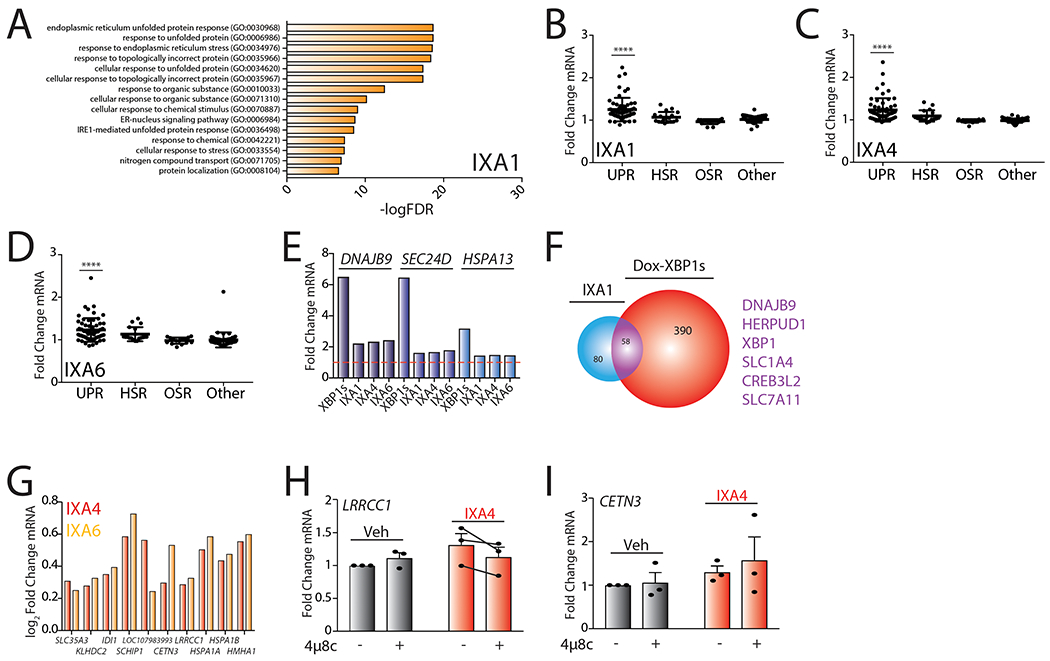
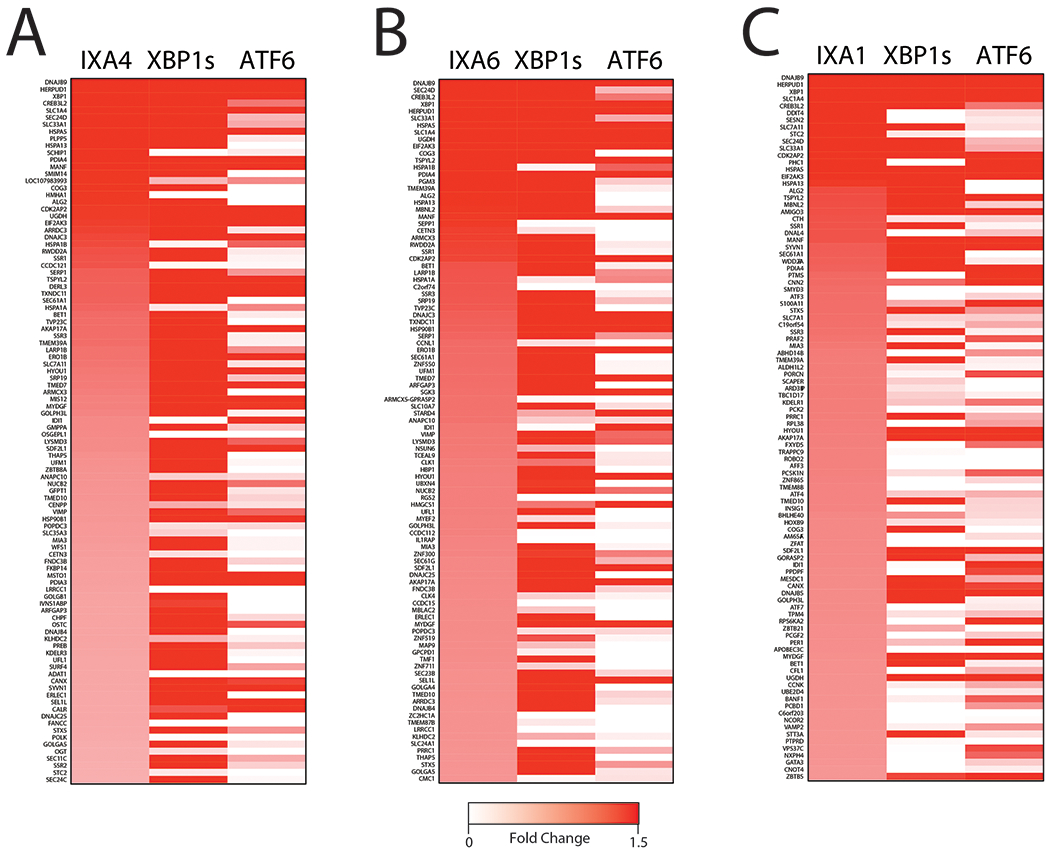
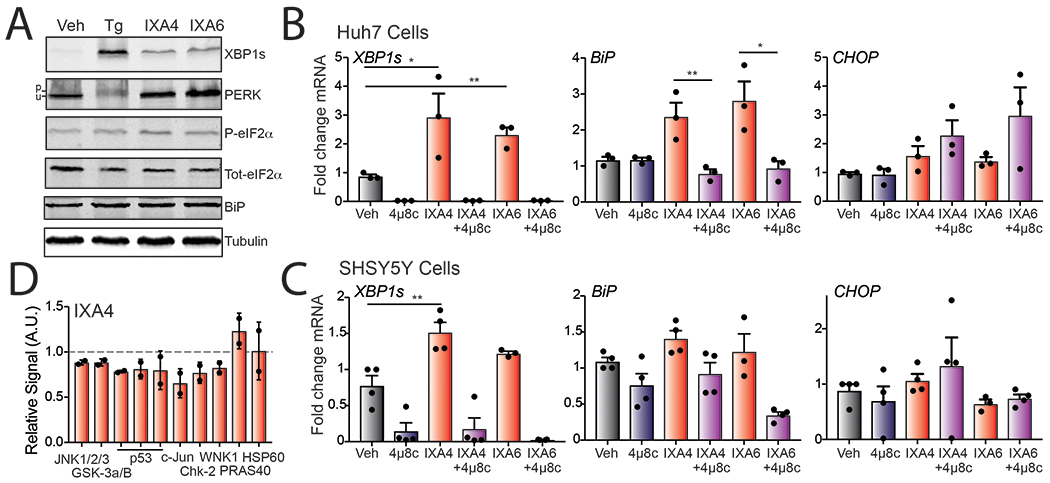
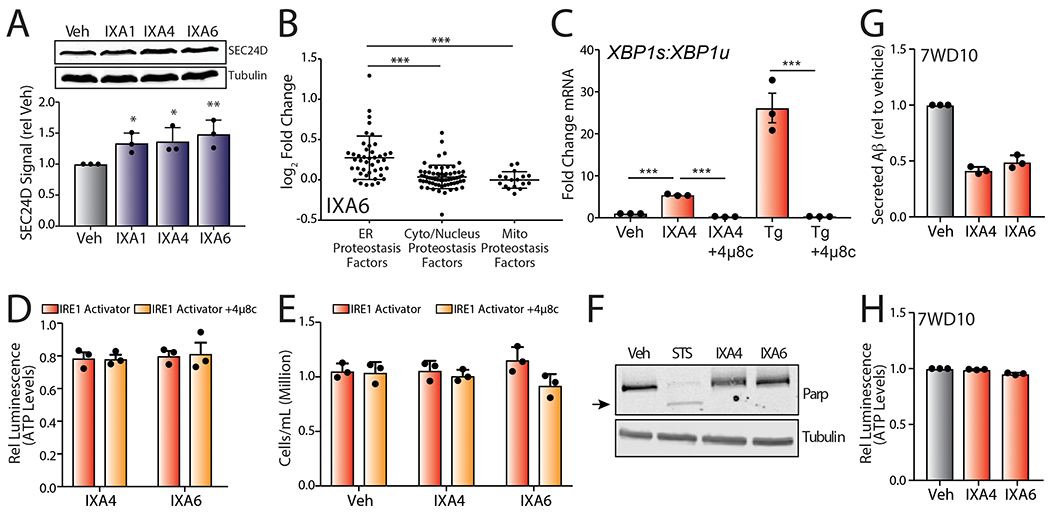
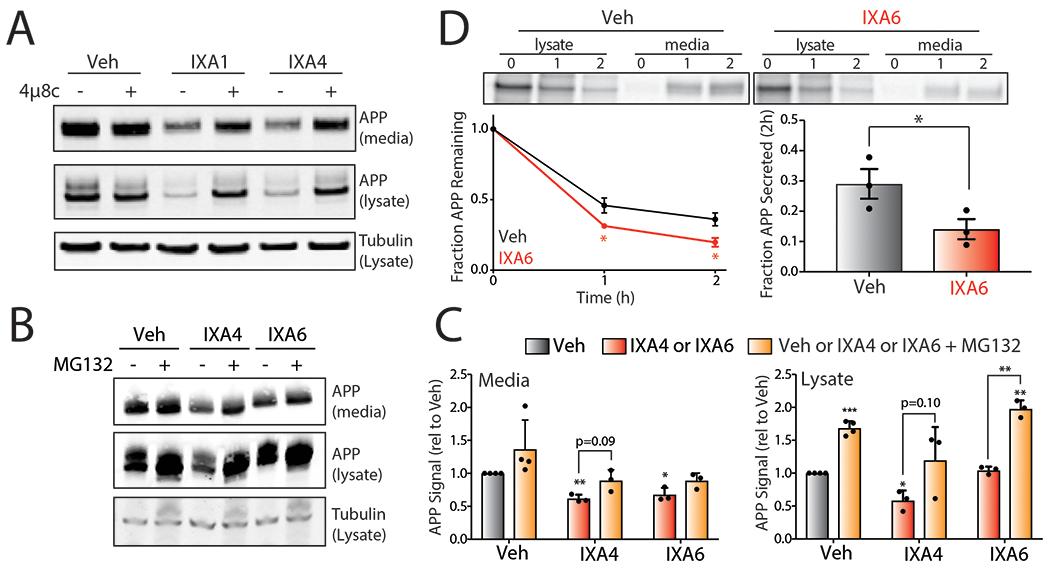
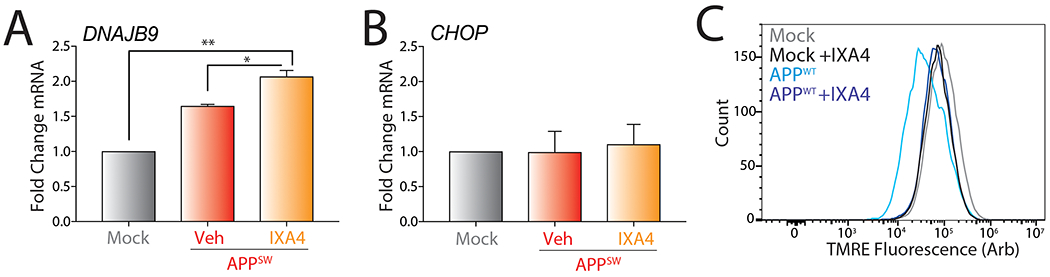
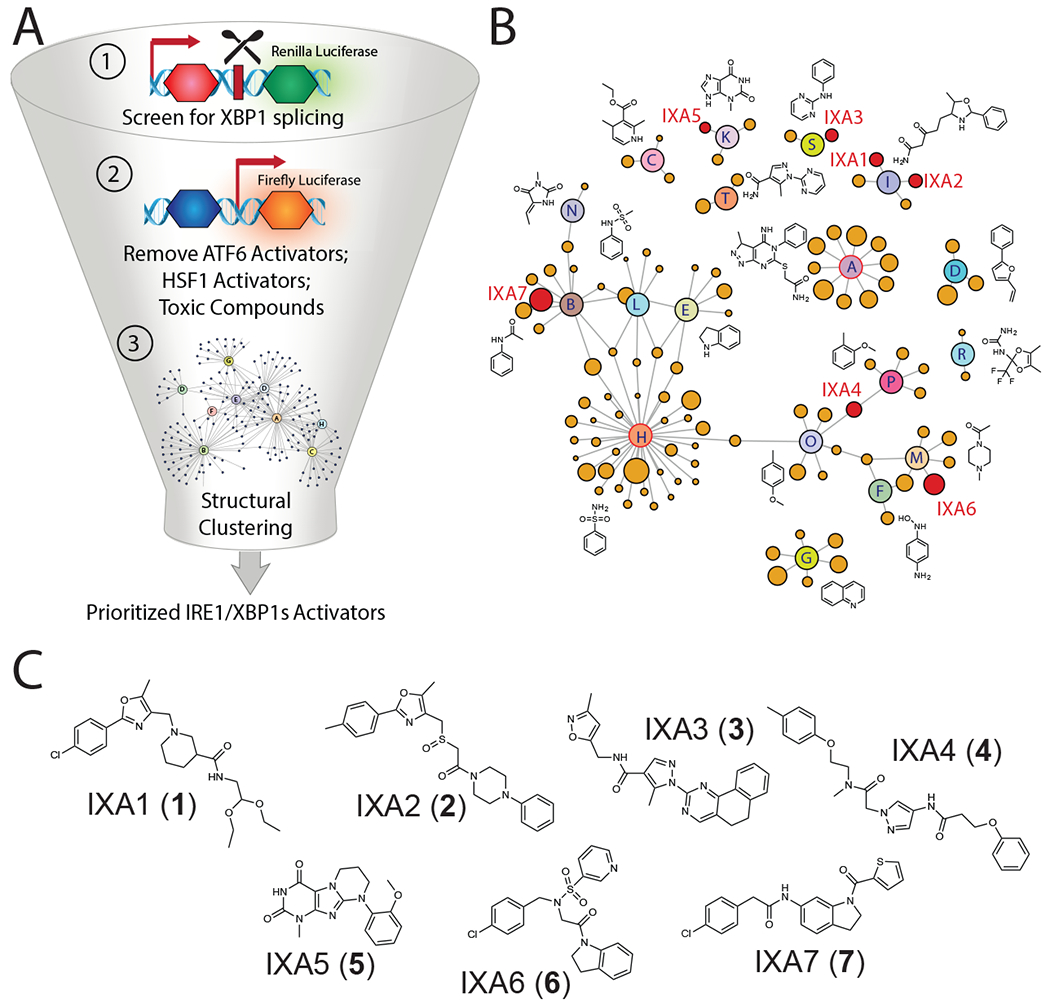
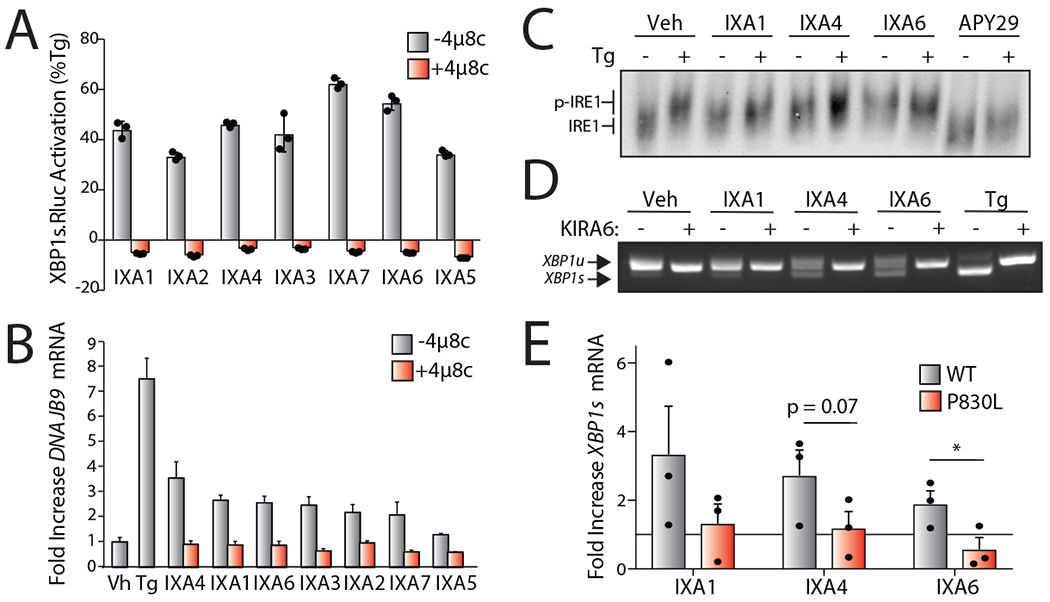
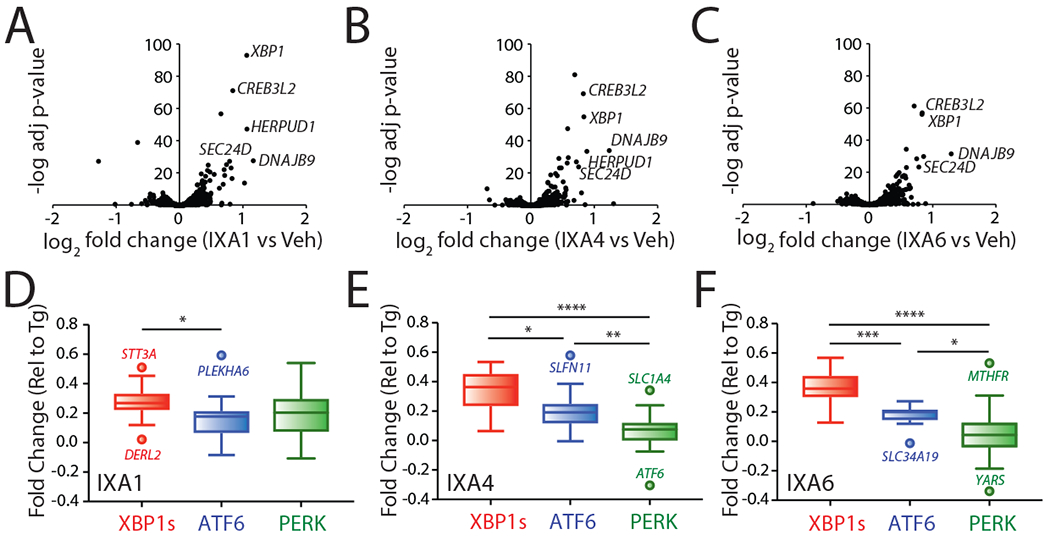
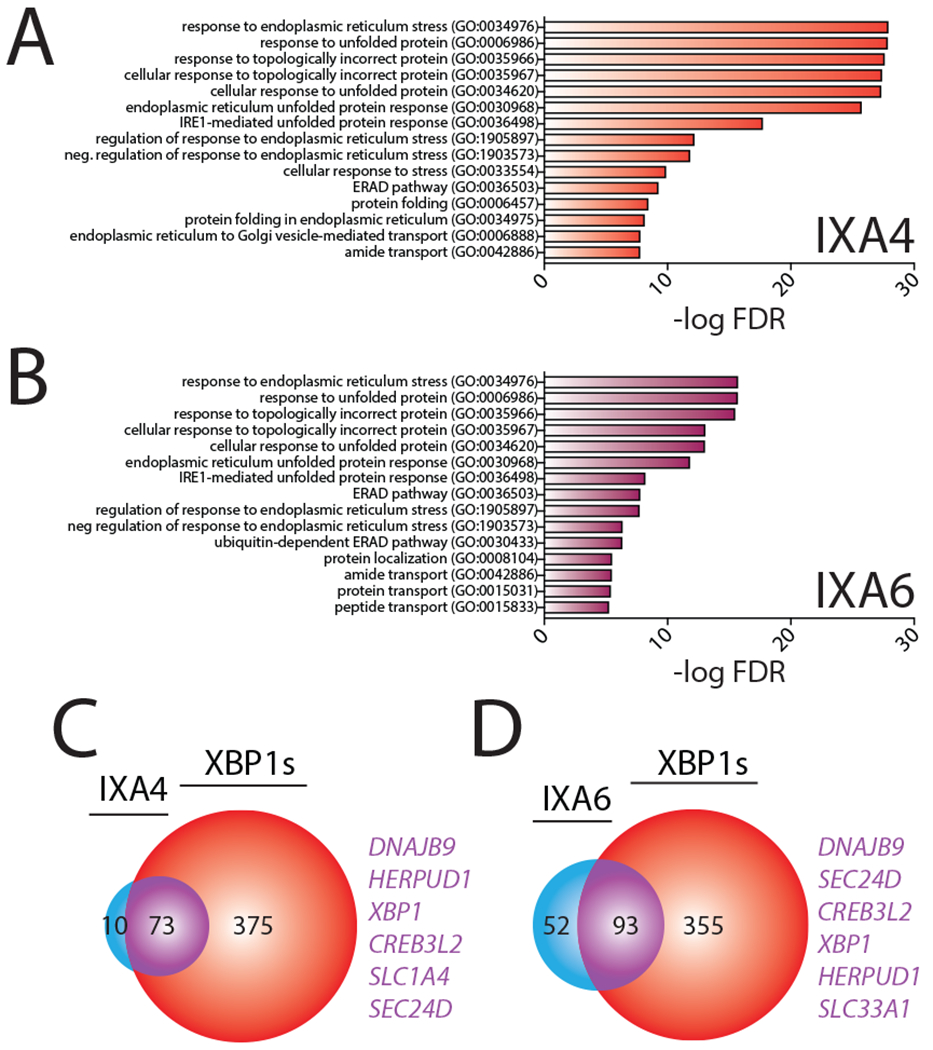
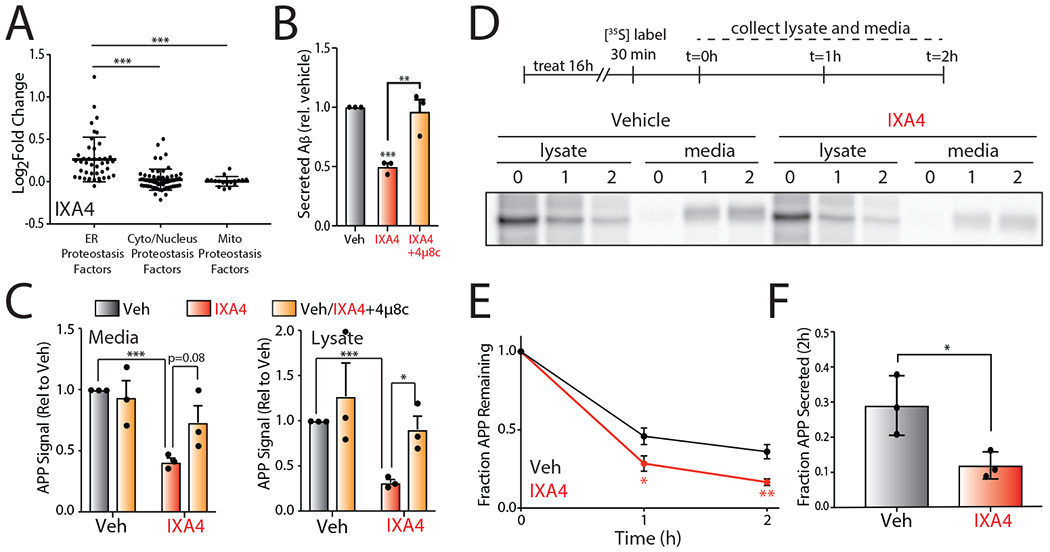
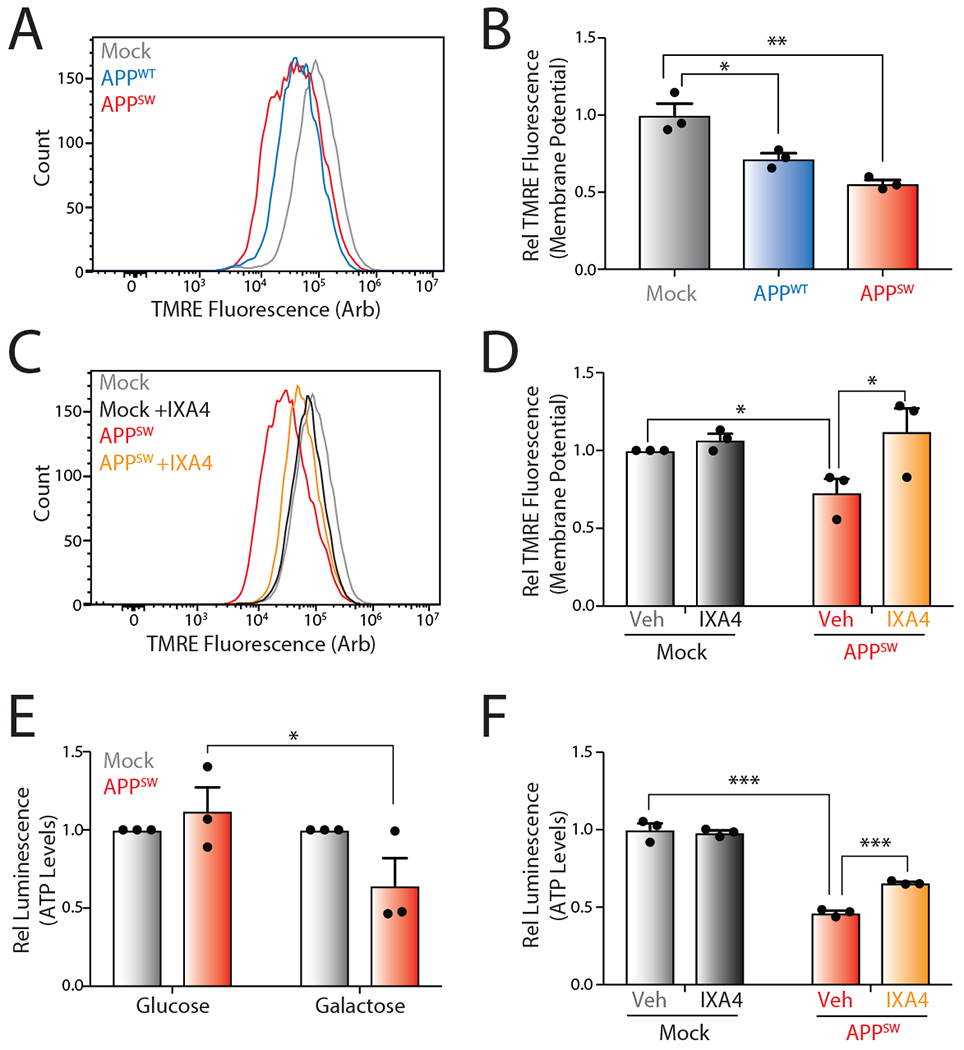
Activation of the IRE1/XBP1s signaling arm of the unfolded protein response (UPR) is a promising strategy to correct defects in endoplasmic reticulum (ER) proteostasis implicated in diverse diseases. However, no pharmacologic activators of this pathway identified to date are suitable for ER proteostasis remodeling through selective activation of IRE1/XBP1s signaling. Here, we use high-throughput screening to identify non-toxic compounds that induce ER proteostasis remodeling through IRE1/XBP1s activation. We employ transcriptional profiling to stringently confirm that our prioritized compounds selectively activate IRE1/XBP1s signaling without activating other cellular stress-responsive signaling pathways. Furthermore, we demonstrate that our compounds improve ER proteostasis of destabilized variants of amyloid precursor protein (APP) through an IRE1-dependent mechanism and reduce APP-associated mitochondrial toxicity in cellular models. These results establish highly selective IRE1/XBP1s activating compounds that can be widely employed to define the functional importance of IRE1/XBP1s activity for ER proteostasis regulation in the context of health and disease.


Conflict of interest statement

COMPETING INTERESTS STATEMENT

Jeffrey W. Kelly is a co-founder of Proteostasis Therapeutics Inc. A patent has been submitted for compounds identified through work described in this manuscript. This patent includes R. Luke Wiseman, Jeffery W. Kelly, Julia M.D. Grandjean, Lars Plate, and Christina B. Cooley as co-inventors. No other author has a conflict of interest.

Figures

Extended Data Fig. 1
A. Schematic of the XBP1-Renilla luciferase (XBP1-RLuc) splicing reporter used in our high-throughput screen to identify small molecule activators of IRE1/XBP1s signaling. B. Graph showing XBP1-RLuc splicing reporter activation in HEK293TREX cells incubated with Tg (500 nM) in the presence or absence of 4μ8c (64 μM) for 16 hrs. Error bars show SD for n=3 replicates. C. Plot showing XBP1-RLuc activation in HEK293TREX cells stably expressing the XBP1-RLuc reporter treated with the 10,114 small molecules (6 μM; 18 hrs) identified as hits in the primary screen. Luminescence is shown as % signal relative to treatment with Tg (500 nM; 18 hrs). D. Venn diagram of overlap of compounds identified to activate the IRE1-dependent XBP1-RLuc splicing reporter, the ATF6-selective ERSE-FLuc reporter, or the HSF1-dependent HSP70-FLuc reporter via high-throughput screening. E. Plot showing XBP1-RLuc activation HEK293TREX cells (% signal compared to that observed with 500 nM Tg, 18 hrs) versus promiscuity score for our top 638 compounds identified by HTS. The promiscuity score reports on the number of assays performed at the TSRI-FL Screening Center where each compound was identified as a positive hit. F. Plot showing IC50 for toxicity as measured by CellTiterGlo luminescence calculated from titration screening of 638 hit compounds. The dashed red lines indicates IC50 = 3 μM. G. Plot showing IRE1-dependent XBP1-RLuc activation versus ATF6-selective ERSE-Fluc activation in HEK293TREX cells (% signal compared to that observed with 500nM Tg, 18 hrs) for the subset of our top 638 compounds that were also identified to activate the ATF6-selective ERSE-FLuc reporter. The dashed red line indicates equal XBP1s-Rluc and ERSE-Fluc activation. H. Plot showing XBP1-RLuc activation in HEK293TREX cells (% signal compared to that observed with 500nM Tg, 18 hrs) versus EC50 of XBP1-RLuc activation in HEK293TREX cells calculated from titration screening of hit 638 compounds. The dashed red lines indicates 20% Rluc activation and Rluc EC50 = 3μM.
Extended Data Fig. 2
A. Plot showing XBP1-RLuc activation in HEK293TREX cells (% signal compared to that observed with 500nM Tg, 18 hrs) treated for 18 hrs with the indicated concentrations of prioritized IRE1/XBP1s activator. Error bars represent SD for n = 3 replicates. B. Graph showing qPCR of the XBP1 target gene DNAJB9 in HEK293T cells treated for 4 hrs with Tg (500 nM) in the presence or absence of 4μ8c (64 μM). Error bars show SE for n= 3. P-values were calculated using one-tailed Student’s t-test. **p<0.01. C. Graph showing qPCR of the ATF6 target gene BiP in HEK293T cells treated for 4 hrs with Tg (500 nM) in the presence or absence of 4μ8c (64 μM). Error bars show SE for n= 3. P-values were calculated using one-tailed Student’s t-test. D. Graph showing qPCR of the PERK target gene CHOP in HEK293T cells treated for 4 hrs with Tg (500 nM) in the presence or absence of 4μ8c (64 μM). Error bars show SE for n= 3. P-values were calculated using one-tailed Student’s t-test. E. Graph showing qPCR of the PERK target gene CHOP in HEK293T cells treated for 4 hrs with prioritized IRE1/XBP1s activators (10 μM) or Tg (500nM), in the presence or absence of 4μ8c (32 μM). Error bars show 95% CI for n= 3 replicates. F. Graph showing qPCR analysis of the ATF6 target gene BiP in HEK293T cells treated for 4 hrs with indicated compound (10 μM), or Tg (500nM), in the presence or absence of 4μ8c (32 μM). Error bars show 95% CI for n= 3 replicates. G. cDNA gel showing splicing of XBP1 mRNA in WT MEF or Ire1−/− MEF cells treated with IXA1, IXA4, or IXA6 (10 μM) for 4 hrs.
Extended Data Fig. 3
A. Graph showing log2 Fold change mRNA levels from RNAseq for the RIDD target SCARA3 in HEK293T cells treated with 10 μM IXA1, IXA4, IXA6, or 500 nM Tg for 4 hrs. Error bars represent SD for n = 3 replicates. B. Graph showing log2 Fold change mRNA levels from RNAseq for the RIDD target BLOC1S1 in HEK293T cells treated with 10 μM IXA1, IXA4, IXA6, or 500 nM Tg for 4 hrs. Error bars represent SD for n = 3 replicates. C. Graph showing log2 Fold change mRNA levels from RNAseq for the RIDD target COL6A1 in HEK293T cells treated with 10μM IXA1, IXA4, IXA6, or 500nM Tg for 4 hrs. Error bars represent SD for n = 3 replicates.
Extended Data Fig. 4
A. Gene Ontology (GO) analysis of differentially expressed genes from RNAseq for HEK293T cells treated with IXA1 (10 μM, 4hrs). Top 15 entries with lowest FDR are shown. See Supplementary Table 4 for full GO analysis. B. Graph showing fold change mRNA levels from RNAseq of target genes activated downstream of the UPR, HSR, OSR, and other stress signaling pathways in HEK293T cells treated with IXA1 (10 μM) for 4 hrs. The composition of these genesets is shown in Source Data Table 3. P-values were calculated using one-way ANOVA compared to “Other”. ****p<0.0001. C. Graph showing fold change mRNA levels from RNAseq of target genes activated downstream of the UPR, HSR, OSR, and other stress signaling pathways in HEK293T cells treated with IXA4 (10μM) for 4 hrs. The composition of these genesets is shown in Source Data Table 3. P-values were calculated using one-way ANOVA compared to “Other”. ****p<0.0001. D. Graph showing fold change mRNA levels from RNAseq of target genes activated downstream of the UPR, HSR, OSR, and other stress signaling pathways in HEK293T cells treated with IXA6 (10μM) for 4 hrs. The composition of these genesets is shown in Source Data Table 3. P-values were calculated using one-way ANOVA compared to “Other”. ****p<0.0001. E. Bar graph showing fold change mRNA levels of the IRE1/XBP1s targets DNAJB9, SEC24D, and HSPA13 from RNAseq of HEK293DAX cells expressing dox-inducible XBP1s treated with dox (1 μg/mL) for 4 hr or HEK293T cells treated with compounds IXA1, IXA4, or IXA6 (10 μM) for 4 hrs. F. Venn diagram of genes upregulated >1.2 fold (adjusted p-value <0.05) in HEK293T cells treated with compound IXA1 (10 μM) for 4 hrs in comparison to genes induced >1.2 fold (adjusted p-value < 0.05) in HEK293DAX cells treated with doxycycline (1 μg/mL) for 4 hrs. Genes listed in purple are top overlapping targets between conditions. G. Graph showing log2Fold Change mRNA levels from RNAseq of the 10 non-overlapping genes activated in cells treated with IXA4 (10μM) compared to dox-inducible XBP1s. Log2Fold change mRNA levels of these genes in cells treated with IXA6 (10μM) are also included. H. Graph showing qPCR of the LRRCC1 gene in 293T cells treated with IXA4 (10 μM) in the presence or absence of 4μ8c (64μM) for 4 hrs. Error bars show SE for n= 3. I. Graph showing qPCR of the CETN3 gene in 293T cells treated with IXA4 (10 μM) in the presence or absence of 4μ8c (64μM) for 4 hrs. Error bars show SE for n= 3.
Extended Data Fig. 5
A. Heat map of top 100 genes upregulated in HEK293T cells treated for 4 hrs with IXA4 (10 μM) compared to dox-inducible XBP1s or TMP-stabilized DHFR.ATF6 in HEK293DAX cells treated with doxycycline (1 μg/mL) or TMP (10 μM) for 4 hr. B. Heat map of top 100 genes upregulated in HEK293T cells treated for 4 hrs with IXA6 (10μM) compared to dox-inducible XBP1s or TMP-stabilized DHFR.ATF6 in HEK293DAX cells treated with doxycycline (1 μg/mL) or TMP (10μM) for 4 hrs. C. Heat map of top 100 genes upregulated in HEK293T cells treated for 4 hr with IXA1 (10 μM) compared to dox-inducible XBP1s or TMP-stabilized DHFR.ATF6 in HEK293DAX cells treated with doxycycline (1 μg/mL) or TMP (10 μM) for 4 hrs.
Extended Data Fig. 6
A. Representative immunoblots of XBP1s, PERK, eIF2α, and BiP in lysates prepared from HEK293T cells treated with vehicle, thapsigargin (1μM), IXA4 (10μM), or IXA6 (10 μM) for 4 hrs. B. Graph showing qPCR of the XBP1 target gene DNAJB9, ATF6 target gene BiP, and PERK target gene CHOP in Huh-7 cells treated with IXA4 (10 μM) or IXA6 (10μM) in the presence or absence of 4μ8c (64μM) for 4 hrs. Error bars show SE for n=3 replicates. Statistics calculated from one-tailed Student’s t-test. *p<0.05, **p<0.01. C. Graph showing qPCR of the XBP1 target gene DNAJB9, ATF6 target gene BiP, and PERK target gene CHOP in SHSY5Y cells treated with IXA4 (10 μM) or IXA6 (10μM) in the presence or absence of 4μ8c (64μM) for 4 hrs. Error bars show SE for n=4 replicates. Statistics calculated from one-tailed Student’s t-test. *p<0.05, **p<0.01. D. Graph showing relative signal of phosphorylated target proteins by phosphokinase array dot immunoblotting in HEK293T cells treated with IXA4 (10μM) for 4 hrs. Error bars show SD for n=2.
Extended Data Fig. 7
A. Representative immunoblots and quantification of SEC24D in lysates prepared from HEK293T cells treated with vehicle, IXA1, IXA4, or IXA6 (10 μM, 18 hrs). Error bars show SD for n= 3 replicates. P-values were calculated using one-tailed Student’s t-test. *p<0.05, **p<0.01. B. Plot of log2 Fold Change mRNA levels from RNAseq in cells treated with IXA6 (10μM, 4 hrs) of proteostasis factors found in the ER, cytosol/nucleus, or mitochondria. The composition of these proteostasis genesets is shown in Source Data Table 3. C. Graph showing the Fold change mRNA ratio of Xbp1s:Xbp1u by qPCR in CHO7PA2 cells treated with IXA4 (10 μM) or thapsigargin (1μM) in the presence or absence of 4μ8c (64μM) for 4 hrs. Error bars show SE for n=3 replicates. Statistics calculated from one-tailed Student’s t-test. *p<0.05, **p<0.01. D. Graph showing relative CellTiterGlo luminescence from CHO7PA2 cells treated with IRE1/XBP1s activators IXA4, or IXA6 (10 μM) in the presence or absence of 4μ8c (32 μM). Cells were treated for 18 hrs, media was then replaced and conditioned in the presence of treatments for 24 hrs before measuring ATP levels. Luminescence signal was normalized to that observed in untreated controls. Error bars represent SE for n = 3 replicates. E. Graph showing cell counts (106cells/mL) of CHO7PA2 cells treated with IXA4 or IXA6 (10 μM) in the presence or absence of 4μ8c (64 μM) for 24 hrs. F. Immunoblot of mutant PARP in lysates collected from CHO7PA2 cells treated with IXA4 or IXA6 (10 μM) or staurosporine (1 μM) for 24 hrs. G. Graph showing relative signal from ELISA of secreted Aβ peptide from conditioned media prepared on CHO7WD10 cells treated with IXA4 or IXA6 (10 μM). Cells were pretreated for 18 hrs with compounds. Media was then replaced and conditioned in the presence of compounds for 24 hrs before harvesting the media for ELISA. Secreted Aβ was normalized to that observed in untreated controls. Error bars represent SE for n = 3 replicates. H. Graph showing relative CellTiterGlo luminescence from CHO7WD10 cells treated with IRE1/XBP1s activators IXA4 or IXA6 (10 μM). Cells were treated for 18 hrs, media was then replaced and conditioned in the presence of treatments for 24 hrs before measuring ATP levels. Luminescence signal was normalized to that observed in untreated controls. Error bars represent SE for n = 3 replicates.
Extended Data Fig. 8
A. Representative immunoblot of mutant APP in media and lysates collected from CHO7PA2 cells treated with IXA1 or IXA4 (10 μM) in the presence or absence of 4μ8c (64 μM). Cells were treated for 18 hrs, media was then replaced and conditioned in the presence of treatments for 24 hrs before harvesting. B. Representative immunoblot of mutant APP in media and lysates collected from CHO7PA2 cells treated with IXA4 or IXA6 (10 μM) in the presence or absence of MG132 (10 μM) for 18hrs. C. Quantification of immunoblots represented in panel B of relative APP signal in lysates or conditioned media from CHO7PA2 cells treated with IRE1/XBP1s activators IXA4 or IXA6 (10 μM) in the presence or absence of MG132 (10 μM) for 18hrs. Error bars represent SE for n=4 replicates. Statistics calculated from one-tailed Student’s t-test. *p<0.05, **p<0.01, ***p<0.001. D. Representative autoradiogram showing the [35S] metabolic labeling of mutant APP in CHO7PA2 cells treated with IXA6 (10 μM) for 16 hrs prior to 30 min labeling. Media and lysates were collected at 0, 1, or 2 hrs and [35S]-labeled mutant APP was isolated by immunopurification. The experimental protocol is shown above. Fraction remaining was calculated as described in Fig. 5D and fraction secretion was calculated as in Fig. 5E. Error bars represent SD for n = 3 replicates. P-values were calculated from one-tailed Student’s t-test. *p<0.05.
Extended Data Fig. 9
A. Graph showing qPCR of the XBP1 target gene DNAJB9 in SHSY5Y cells transiently expressing empty vector (Mock) or Swedish mutant APP (APPSW) in the presence or absence of IXA4 (10 μM) for 72 hrs. Error bars show SE for n= 2. Statistics calculated from one-tailed Student’s t-test. *p<0.05, **p<0.01. B. Graph showing qPCR of the PERK target gene CHOP in SHSY5Y cells transiently expressing empty vector (Mock) or APPSW in the presence or absence of IXA4 (10 μM) for 72 hrs. Error bars show SE for n= 2. C. Representative histograms showing TMRE staining of SHSY5Y cells transiently expressing empty vector (Mock) or wild-type APP (APPWT) in the presence or absence of IXA4 (10 μM) for 72 hrs.
Figure 1.
Figure 1.. High-throughput screen to identify preferential IRE1/XBP1s activating compounds
A. Illustration of the screening pipeline employed to identify prioritized compounds that selectively activate the IRE1-dependent XBP1-RLuc reporter. This pipeline includes a primary screen to identify compounds that activate the XBP1-RLuc reporter, removal of compounds that activate reporters of other stress-responsive signaling pathways (e.g., the ATF6 arm of the UPR and the HSR), and structural clustering of selective activators into defined structural classes. B. Network plot illustrating shared structural motifs among a subset of the 128 compounds identified to preferentially activate the XBP1-Rluc reporter >20%, display a maximal EC50 for reporter activation of <3 μM, and show an IC50 for toxicity of >3 μM. Prioritized compounds identified for subsequent studies are shown in red. C. Chemical structures of our top 7 prioritized IRE1/XBP1s activators identified via high-throughput screening.
Figure 2.
Figure 2.. Compound-Dependent IRE1/XBP1s Activation Requires IRE1 Autophosphorylation
H. Luminescence in HEK293TREX cells stably expressing the XBP1-RLuc splicing reporter treated with indicated IRE1/XBP1s activators (10 μM) in the presence or absence of the IRE1 active site inhibitor 4μ8c (32 μM) for 18 hrs. Luminescence is shown as % signal relative to Tg (500 nM; 18 hr). Error bars represent SD for n = 3 replicates. I. Graph showing qPCR of the XBP1 target gene DNAJB9 in HEK293T cells treated for 4 hrs with the indicated compound (10 μM) or Tg (500 nM) in the presence or absence of 4μ8c (32 μM). Error bars show 95% CI for n = 3 replicates. J. Immunoblot of IRE1 following Phos-tag SDS-PAGE to separate phosphorylated and unphosphorylated IRE1 in lysates prepared from HEK293T cells treated for 4 hrs with 10 μM IXA1, IXA4, or IXA6 or 1 μM APY29 in the presence or absence of 500 nM Tg. Phosphorylated (p-IRE1) and unphosphorylated (IRE1) are indicated on the gel. K. cDNA gel showing splicing of XBP1 mRNA in HEK293T cells treated for 4 hrs with 10 μM IXA1, IXA4, IXA6, or 500 nM Tg in the presence or absence of 10 μM IRE1 kinase inhibitor KIRA6 for 4 hr. L. Graph showing qPCR of Xbp1s mRNA in Ire1−/− MEFs reconstituted with WT or kinase inactive P830L IRE1, treated for 4 hrs with 10μM IXA1, IXA4, IXA6. Fold increase for each condition is presented relative to vehicle-treated control. Error bars represent SE for n = 3 replicates. P-values were calculated using one-tailed Student’s t-test. *p<0.05.
Figure 3.
Figure 3.. Transcriptional profiling of compounds IXA1, IXA4, and IXA6 shows preferential induction of IRE1/XBP1s target genes.
A. Volcano plots from whole-transcriptome RNAseq showing negative log transformed adjusted p-values for gene expression (y-axis) versus log2 transformed fold change (x-axis) in HEK293T cells treated for 4 hrs with IXA1 (10 μM). B. Volcano plots from whole-transcriptome RNAseq showing negative log transformed adjusted p-values for gene expression (y-axis) versus log2 transformed fold change (x-axis) in HEK293T cells treated for 4 hrs with IXA4 (10 μM). C. Volcano plots from whole-transcriptome RNAseq showing negative log transformed adjusted p-values for gene expression (y-axis) versus log2 transformed fold change (x-axis) in HEK293T cells treated for 4 hrs with IXA6 (10 μM). D. Plots showing fold change values from whole-transcriptome RNAseq of target genes regulated downstream of the IRE1/XBP1s (red), ATF6 (blue), or PERK (green) signaling arms of the UPR expressed as fold change relative to Tg treatment (1 μM, 4hr) in HEK293T cells treated with IXA1 (10 μM, 4hr). Center line reflects median, box limits reflect upper and lower quartiles, whiskers reflect 1.5x IQ range, and points reflect outliers as calculated by Tukey method. The composition of these genesets is shown in Source Data Table 3. E. Plots showing fold change values from whole-transcriptome RNAseq of target genes regulated downstream of the IRE1/XBP1s (red), ATF6 (blue), or PERK (green) signaling arms of the UPR expressed as fold change relative to Tg treatment (1 μM, 4hr) in HEK293T cells treated with IXA4 (10 μM, 4hr). Center line reflects median, box limits reflect upper and lower quartiles, whiskers reflect 1.5x IQ range, and points reflect outliers as calculated by Tukey method. The composition of these genesets is shown in Source Data Table 3. F. Plots showing fold change values from whole-transcriptome RNAseq of target genes regulated downstream of the IRE1/XBP1s (red), ATF6 (blue), or PERK (green) signaling arms of the UPR expressed as fold change relative to Tg treatment (1 μM, 4hr) in HEK293T cells treated with IXA6 (10 μM, 4hr). Center line reflects median, box limits reflect upper and lower quartiles, whiskers reflect 1.5x IQ range, and points reflect outliers as calculated by Tukey method. The composition of these genesets is shown in Source Data Table 3.
Figure 4.
Figure 4.. Compounds IXA4 and IXA6 show selectivity for IRE1/XBP1s-dependent ER proteostasis remodeling.
A. Gene Ontology (GO) analysis of differentially expressed genes from RNAseq for HEK293T cells treated with IXA4 (10 μM, 4hr). Top 15 entries with lowest FDR are shown. See Supplementary Table 4 for full GO analysis. B. Gene Ontology (GO) analysis of differentially expressed genes from RNAseq for HEK293T cells treated with IXA6 (10 μM, 4hr). Top 15 entries with lowest FDR are shown. See Supplementary Table 4 for full GO analysis. C. Venn diagram of genes upregulated >1.2 fold (adjusted p-value <0.05) in HEK293T cells treated with compound IXA4 (10 μM) for 4 hrs in comparison to genes induced >1.2 fold (adjusted p-value < 0.05) in HEK293DAX cells treated with doxycycline (1 μg/mL) for 4 hrs. Genes listed in purple are top overlapping targets between conditions. D. Venn diagram of genes upregulated >1.2 fold (adjusted p-value <0.05) in HEK293T cells treated with compound IXA6 (10 μM) for 4 hrs in comparison to genes induced >1.2 fold (adjusted p-value < 0.05) in HEK293DAX cells treated with doxycycline (1 μg/mL) for 4 hrs. Genes listed in purple are top overlapping targets between conditions.
Figure 5.
Figure 5.. Compound IXA4 increases degradation of amyloid precursor protein (APP) mutants.
I. Plot of log2 Fold Change mRNA levels from RNAseq in cells treated with IXA4 (10 μM, 4hr) of proteostasis factors found in the ER, cytosol/nucleus, or mitochondria. The composition of these proteostasis genesets is shown in Source Data Table 3. J. Graph showing relative signal from ELISA of secreted Aβ peptide in conditioned media from CHO7PA2 cells treated with IXA4 (10 μM) in the presence or absence of 4μ8c (32 μM). Cells were pretreated for 18 hrs with compounds. Media was then replaced and conditioned in the presence of compounds for 24 hrs before harvesting conditioned media for ELISA. Secreted Aβ was normalized to that observed in untreated controls. Error bars represent SE for n = 3 replicates. P-values calculated from one-tailed Student’s t-test. **p<0.01, ***p<0.001. K. Quantification of mutant APP relative to vehicle-treated controls in media and lysate isolated from CHO7PA2 cells treated with IXA4 (10 μM) and/or 4μ8c (32 μM) as in panel B, measured by immunoblotting. A representative immunoblot is shown in Extended Data Fig. 8A. Error bars represent SD for n = 3 replicates. P-values calculated from one-tailed Student’s t-test. *p<0.05, ***p<0.001. L. Representative autoradiogram showing the [35S] metabolic labeling of mutant APP in CHO7PA2 cells treated with IXA4 (10μM) for 16 hrs prior to 30 min labeling. Media and lysates were collected at 0, 1, or 2 hrs and [35S]-labeled mutant APP was isolated by immunopurification. The experimental protocol is shown above. M. Plot showing fraction mutant APP remaining at each time point of the metabolic labeling experiment shown in panel D. Fraction remaining was calculated using the following equation: (APP in lysate at time = t + APP in media at time = t) / (APP in lysates at t = 0 + APP in media at t = 0). Error bars represent SD for n = 3 replicates. P-values were calculated from one-tailed Student’s t-test. *p<0.05, **p<0.01. N. Plot showing fraction of fraction APP secreted at 2 hrs of the metabolic labeling experiment shown in panel D. Fraction secretion was calculated using the following equation: (APP in media at time = t) / (APP in lysates at t = 0 + APP in media at t = 0). Error bars represent SD for n = 3 replicates. P-values were calculated from one-tailed Student’s t-test. *p<0.05.
Figure 6.
Figure 6.. The IRE1/XBP1s activator IXA4 rescues mitochondrial defects in SH-SY5Y cells expressing disease-relevant APP mutants.
D. Representative histograms showing TMRE staining of SHSY5Y cells transiently expressing empty vector (Mock), wild-type APP (APPWT), or Swedish mutant APP (APPSW). E. Quantification of TMRE staining from panel A. TMRE normalized to geometric mean from cells transiently expressing empty vector (Mock). Error bars represent SD for n = 3 replicates. P-values were calculated from one-tailed Student’s t-test. *p<0.05, **p<0.01. F. Representative histograms showing TMRE staining of SHSY5Y cells transiently expressing empty vector (Mock) or APPSW in the presence or absence of IXA4 (10 μM) for 72 hrs. G. Quantification of TMRE staining from panel C. TMRE normalized to geometric mean from cells transiently expressing empty vector (Mock). Error bars represent SE for n = 3 replicates. P-values were calculated from one-tailed Student’s t-test. *p<0.05. H. Graph showing relative ATP levels measured by CellTiterGlo luminescence in SHSY5Y cells transiently expressing empty vector or APPSW cultured in either normal high glucose media or glucose-free media supplemented with galactose for 72 hrs. Luminescence signal was normalized to that observed in cells transiently expressing empty vector (Mock) cultured in glucose- or galactose-containing media. Error bars represent SE for n = 3 replicates. P-values were calculated from one-tailed Student’s t-test. *p<0.05 I. Graph showing relative ATP levels measured by CellTiterGlo luminescence in SHSY5Y cells transiently expressing empty vector (Mock) or APPSW cultured in galactose media for 72 hrs in the presence or absence of IXA4 (10 μM). Luminescence signal was normalized to that observed in cells transiently expressing empty vector (Mock) incubated in the absence of IXA4. Error bars represent SD for n = 3 replicates. P-values were calculated from one-tailed Student’s t-test. ***p<0.001.

Comment in

  • A stress-free stress response.
    Cummins N, Taylor RC. Cummins N, et al. Nat Chem Biol. 2020 Oct;16(10):1038-1039. doi: 10.1038/s41589-020-0616-8. Nat Chem Biol. 2020. PMID: 32704180 No abstract available.

References

    1. Walter P; Ron D, The unfolded protein response: from stress pathway to homeostatic regulation. Science 2011, 334 (6059), 1081–6. - PubMed
    1. Bernales S; Papa FR; Walter P, Intracellular signaling by the unfolded protein response. Annu Rev Cell Dev Biol 2006, 22, 487–508. - PubMed
    1. Schroder M; Kaufman RJ, ER stress and the unfolded protein response. Mutat Res 2005, 569 (1–2), 29–63. - PubMed
    1. Patil C; Walter P, Intracellular signaling from the endoplasmic reticulum to the nucleus: the unfolded protein response in yeast and mammals. Curr Opin Cell Biol 2001, 13 (3), 349–55. - PubMed
    1. Shoulders MD; Ryno LM; Genereux JC; Moresco JJ; Tu PG; Wu C; Yates JR 3rd; Su AI; Kelly JW; Wiseman RL, Stress-independent activation of XBP1s and/or ATF6 reveals three functionally diverse ER proteostasis environments. Cell Rep 2013, 3 (4), 1279–92. - PMC - PubMed

Publication types

MeSH terms