. 2020 Aug;52(8):790-799.
doi: 10.1038/s41588-020-0664-8. Epub 2020 Jul 20.

Prostate cancer reactivates developmental epigenomic programs during metastatic progression

Affiliations

Prostate cancer reactivates developmental epigenomic programs during metastatic progression

Mark M Pomerantz et al. Nat Genet. 2020 Aug.

Abstract

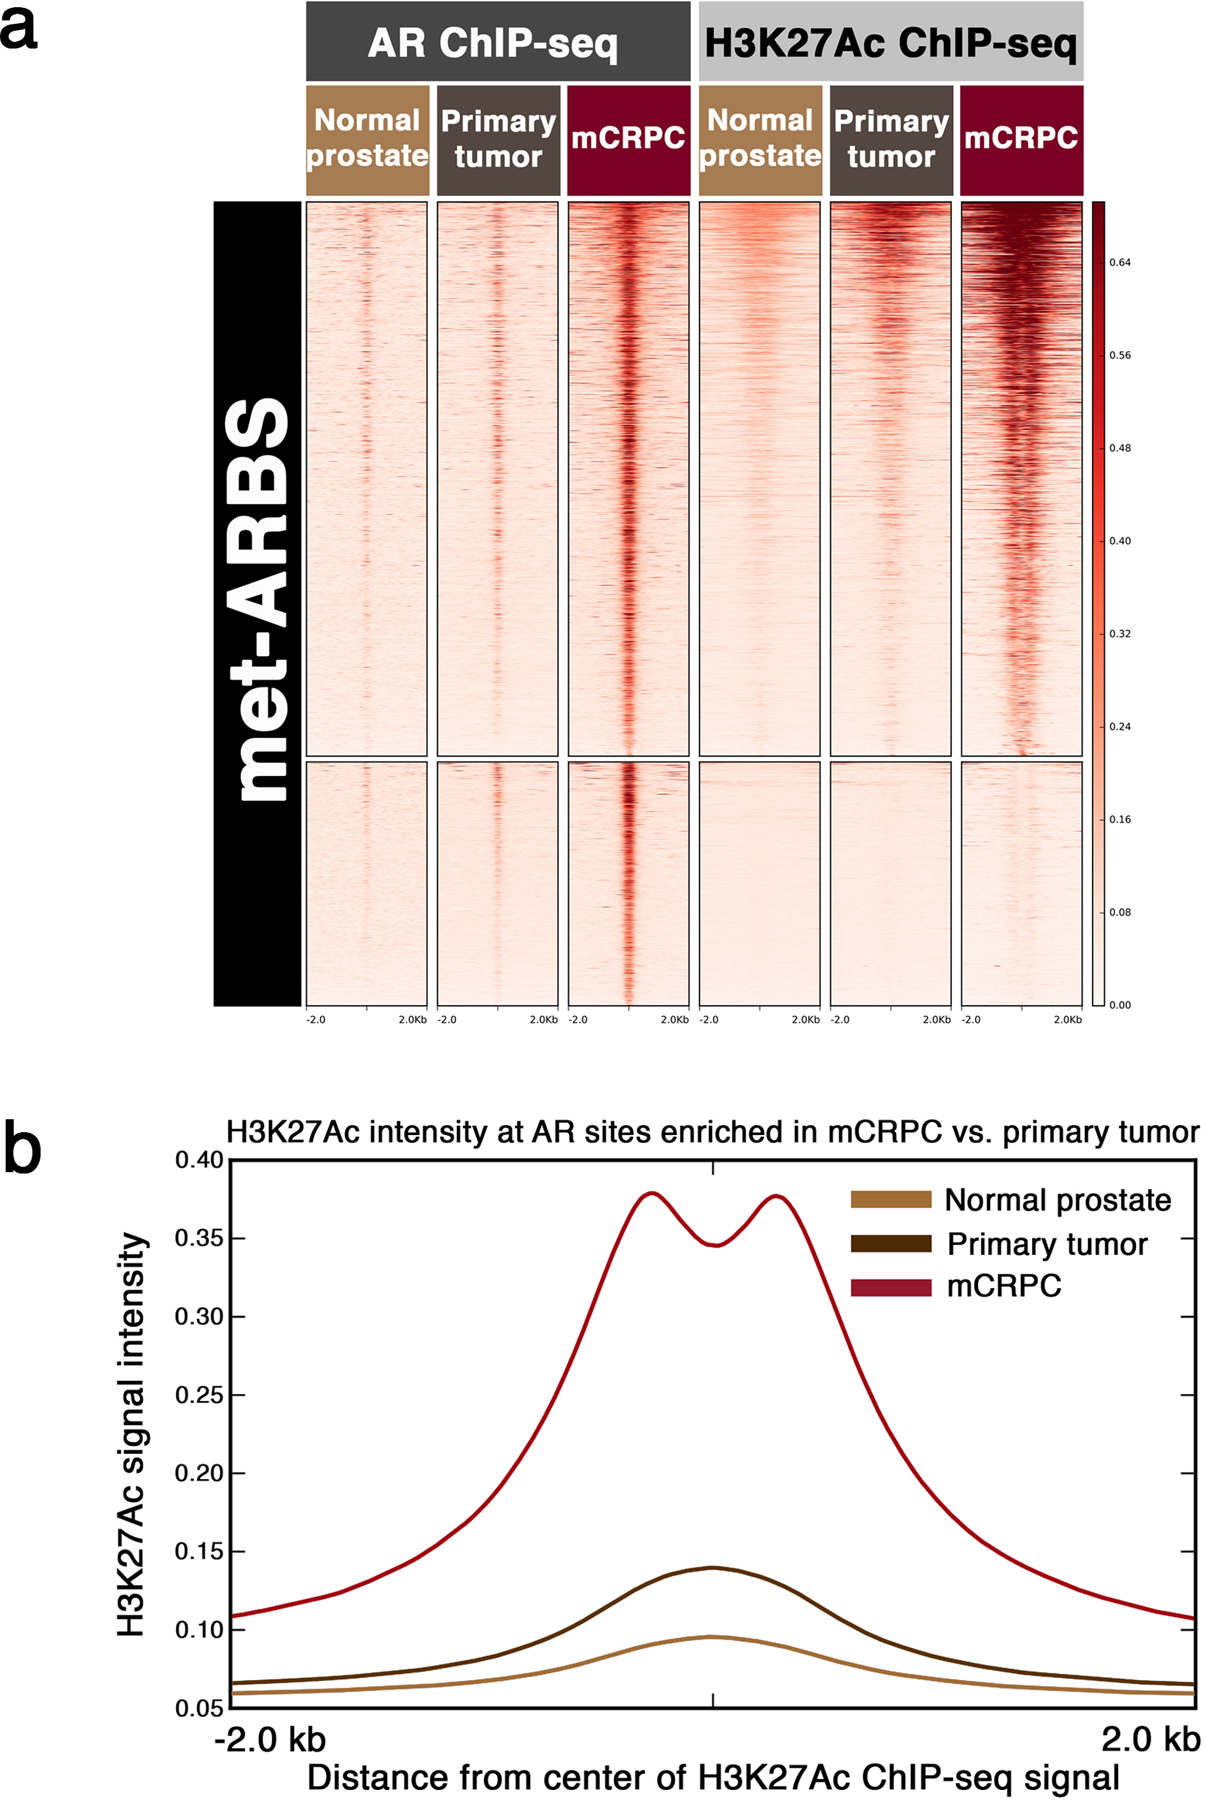
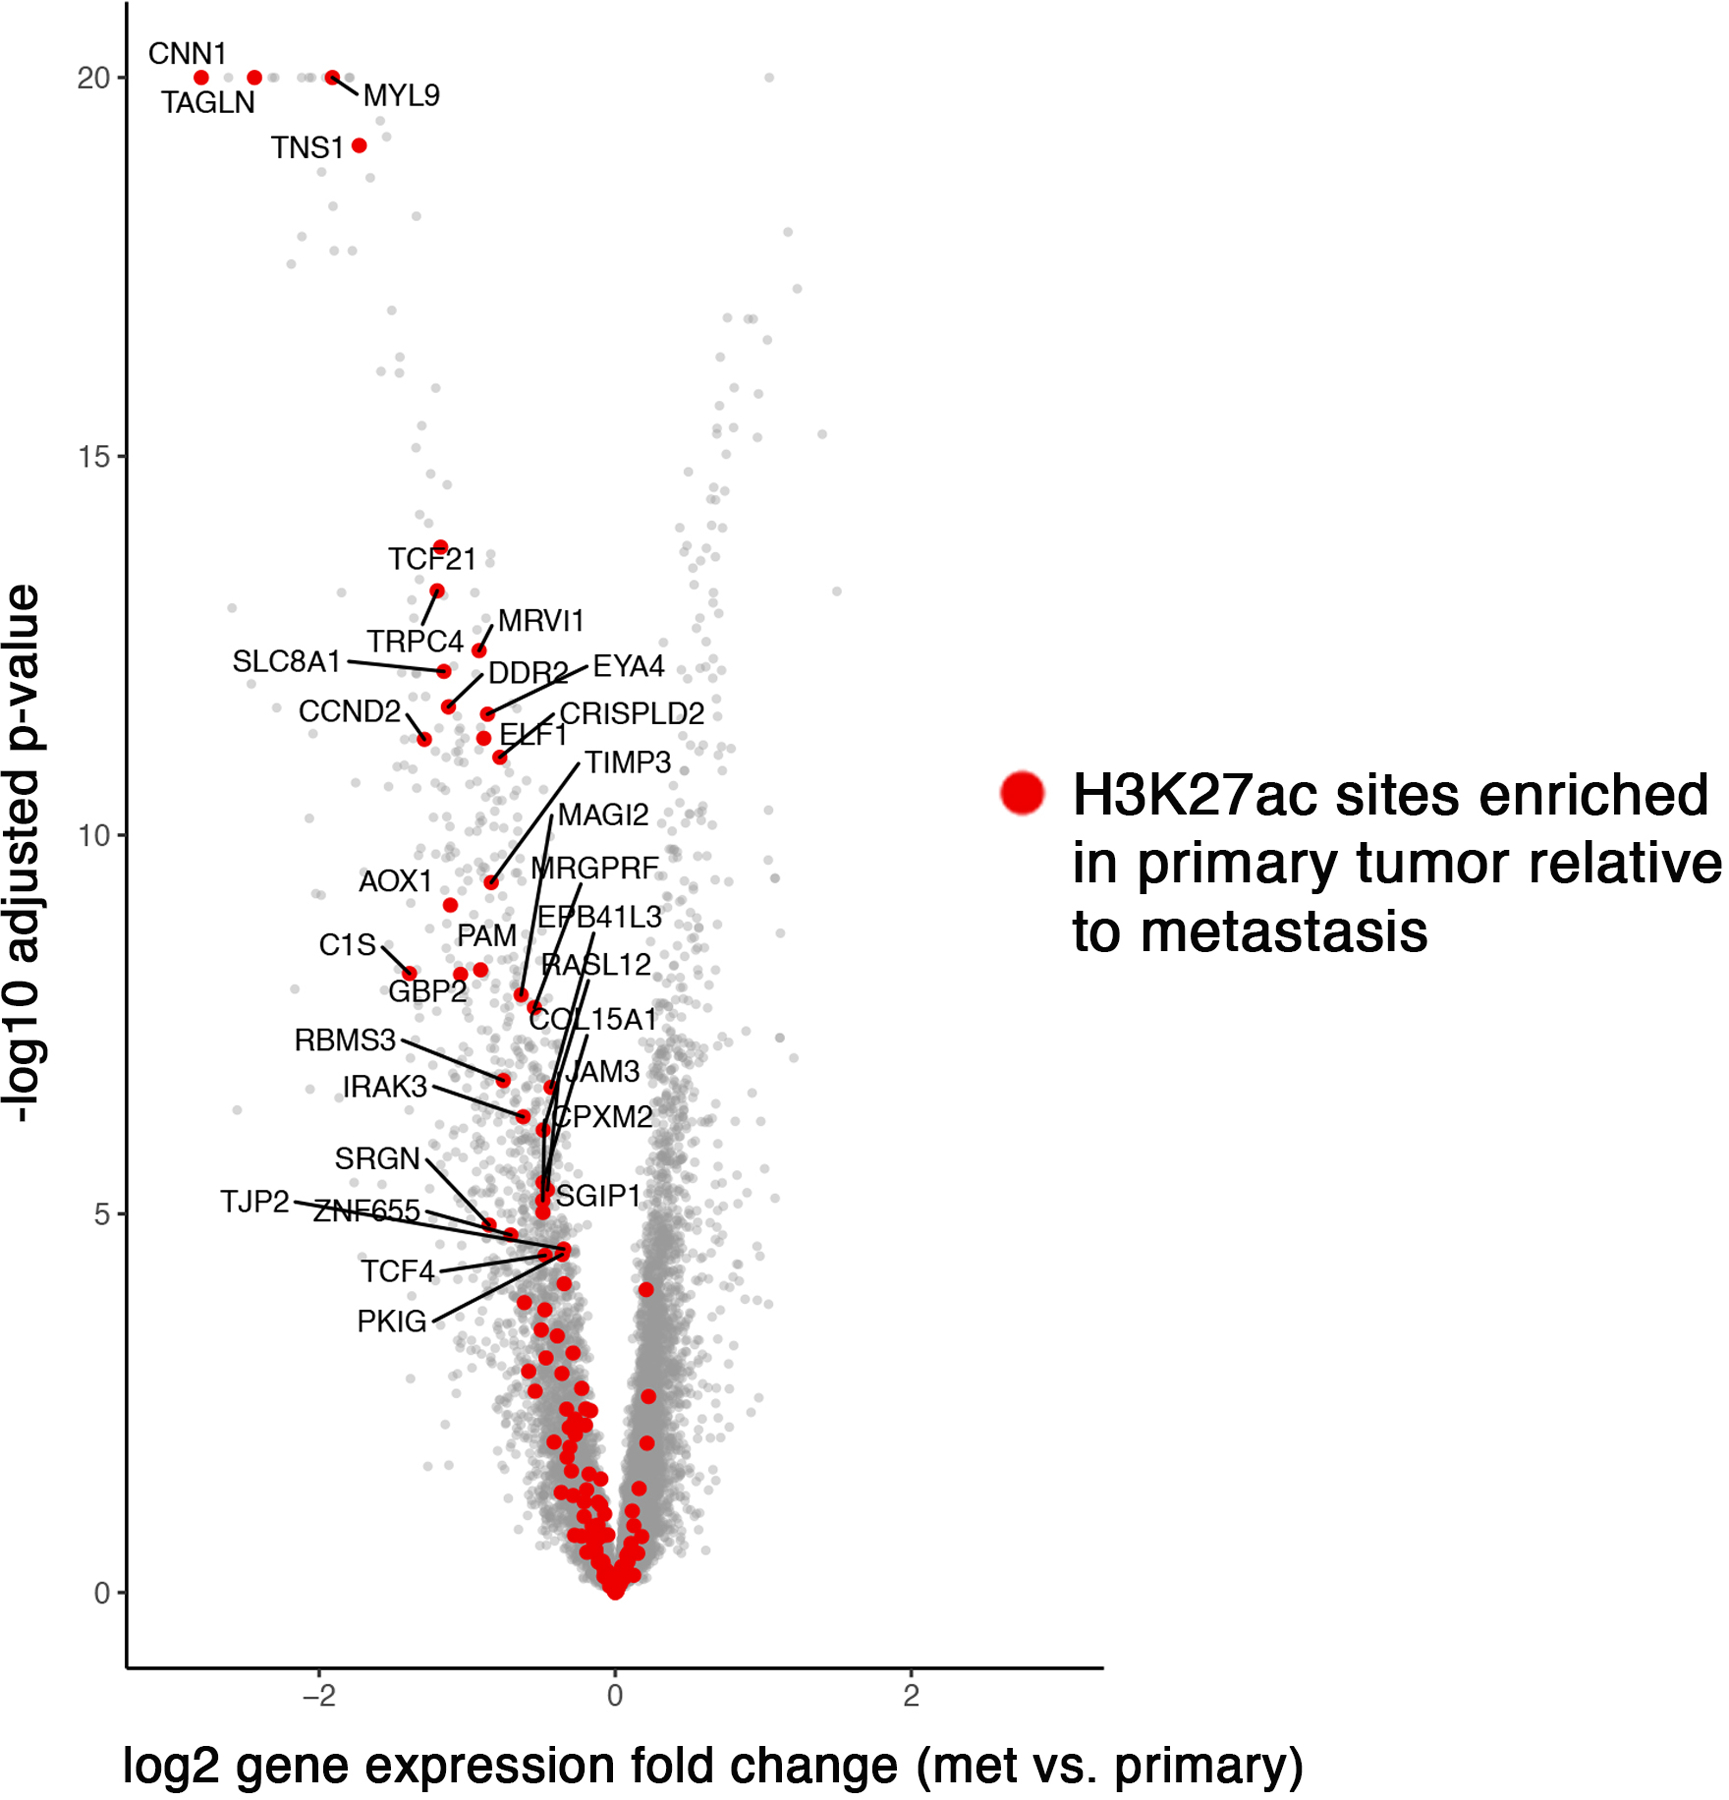
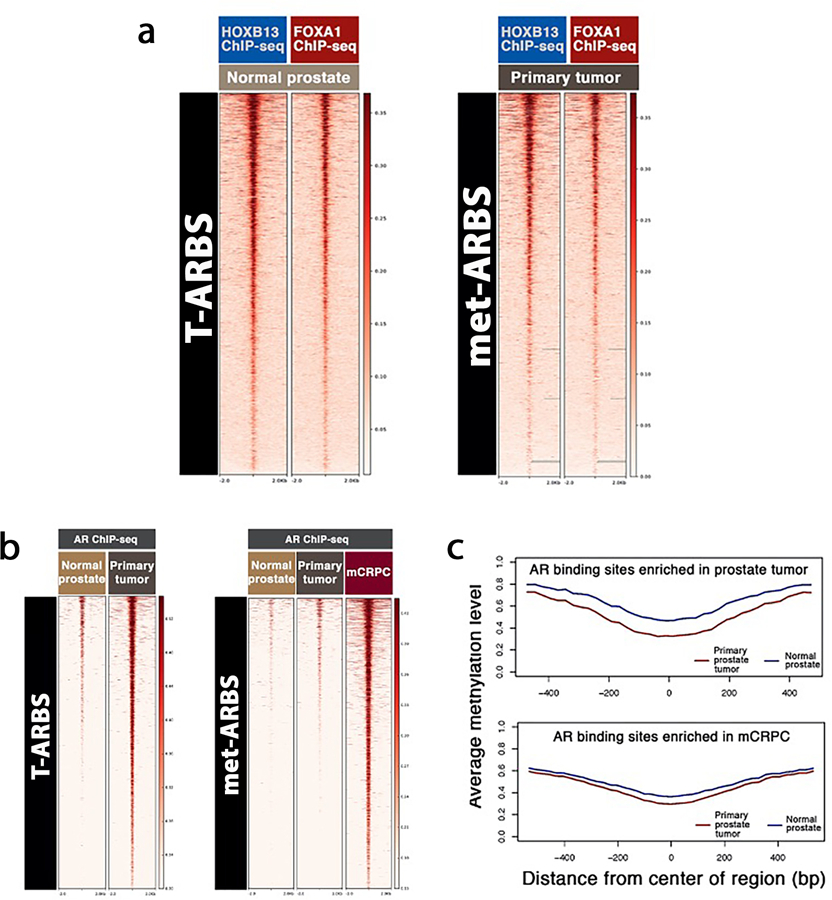
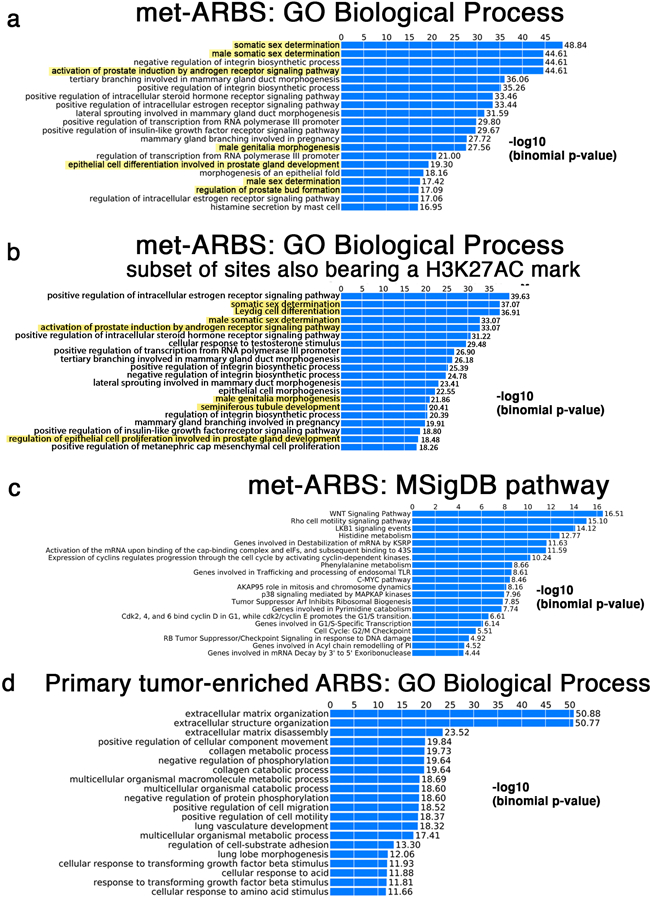
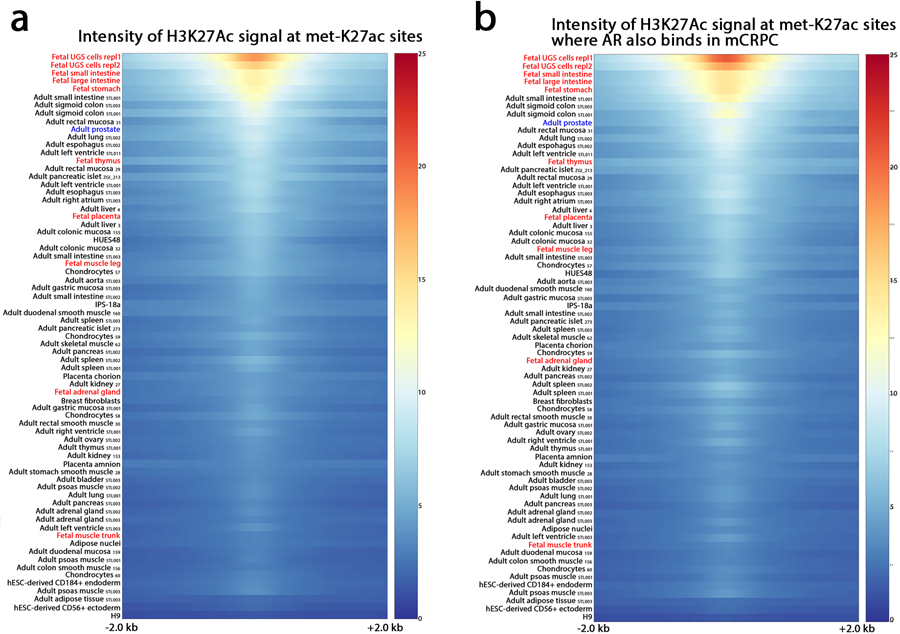
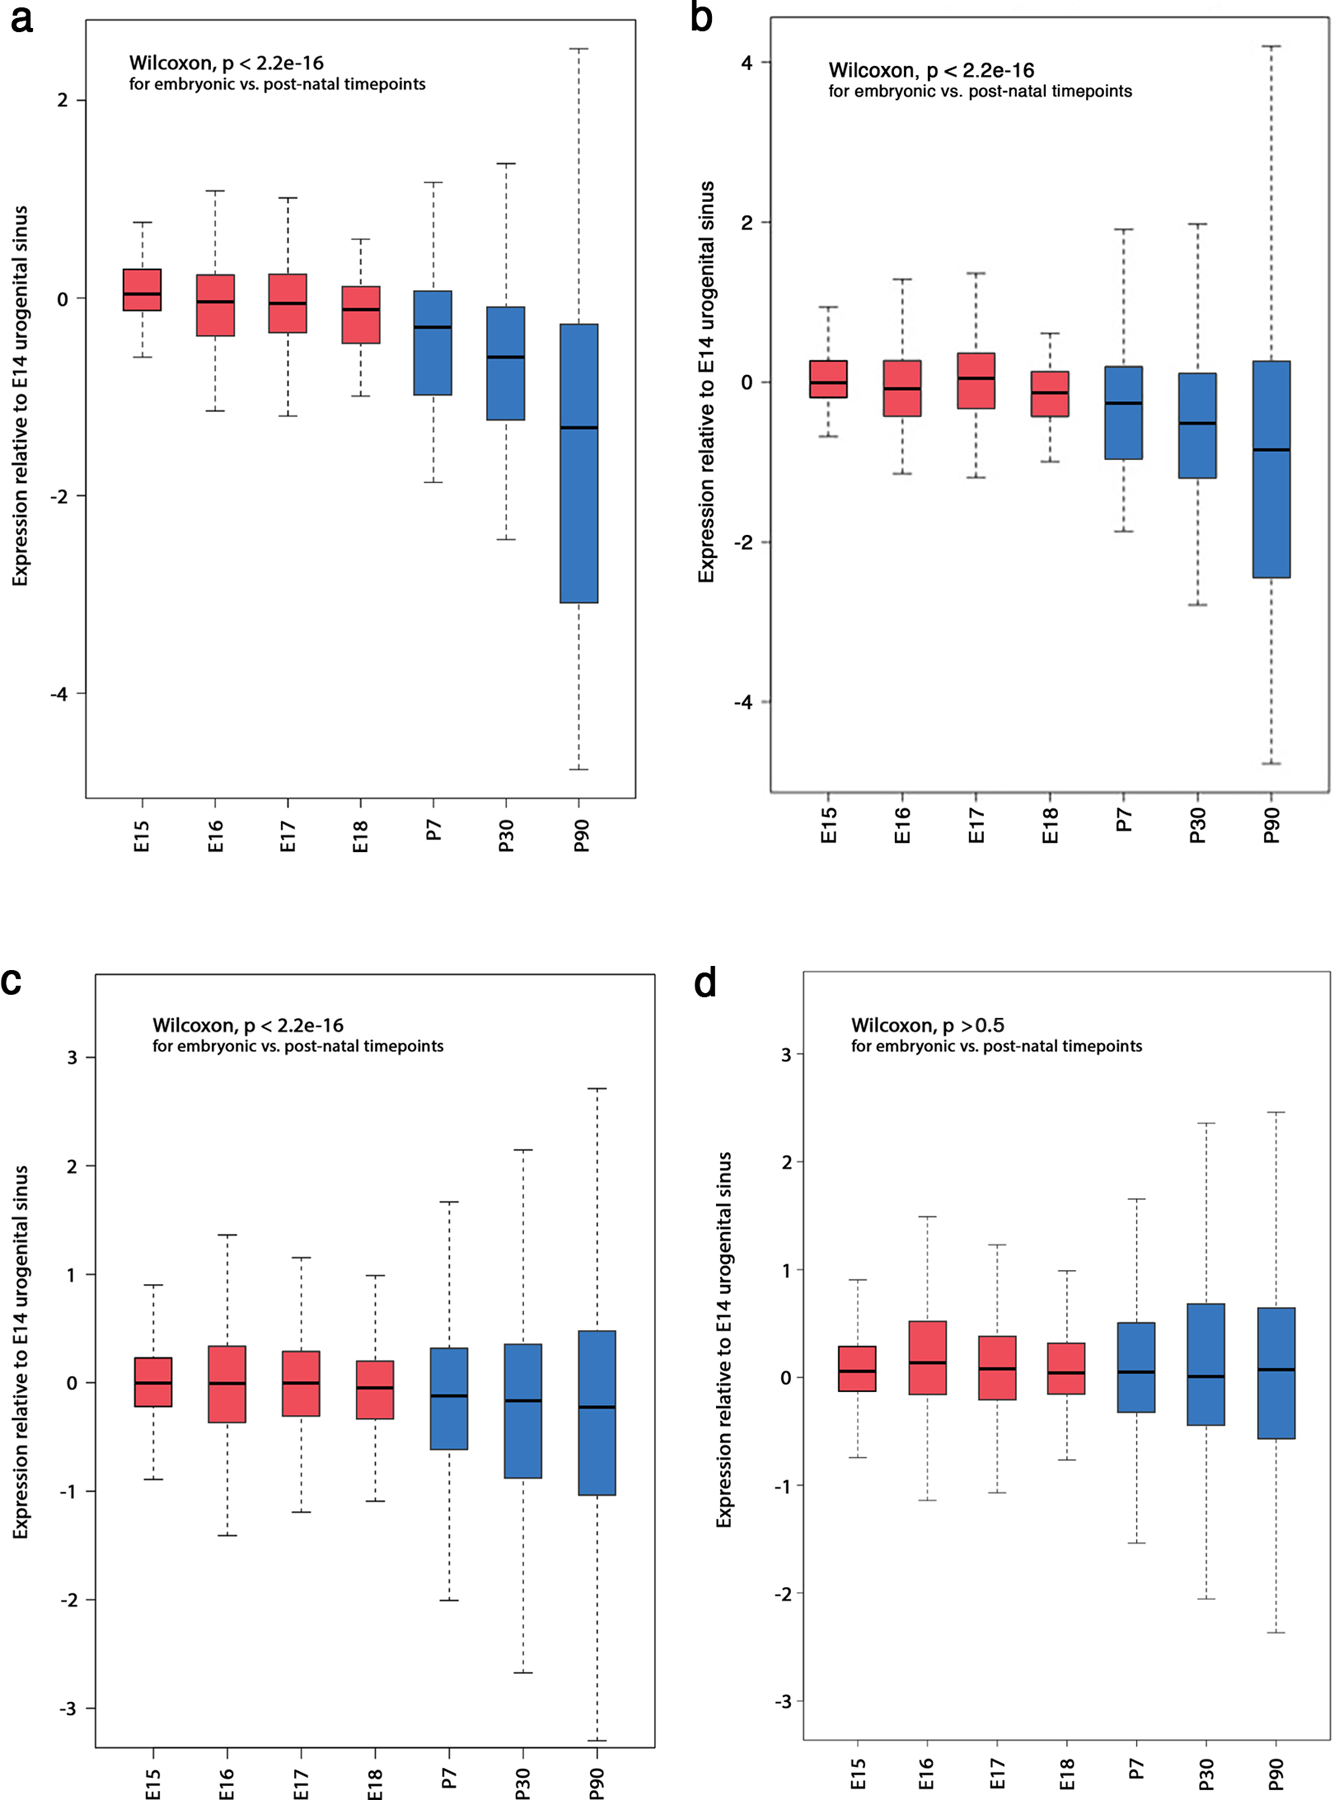
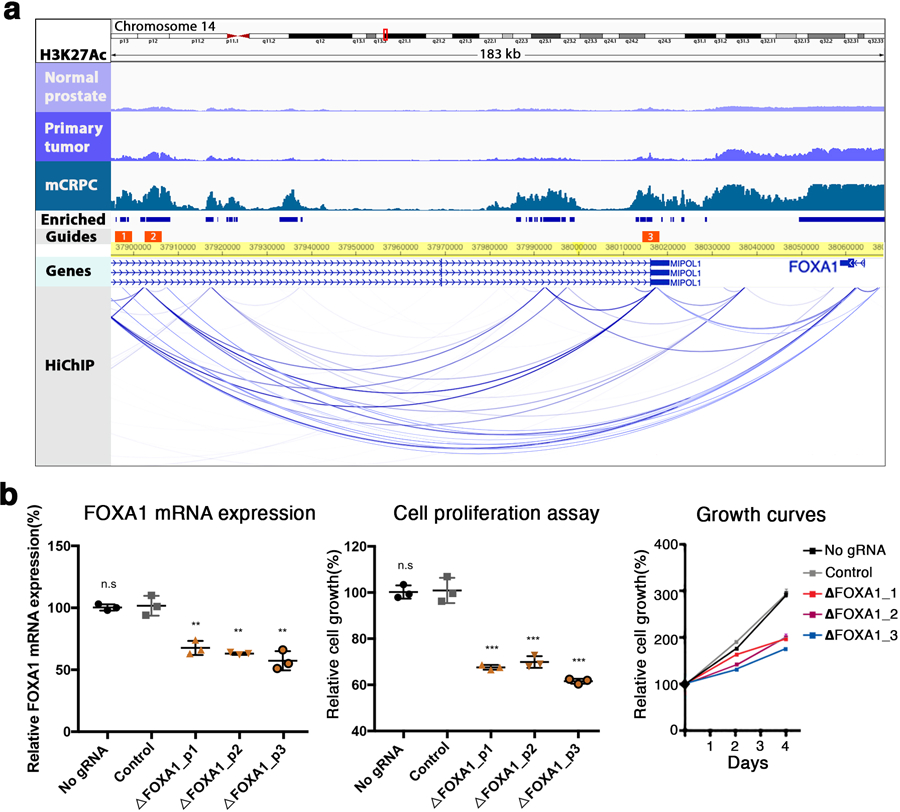
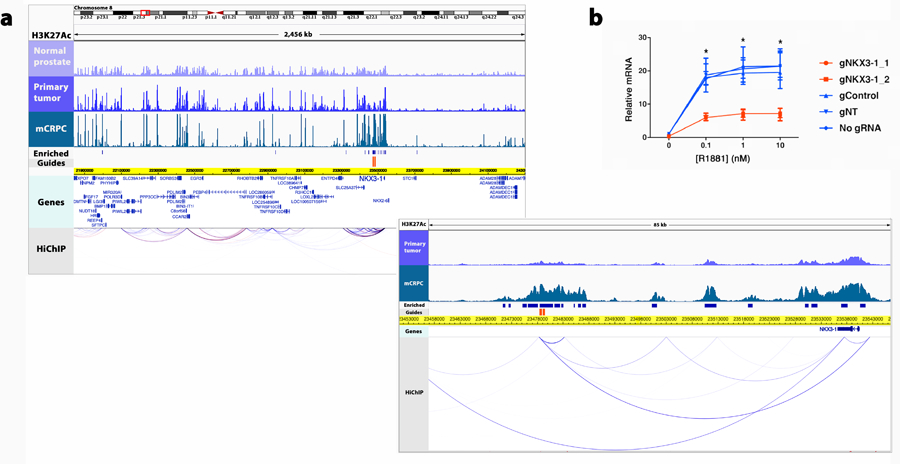
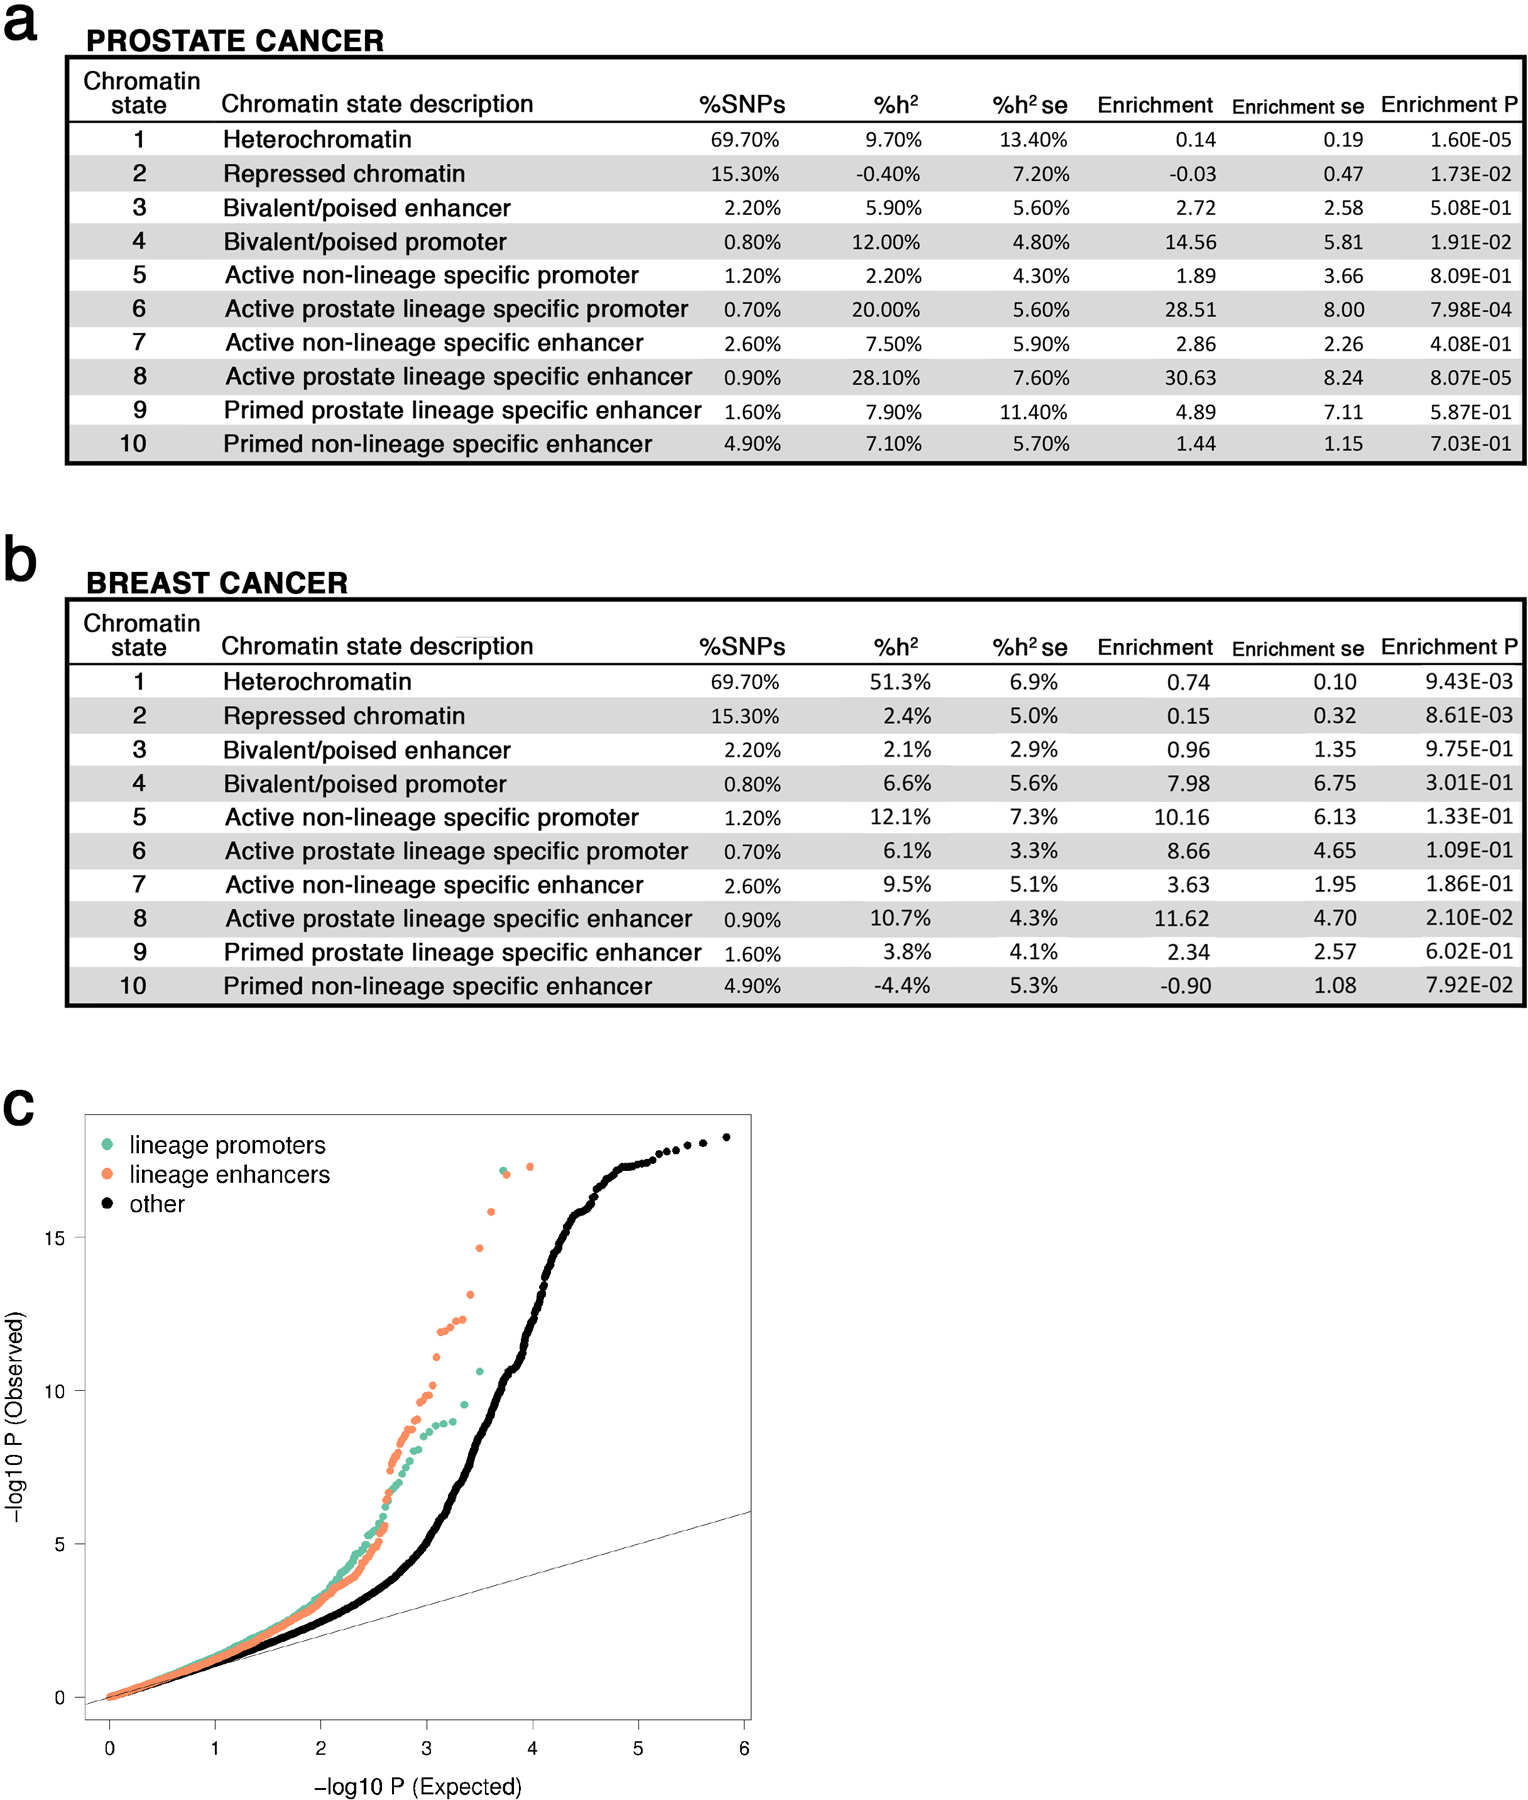
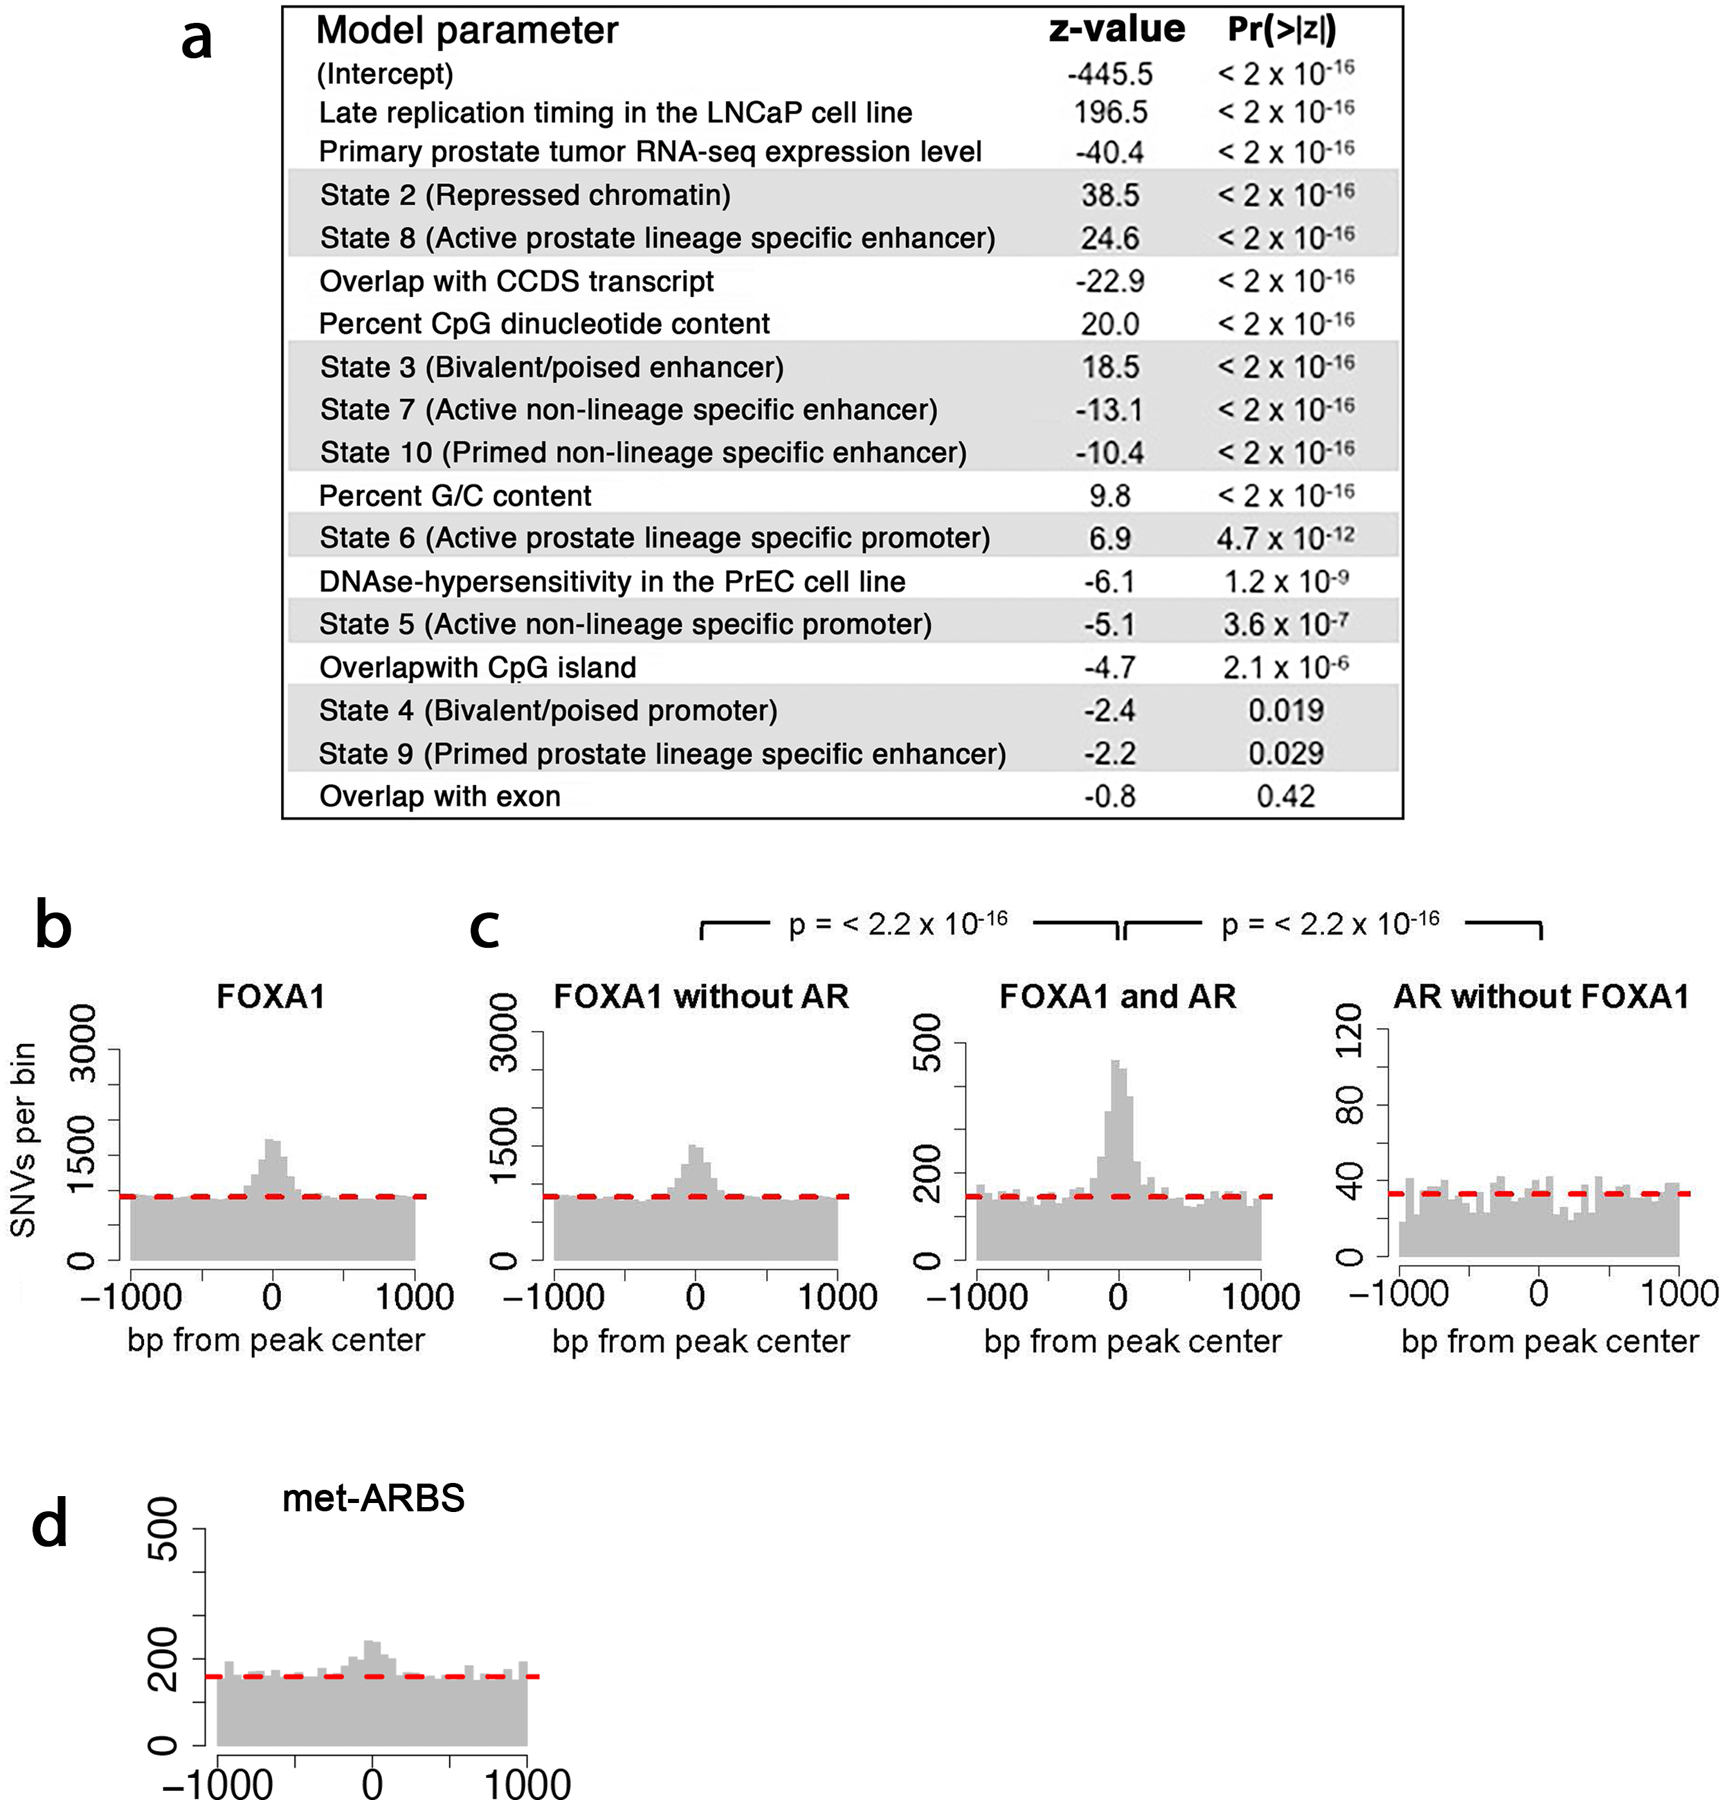
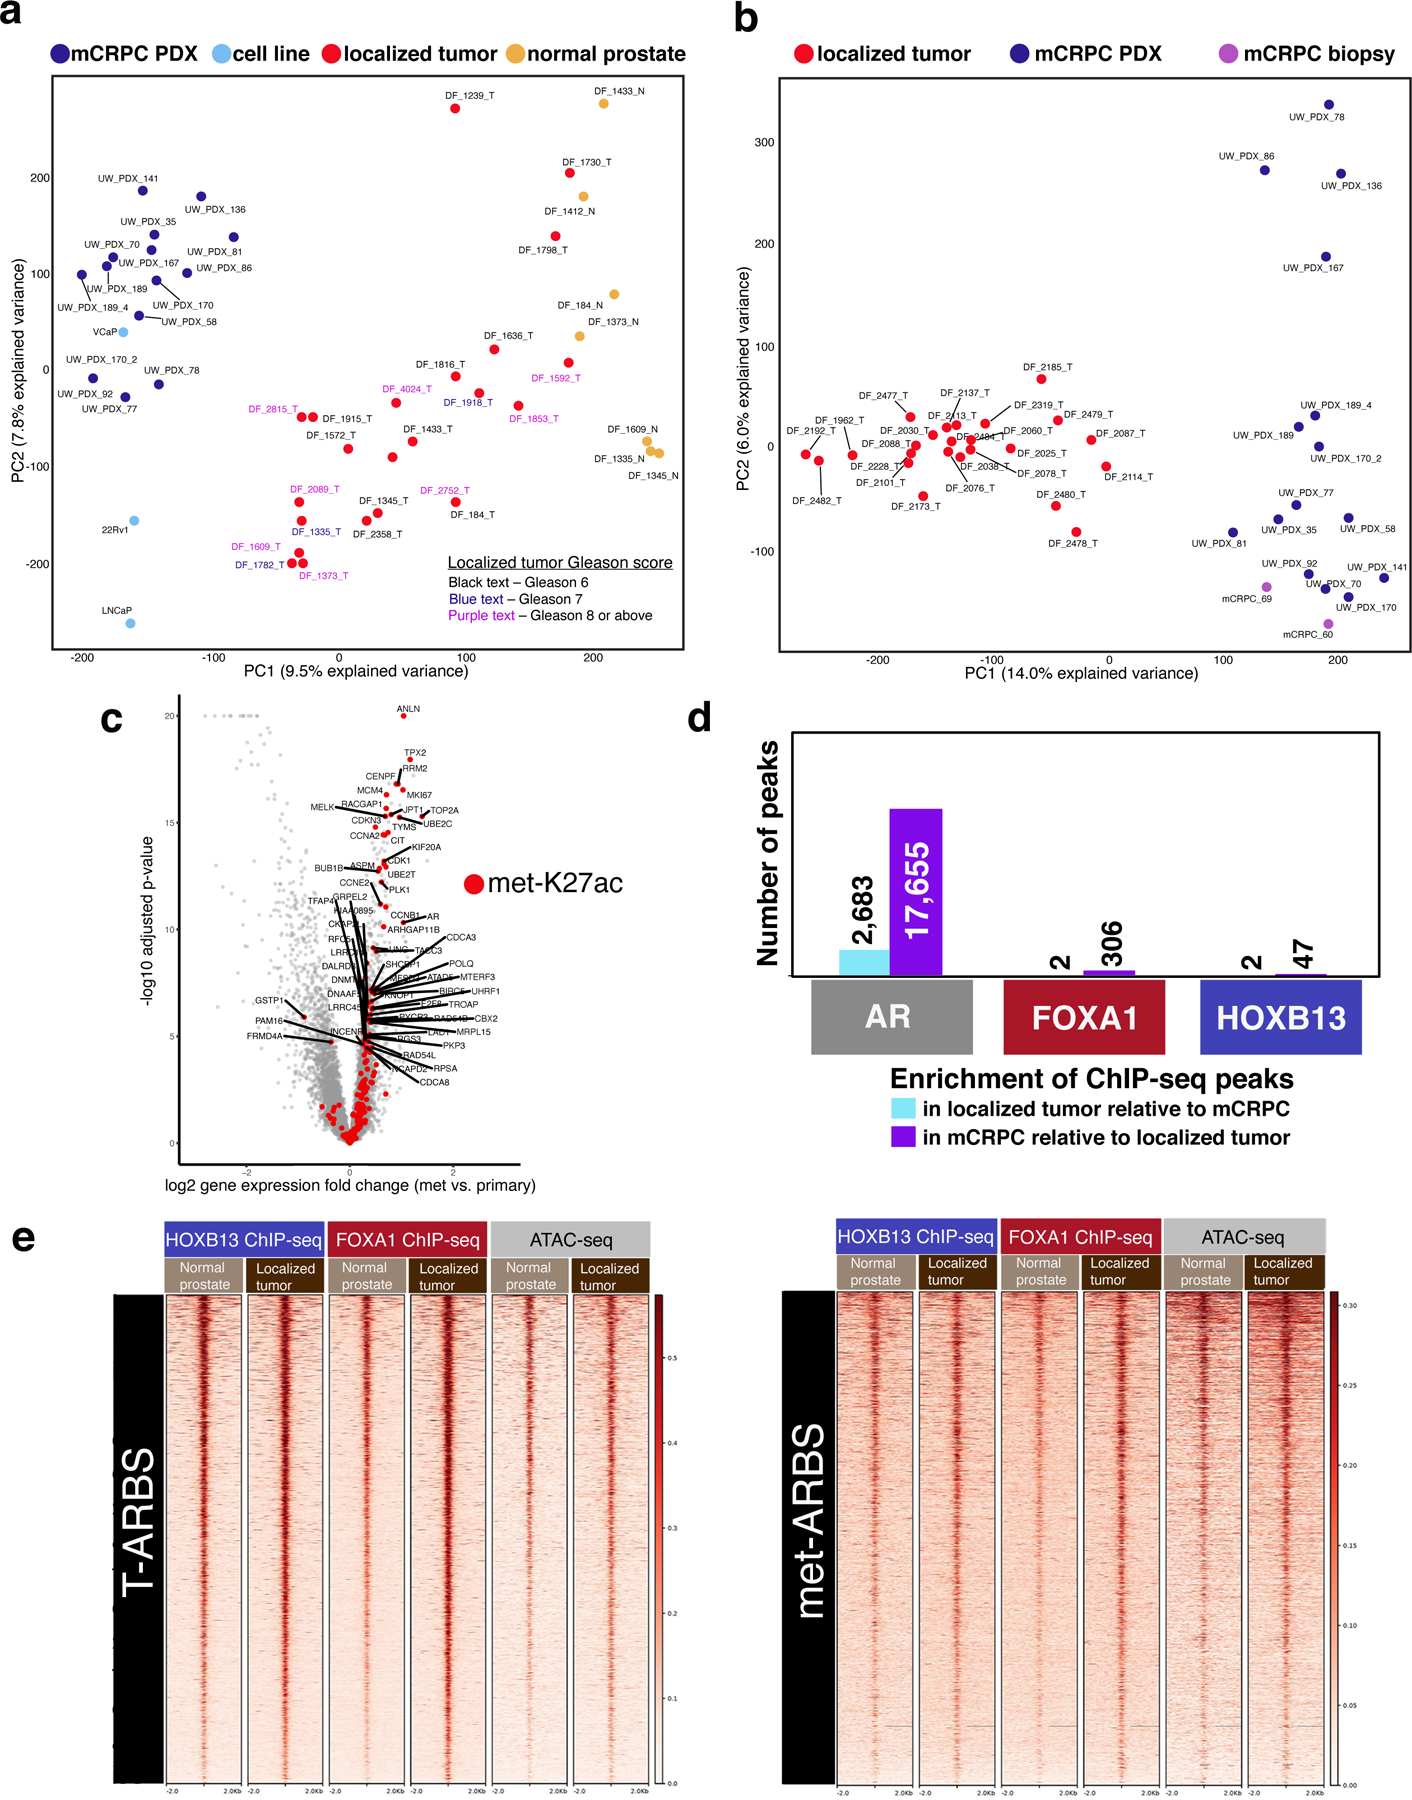
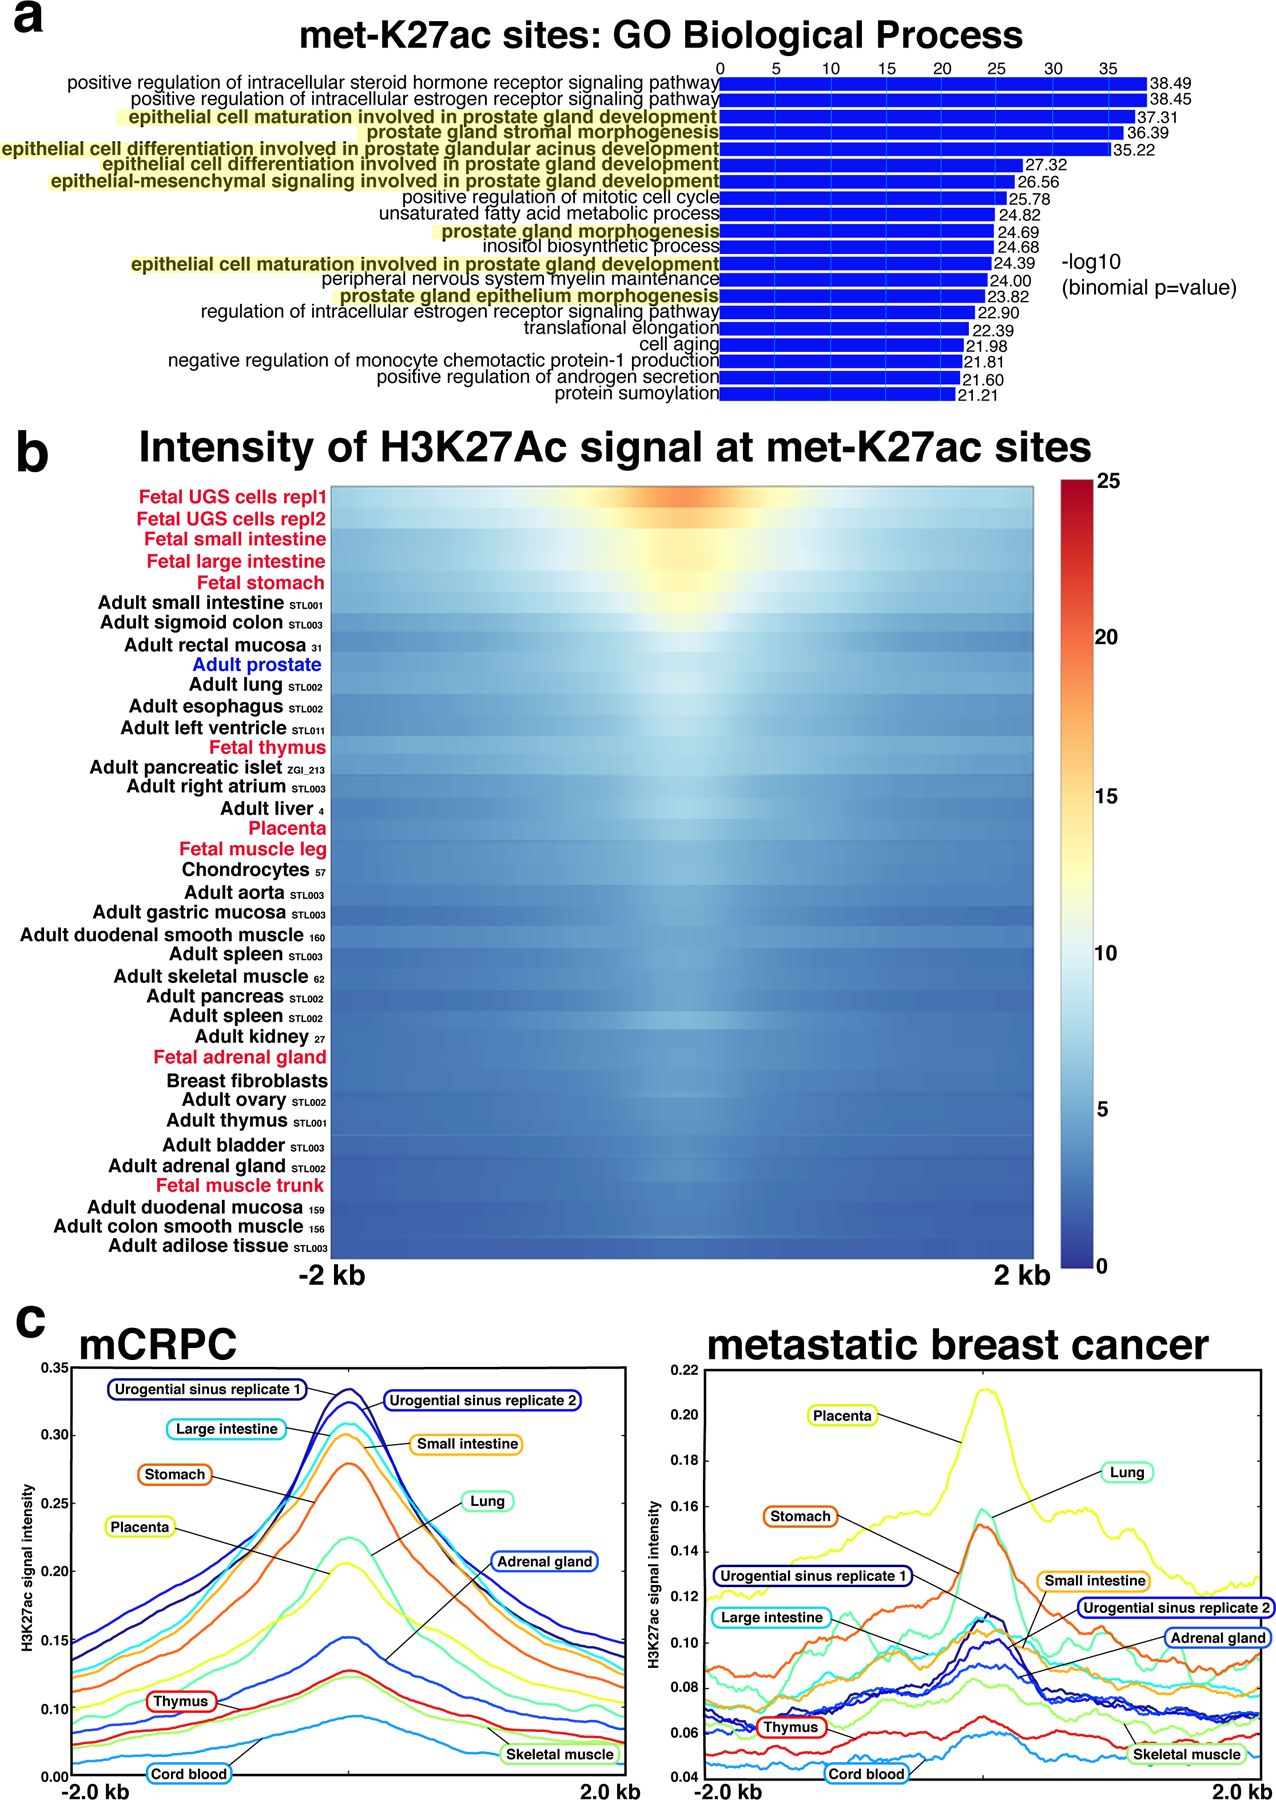
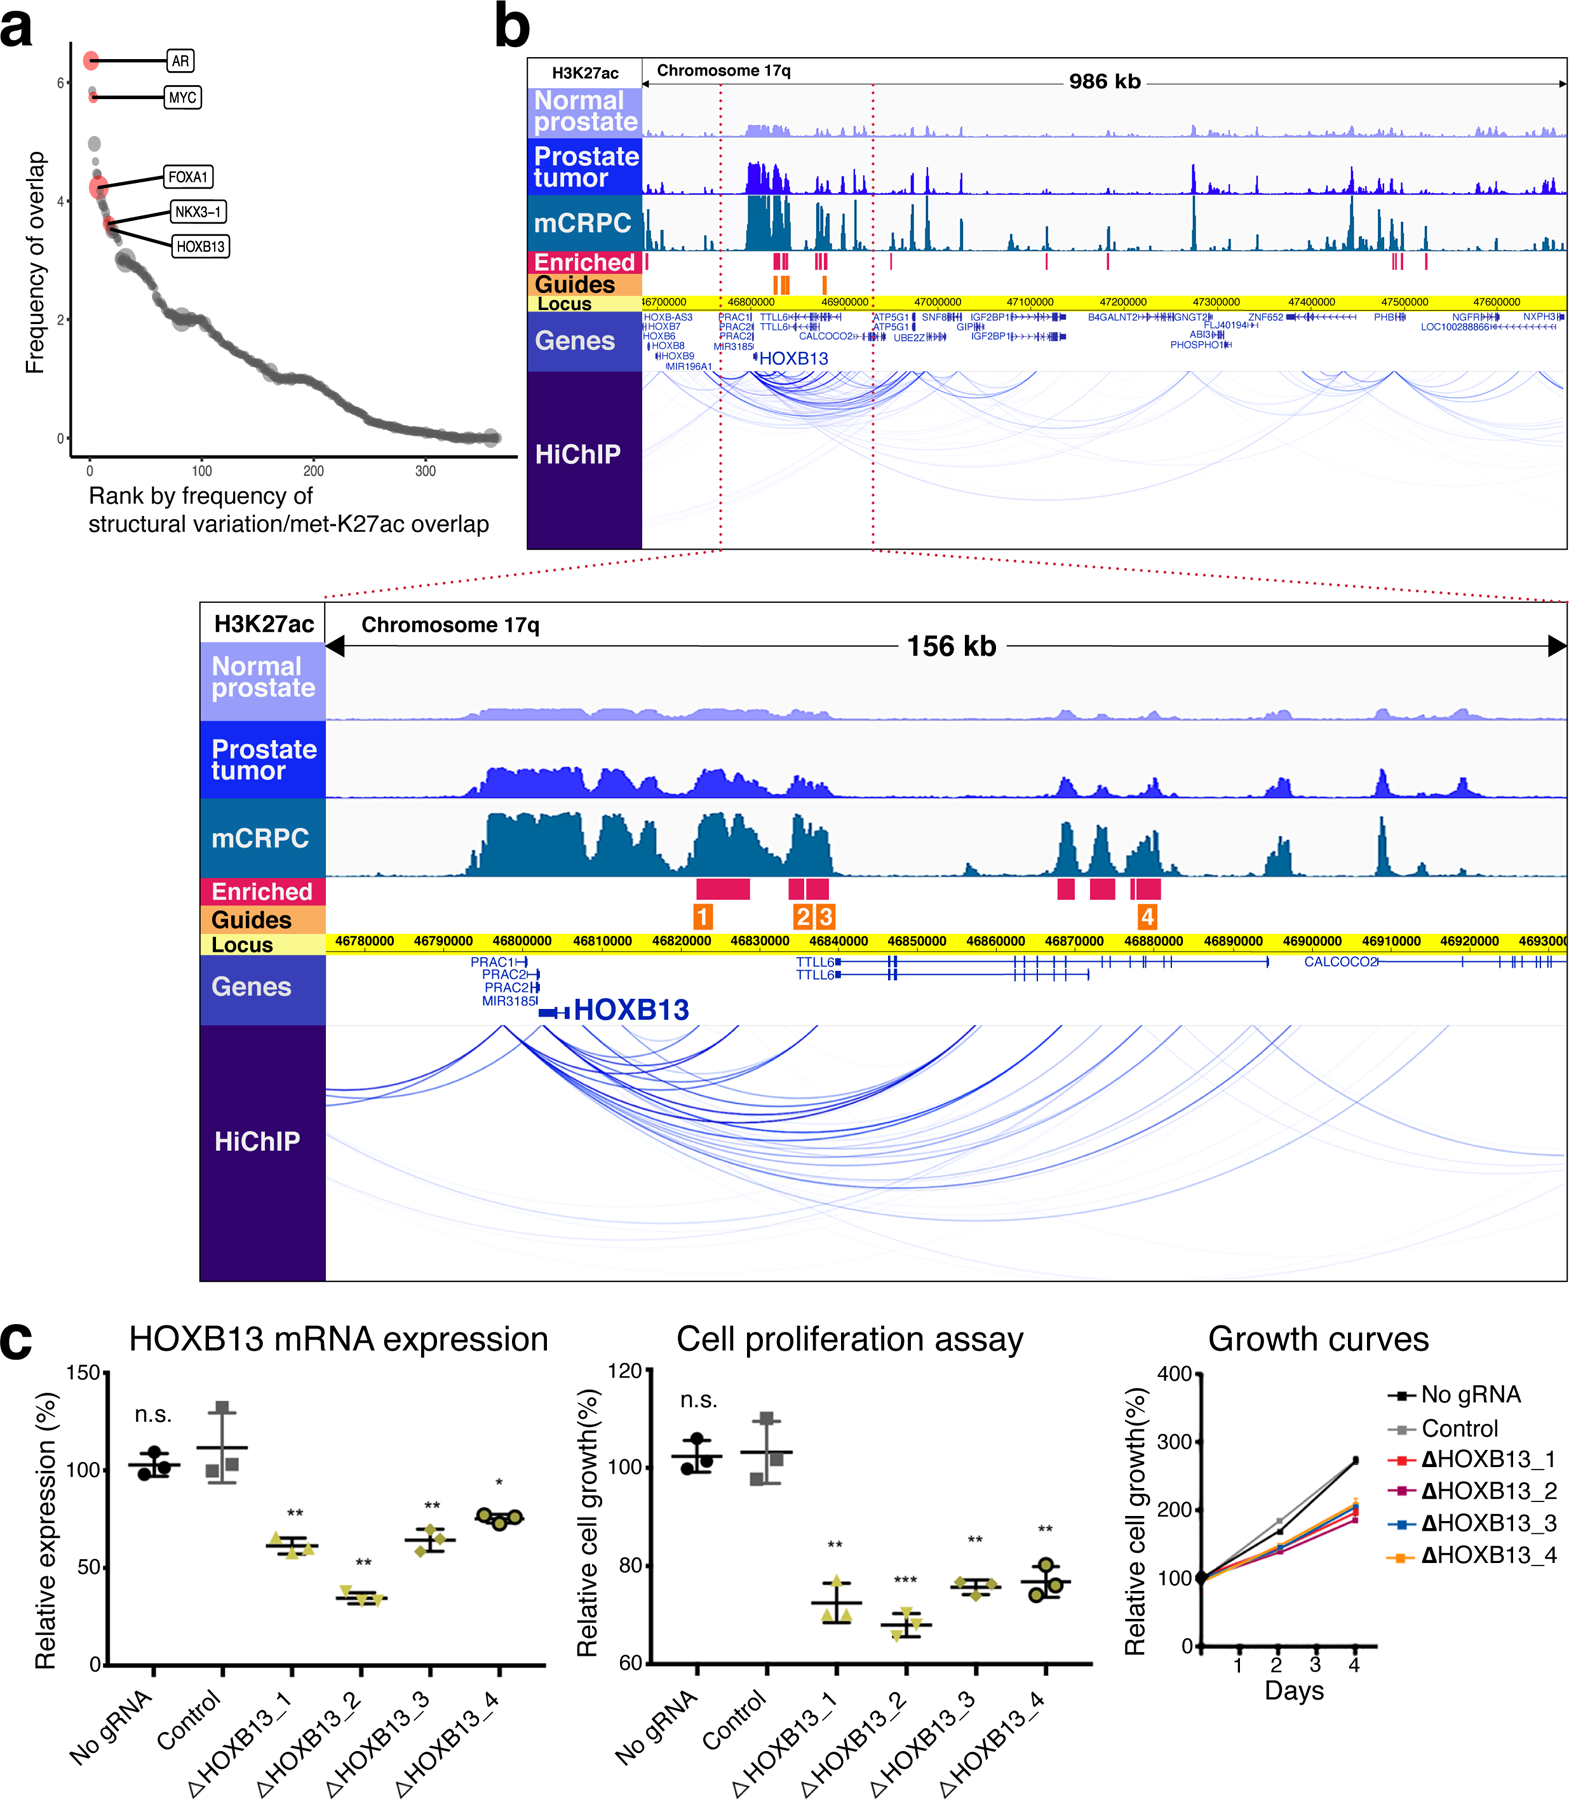
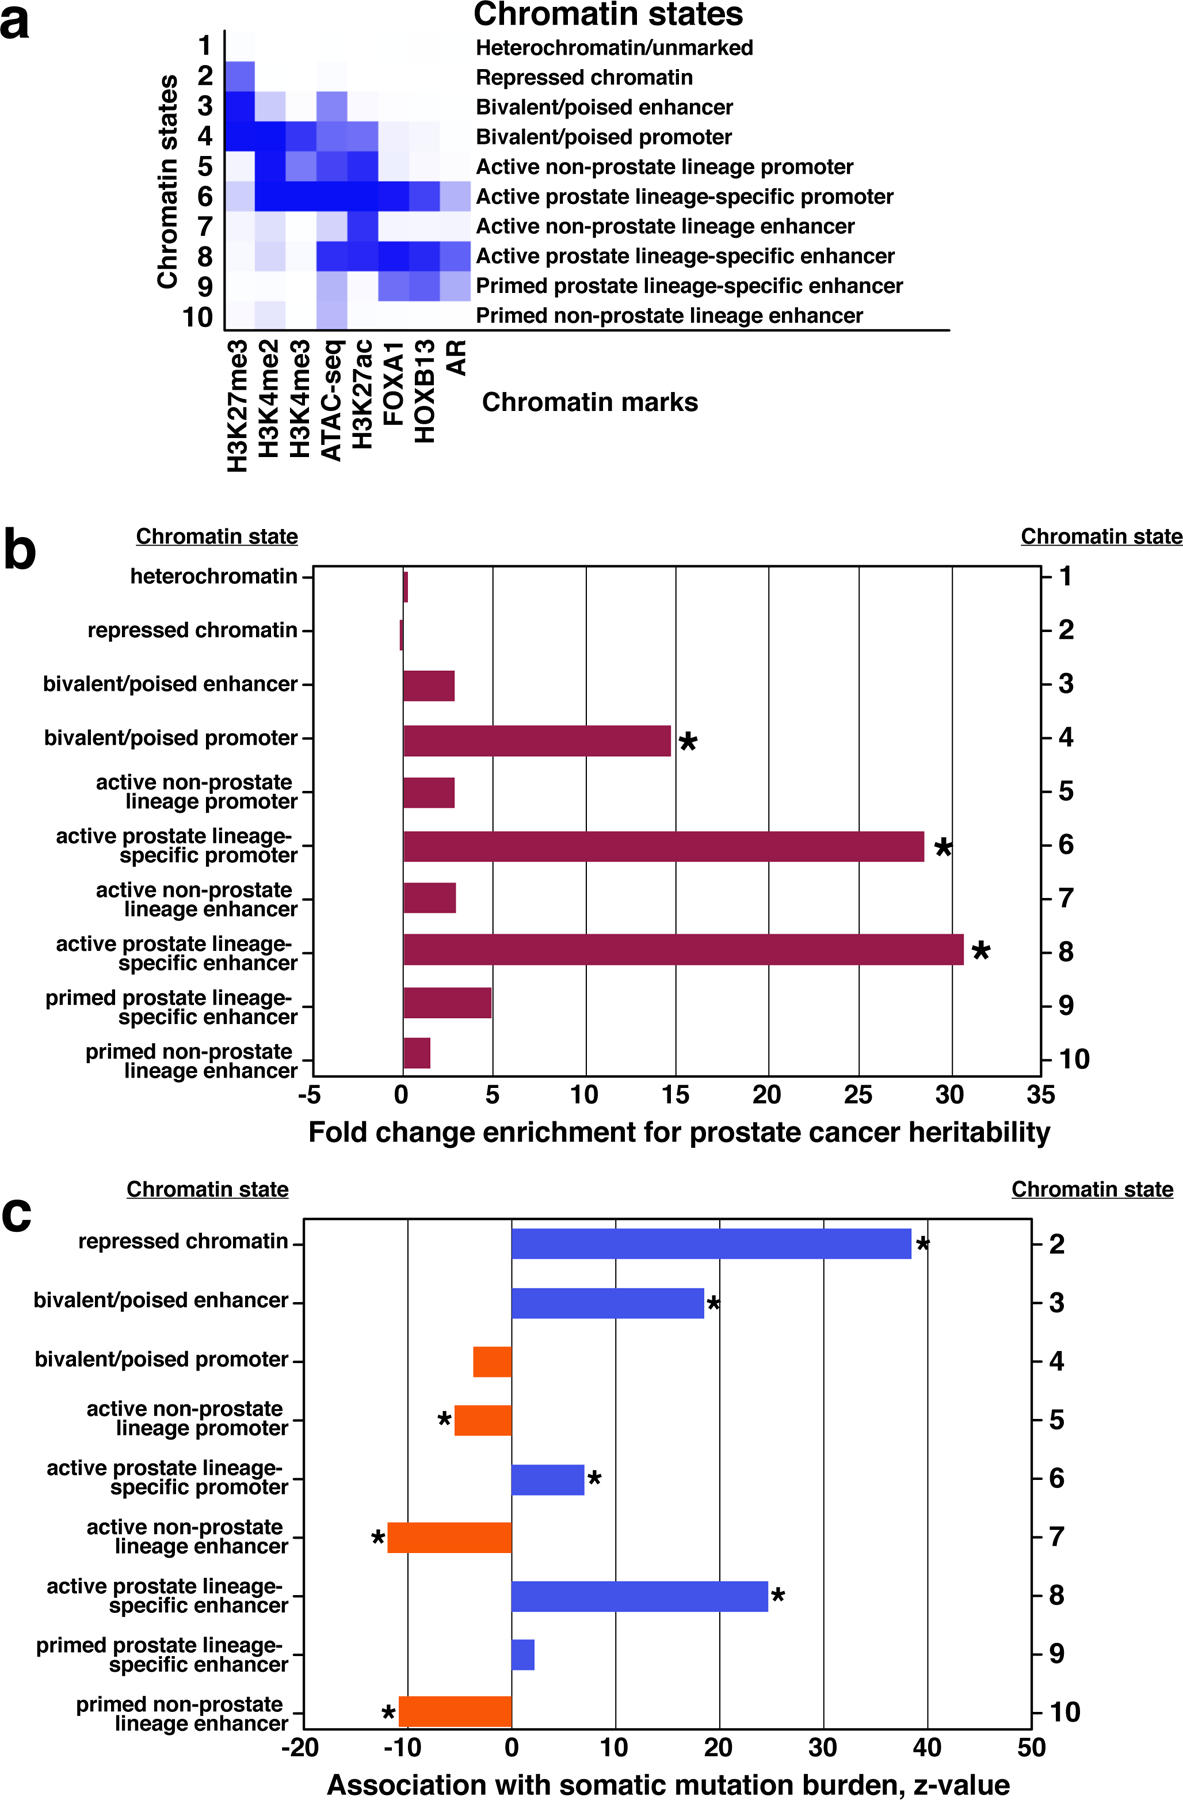
Epigenetic processes govern prostate cancer (PCa) biology, as evidenced by the dependency of PCa cells on the androgen receptor (AR), a prostate master transcription factor. We generated 268 epigenomic datasets spanning two state transitions-from normal prostate epithelium to localized PCa to metastases-in specimens derived from human tissue. We discovered that reprogrammed AR sites in metastatic PCa are not created de novo; rather, they are prepopulated by the transcription factors FOXA1 and HOXB13 in normal prostate epithelium. Reprogrammed regulatory elements commissioned in metastatic disease hijack latent developmental programs, accessing sites that are implicated in prostate organogenesis. Analysis of reactivated regulatory elements enabled the identification and functional validation of previously unknown metastasis-specific enhancers at HOXB13, FOXA1 and NKX3-1. Finally, we observed that prostate lineage-specific regulatory elements were strongly associated with PCa risk heritability and somatic mutation density. Examining prostate biology through an epigenomic lens is fundamental for understanding the mechanisms underlying tumor progression.


Conflict of interest statement

Declaration of Interests

The authors declare no competing interests.

Figures

Extended Data Fig. 1:
Extended Data Fig. 1:. Co-occupancy of AR and H3K27Ac at met-ARBS.
(a) Heatmaps for AR and H3K27Ac ChIP-seq signal intensity at met-ARBS. Each horizontal line represents a four kilobase (kb) locus. Shade of red reflects average binding intensity at that site across all subjects in the normal prostate, primary tumor and mCRPC cohorts. (b) H3K27Ac ChIP-seq signal intensity across tissue types at the 17,655 met-ARBS. The curves depict overall signal in each of the three tissue types. Signal significantly higher in mCRPC compared with primary prostate tumor and normal prostate tissue (Kolmogorov-Smirnov test, D^- = 0.74, p-value < 2.2e-16).
Extended Data Fig. 2:
Extended Data Fig. 2:. Genes that are down-regulated in metastasis compared to primary tumor are enriched for primary tumor-specific H3K27Ac ChIP-seq peaks.
Each dot represents a gene. Red dots are genes with a primary tumor-specific H3K27Ac peak (i.e., sites with H3K27Ac signal in primary tumor and absent in mCRPC) in the transition start site (p-value <0.00001 for association between primary tumor-specific H3K27Ac and transcriptional down-regulation in mCRPC).
Extended Data Fig. 3:
Extended Data Fig. 3:. Reprogrammed AR binding sites in primary prostate tumors and in mCRPC are epigenetically pre-marked in earlier states.
(a) Heat map indicating HOXB13 and FOXA1 ChIP-seq signal intensity in normal prostate epithelium and primary prostate tumor in the NKI dataset. At left, the 9,179 AR sites enriched in primary tumor relative to normal prostate epithelium (T-ARBS). At right, the 17,655 AR sites enriched in mCRPC relative to primary tumor tissue (met-ARBS). Each horizontal line represents a four kilobase (kb) locus. Shade of red reflects binding intensity. (b) AR ChIP-seq binding intensity across clinical tissue subtypes in T-ARBS and met-ARBS. (c) Average DNA methylation signal at T-ARBS across prostate tumor (red curve) and normal prostate (blue curve) at T-ARBS (top) and met-ARBS (bottom).
Extended Data Fig. 4:
Extended Data Fig. 4:. GREAT analysis characterizing mCRPC-enriched epigenetic sites.
(a) GREAT analysis characterizing the gene ontology biological terms most significantly associated with genes proximal to the 17,655 met-ARBS. (b) GREAT analysis characterizing the gene ontology biological terms most significantly associated with genes proximal to the subset 17,655 met-ARBS that are co-occupied by H3K27Ac. Terms associated with genitourinary development are highlighted in yellow. (c) The biological terms most significantly associated with genes proximal to the 2,683 AR sites enriched in primary tumor compared to mCRPC. (d) GREAT analysis of the MSigDB pathway terms most significantly associated with genes proximal to met-ARBS.
Extended Data Fig. 5:
Extended Data Fig. 5:. Across 27 human adult tissues and 10 fetal tissues, the met-K27ac cistrome is most strongly associated with fetal urogenital sinus.
(a) Tissue type listed at left (adult tissues are followed by their Roadmap Epigenomics Project identification codes). Multiple biologic replicates were performed and included here. Urogenital sinus sample was performed in replicate. Heat map indicates H3K27Ac binding intensity at the 16,047 met-K27ac sites across a 4 kilobase (kb) interval. (b) Heat map for subset of met-K27ac sites that are co-occupied by AR.
Extended Data Fig. 6:
Extended Data Fig. 6:. Association between fetal and mature prostate murine gene expression and met-K27ac sites.
Gene expression in mouse prostate embryonic (red) and post-natal (blue) tissue34 at (a) the 50 most differential H3K27Ac sites between mCRPC and localized PCa in humans that reside within transcriptional start sites; (b) the 100 most differential H3K27Ac sites; (c) the 500 most differential H3K27Ac sites; and (d) at a randomly selected set of 500 genes that do not overlap with met-K27ac sites. Expression levels were performed in three replicates and measured relative to embryonic day 14 (y-axis). The x-axis shows embryonic days 15, 16 and 17 then post-natal days 7, 30 and 90. Box plots depict median, 25th–75th percentile interval and extremes in gene expression.
Extended Data Fig. 7:
Extended Data Fig. 7:. Enhancers of FOXA1 in mCRPC are identified by integrating genetic and epigenetic datasets.
(a) At top, color-coded tracks in a 183 kilobase (kb) region derived from the segments ranked in Fig. 3. Tracks depict the intensity of ChIP-seq signal averaged across all DFCI normal prostate, primary prostate tumor and mCRPC specimens, respectively. FOXA1 is visualized in the Genes track. HiChIP track depicts chromatin looping in the LNCaP cell line. Blue bars show H3K27Ac sites meeting criteria for mCRPC enrichment (met-K27ac). Orange bars depict the locus against which guide RNAs (gRNAs) were designed (Methods). (b) Functional interrogation of candidate metastasis-specific enhancers. Left, LNCaP FOXA1 expression in two controls (no gRNA and gRNA targeting unrelated gene HPRT1) and after transduction with each individual gRNA depicted in (a). Middle and right, LNCaP cell proliferation over the course of four days after control conditions of transduction with one of the three FOXA1 region gRNAs. Each shape represents an independent experiment, center line indicates mean, error bars indicate ± s.d. Using student’s t-test – n.s not significant, *p < 0.05, **p < 0.01, ***p < 0.001.
Extended Data Fig. 8:
Extended Data Fig. 8:. Enhancer of NKX3–1 in mCRPC is identified by integrating genetic and epigenetic datasets.
(a) At top, color-coded tracks in the 2,456 kb region depict the intensity of ChIP-seq signal averaged across all DFCI normal prostate, primary prostate tumor and mCRPC specimens, respectively. NKX3–1 is visualized in the Genes track. HiChIP track depicts chromatin looping in the LNCaP cell line. Blue bars show H3K27Ac sites meeting criteria for mCRPC enrichment (met-K27ac). Orange bars depict the locus against which guide RNAs (gRNAs) were designed (Methods). Below, magnification of an 85 kb region where met-K27ac and HiChIP signal were strongest. (b) Functional interrogation of the candidate metastasis-specific enhancer. LNCaP NKX3–1 expression in two controls (no gRNA and gRNA targeting unrelated gene HPRT1) and after transduction with gRNAs depicted in (a). Data represent the average and standard deviation of three biological replicates and significance determined by unpaired Student’s t test. * p < 0.001.
Extended Data Fig. 9:
Extended Data Fig. 9:. Prostate cancer and breast cancer risk heritability attributable to germline variation within prostate tumor chromatin states.
(a) Prostate cancer heritability attributable to each prostate cancer chromHMM state. (b) Breast cancer heritability attributable to each prostate cancer chromHMM state. %SNPs: percentage of single nucleotide polymorphisms residing within a chromatin state; %h2: proportion of prostate cancer risk heritability; se: standard error; Enrichment: heritability based on overall proportion of SNPs within the chromatin state. ( c) Q-Q Plot of PCa risk GWAS statistics in lineage specific and non-specific features. Lineage specific promoters, enhancers, and all other variants shown in green, orange, and black respectively. Variants with Chi-squared statistic > 80 were removed, as recommend by LD-score regression to mitigate outliers. Across all variants, mean Chi-squared statistic was 1.6 (s.e. 0.04), 1.7 (s.e. 0.07), and 1.2 (s.e. 0.003) for variants in promoters, enhancers, and all variants.
Extended Data Fig. 10:
Extended Data Fig. 10:. Prostate cancer somatic mutations are enriched at prostate lineage specific sites.
(a) Rank-ordered terms in a linear model of somatic mutation density in prostate cancer. Using 210 prostate cancer whole genome sequences from the International Cancer Genome Consortium, the number of donors with one or more mutations per 200bp window was modeled as a poisson distribution determined by a linear combination of the listed factors. Beta coefficients for each term were calculated and are reported as standardized Z-scores to allow comparison. ChromHMM states are highlighted in gray. See methods for details and a listing of datasets used in the model. (b) SNV distribution at FOXA1 binding sites in prostate tumor tissue. (C) SNV distribution at FOXA1 binding sites with no overlapping AR peak in prostate tumors (left), at intersection of FOXA1 and AR tumor peaks (center), and at AR tumor binding sites without overlapping FOXA1 peaks. P-values compare differential enrichment by Pearson’s chi-square test of mutation counts at the peak (±250bp) and shoulder regions (-1000 to -250 and 250 to 1000) of the TF binding sites. (d) SNV distribution at met-ARBS.
Fig. 1 |
Fig. 1 |. The AR cistrome and genome-wide H3K27ac are systematically reprogrammed during prostate cancer progression and AR relocates to epigenetically pre-marked, “sentinel” sites.
a, Principal component analysis (PCA) reveals distinct AR binding patterns across prostate states. Each dot represents the genome-wide AR cistrome in an individual specimen (seven normal prostate epithelium, 23 primary PCa tumors, 15 PDX tumors derived from patient mCRPC, three PCa cell lines derived from metastatic tissue). b, PCA reveals distinct H3K27ac binding patterns between primary tumors and mCRPC. Each dot represents genome-wide H3K27ac signal in an individual subject (24 primary PCa tumors, 15 PDX tumors derived from patient mCRPC, two metastasis specimens biopsied directly from patients with mCRPC). c, Genes whose expression is upregulated in metastasis compared to primary tumor are enriched for met-K27ac peaks (P < 0.00001). Each dot represents a gene. Red dots are genes with a met-K27ac in the TSS. d, The number of re-programmed AR sites in the transition from primary tumor to mCRPC is substantially greater than the number of re-programmed FOXA1 or HOXB13 sites (P < 0.00001). e, Heat map indicating transcription factor and ATAC-seq signal intensity in normal prostate epithelium and primary prostate tumor. At left, the 9,179 AR T-ARBS. At right, the 17,655 met-ARBS. Each horizontal line represents a 4-kb locus. Shade of red reflects average binding intensity at that site across all subjects in the cohort.
Fig. 2 |
Fig. 2 |. Regulatory sites activated in mCRPC coincide with prostate developmental programs.
a, GREAT analysis characterizing the Gene Ontology biological terms most significantly associated with genes proximal to the 16,047 met-K27ac sites. Terms associated with genitourinary development are highlighted in yellow. b, Across 37 human adult and fetal cell types, met-K27ac is most strongly associated with fetal urogenital sinus. Cell type listed at left (adult tissues are followed by Roadmap Epigenomics Project identification codes). Urogenital sinus sample was performed in replicate. Heat map indicates H3K27ac binding intensity met-K27ac sites across a 4-kb interval. c, met-K27ac is associated with a set of fetal programs distinct from the fetal programs associated with the metastatic breast cancer-specific genome-wide H3K27ac signal. Each curve represents H3K27ac intensity in human fetal cells across the 16,047 met-K27ac sites (left) and the metastatic breast cancer-specific H3K27Ac sites (right).
Fig. 3 |
Fig. 3 |. Functionally relevant mCRPC enhancers are identified by integrating genetic and epigenetic datasets.
a, Regions of overlap between structural variation in prostate tumors and mCRPC-enriched H3K27ac sites. The size of each circular data point reflects density of mCRPC-enriched H3K27ac signal within the region. Genes of interest falling within specific overlap sites are shown. b, At top, H3K27ac tracks in 986-kb region identified in a containing HOXB13. Intensity of ChIP-seq signal was averaged across all DFCI normal prostate, primary prostate tumor and mCRPC specimens, respectively. HiChIP track depicts chromatin looping in the LNCaP cell line. Blue bars show H3K27ac sites meeting criteria for mCRPC enrichment (met-K27ac). Orange bars depict the locus against which guide RNAs (gRNAs) were designed (Methods). Below, magnification of a 156-kb region (bound by red-dotted lines in the upper picture) where met-K27ac and HiChIP signals were strongest. c, Functional interrogation of candidate metastasis-specific enhancers. Left, LNCaP HOXB13 expression in controls (no gRNA and gRNA targeting unrelated gene HPRT1) and after transduction with each gRNA depicted in b. Middle and right, LNCaP cell proliferation over the course of four days. Each shape represents an independent experiment, center line indicates mean, error bars indicate ± s.d. Using Student’s t-test, two-sided: n.s., not significant; *P < 0.05; **P < 0.01, ***P < 0.001.
Fig. 4 |
Fig. 4 |. Genetic variation in prostate cancer is enriched in prostate lineage specific chromatin states.
a, An unsupervised analysis synthesized eight epigenetic marks from four primary prostate tumor specimens (see Methods) and identified ten chromatin states, listed at right. Blue shading depicts average intensity of a particular mark across each chromatin state. b, PCa risk heritability attributable to the ten PCa epigenetic states. Fold enrichment is determined by computing the fraction of heritability accounted for by SNPs within each state, divided by the fraction of SNPs contained within the state genome-wide (Methods). *P < 0.001. c, Somatic mutation density within the ten PCa epigenetic states relative to chromatin state 1 (“Heterochromatin/unmarked”) using 210 PCa whole genome sequences (Methods). *P < 1 × 10⁻⁵.

References

    1. Baca SC et al. Punctuated evolution of prostate cancer genomes. Cell 153, 666–677 (2013). - PMC - PubMed
    1. Banerji S et al. Sequence analysis of mutations and translocations across breast cancer subtypes. Nature 486, 405–409 (2012). - PMC - PubMed
    1. Kunz M et al. RNA-seq analysis identifies different transcriptomic types and developmental trajectories of primary melanomas. Oncogene 37, 6136–6151 (2018). - PubMed
    1. Chen H et al. A pan-cancer analysis of enhancer expression in nearly 9000 patient samples. Cell 173, 386–399 e12 (2018). - PMC - PubMed
    1. Mohammed H et al. Progesterone receptor modulates ERalpha action in breast cancer. Nature 523, 313–317 (2015). - PMC - PubMed

Methods-only References

    1. Singh AA et al. Optimized ChIP-seq method facilitates transcription factor profiling in human tumors. Life Sci. Alliance 2, e201800115 (2019). - PMC - PubMed
    1. Buenrostro JD, Giresi PG, Zaba LC, Chang HY & Greenleaf WJ Transposition of native chromatin for fast and sensitive epigenomic profiling of open chromatin, DNA-binding proteins and nucleosome position. Nat. Methods 10, 1213–1218 (2013). - PMC - PubMed
    1. Corces MR et al. An improved ATAC-seq protocol reduces background and enables interrogation of frozen tissues. Nat. Methods 14, 959–962 (2017). - PMC - PubMed
    1. Langmead B, Trapnell C, Pop M & Salzberg SL Ultrafast and memory-efficient alignment of short DNA sequences to the human genome. Genome Biol 10, R25 (2009). - PMC - PubMed
    1. Zhang Y et al. Model-based analysis of ChIP-Seq (MACS). Genome Biol 9, R137 (2008). - PMC - PubMed

Publication types

Substances