. 2020 Aug;21(8):868-879.
doi: 10.1038/s41590-020-0730-5. Epub 2020 Jul 20.

STEEP mediates STING ER exit and activation of signaling

Affiliations

STEEP mediates STING ER exit and activation of signaling

Bao-Cun Zhang et al. Nat Immunol. 2020 Aug.

Erratum in

  • Author Correction: STEEP mediates STING ER exit and activation of signaling.
    Zhang BC, Nandakumar R, Reinert LS, Huang J, Laustsen A, Gao ZL, Sun CL, Jensen SB, Troldborg A, Assil S, Berthelsen MF, Scavenius C, Zhang Y, Windross SJ, Olagnier D, Prabakaran T, Bodda C, Narita R, Cai Y, Zhang CG, Stenmark H, Doucet CM, Noda T, Guo Z, Goldbach-Mansky R, Hartmann R, Chen ZJ, Enghild JJ, Bak RO, Thomsen MK, Paludan SR. Zhang BC, et al. Nat Immunol. 2020 Nov;21(11):1468-1469. doi: 10.1038/s41590-020-0803-5. Nat Immunol. 2020. PMID: 32929276

Abstract

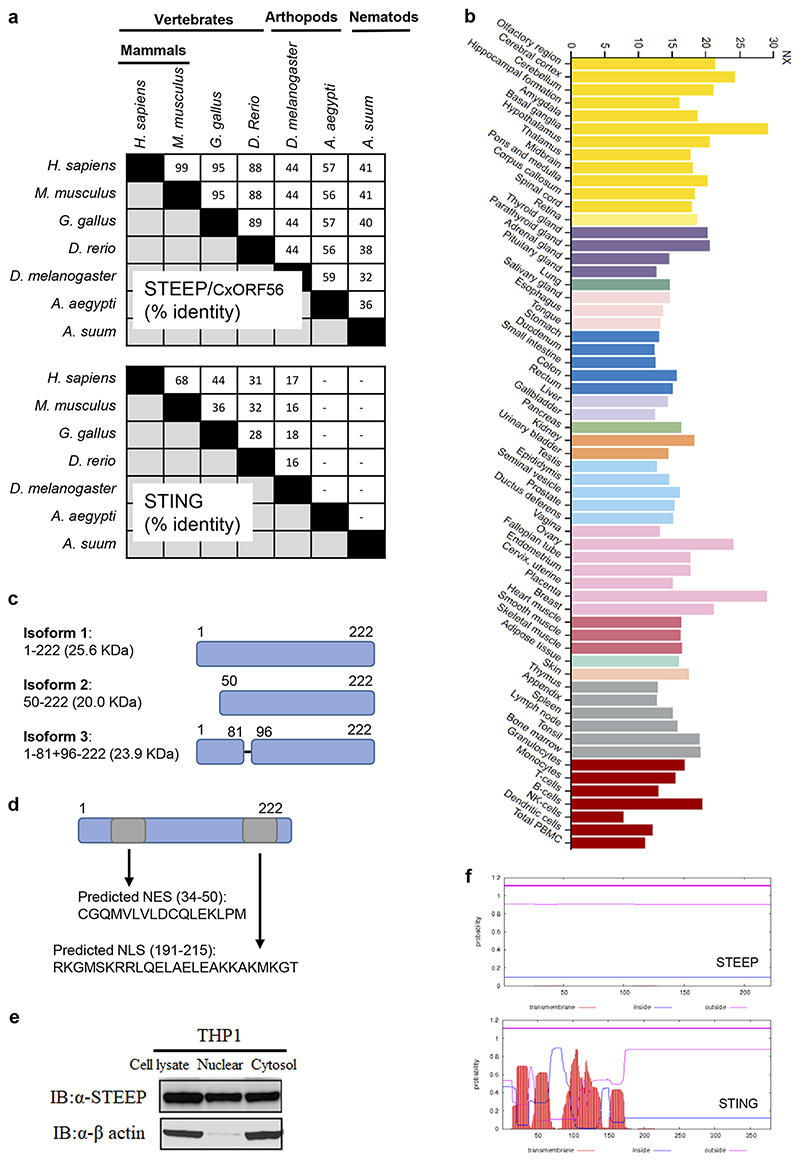
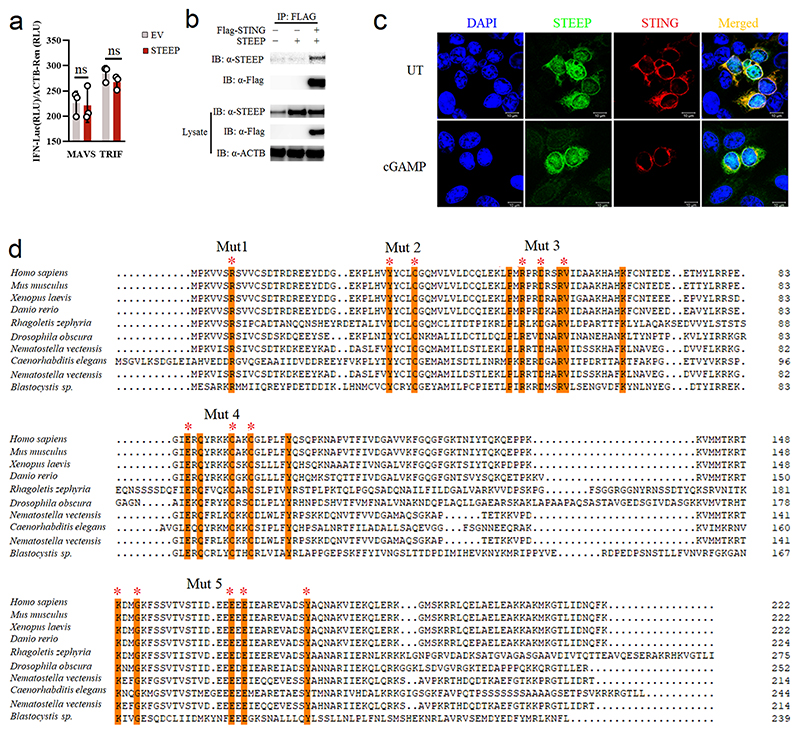
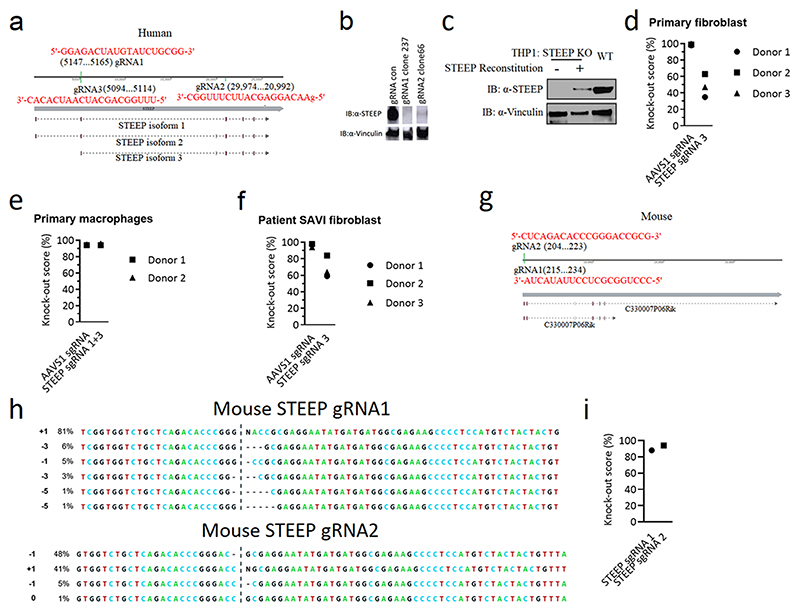
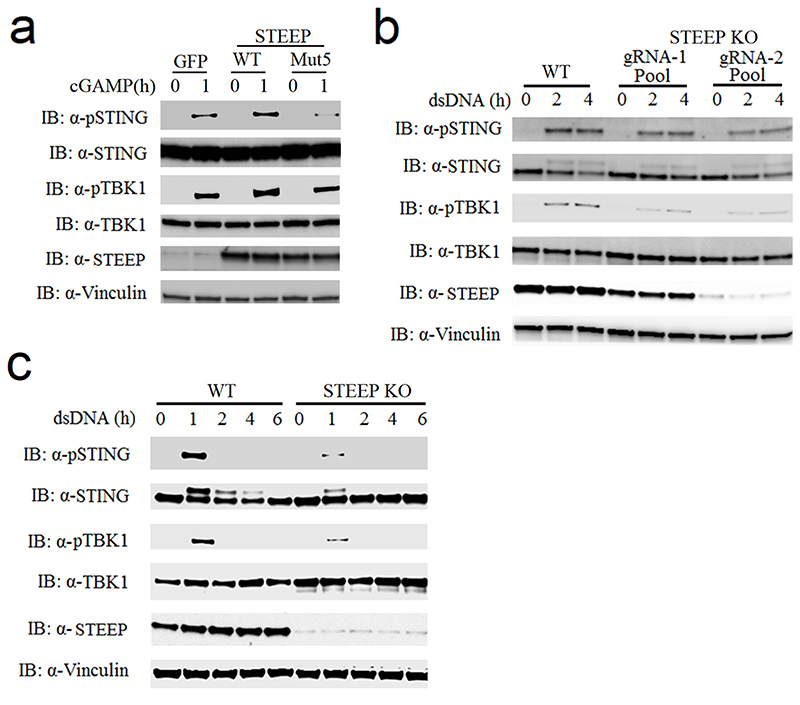
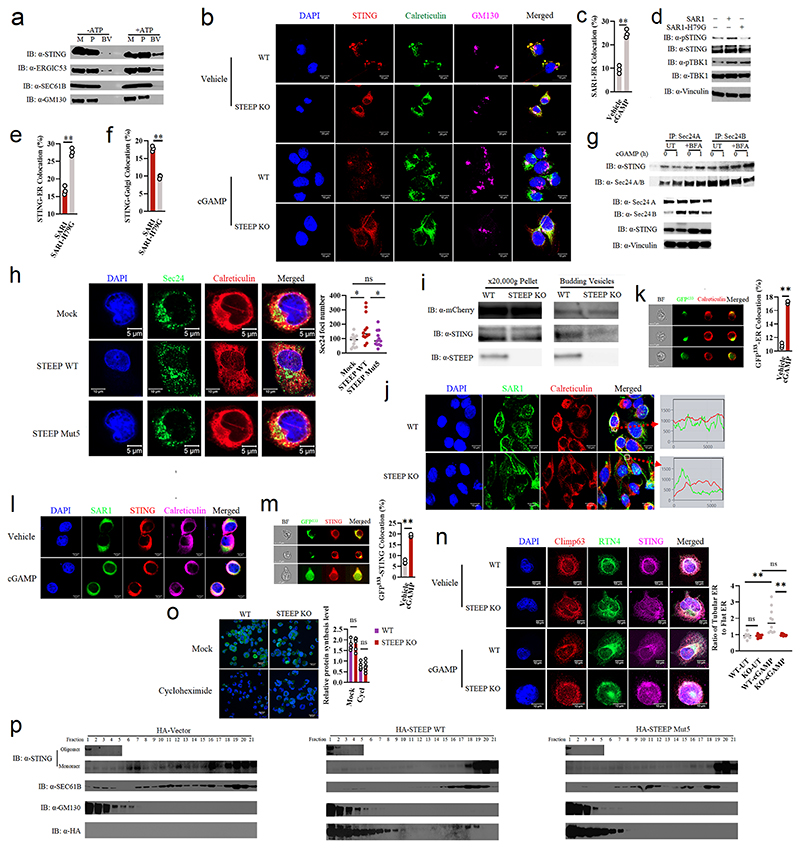
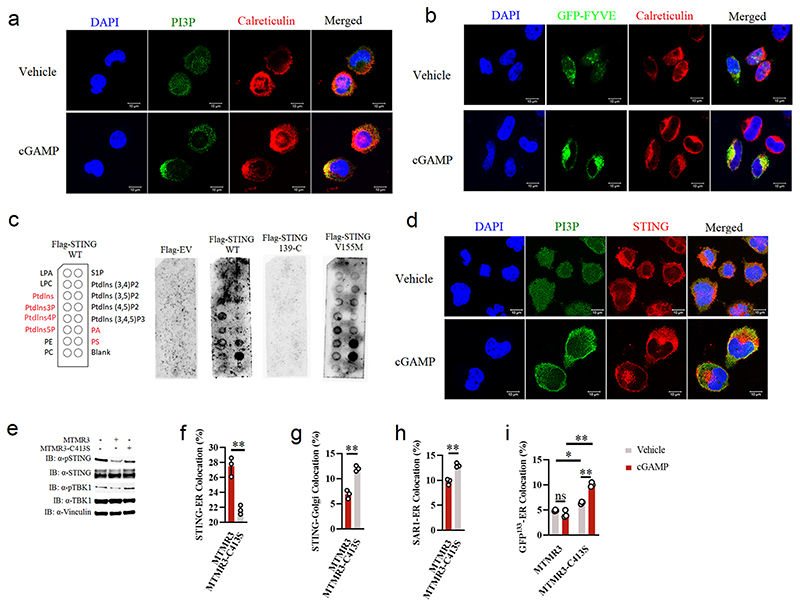
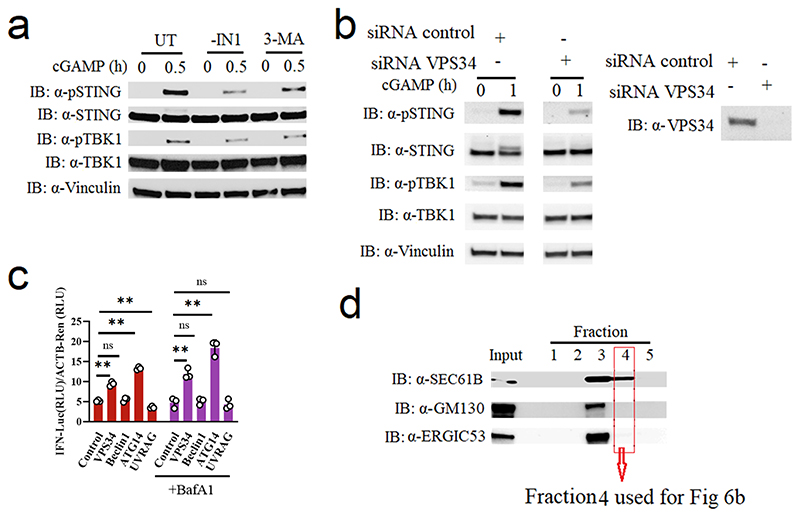
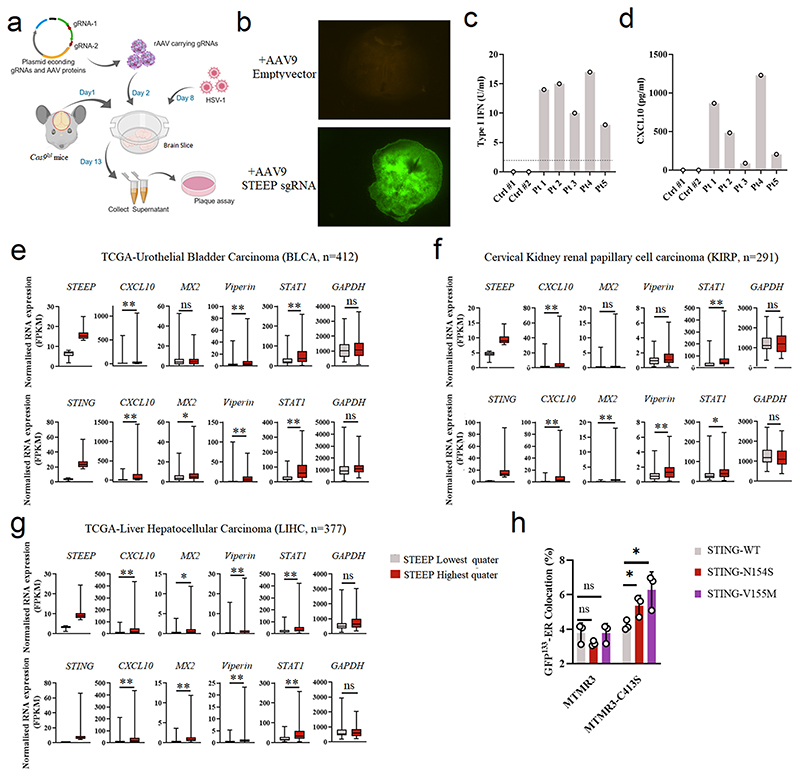
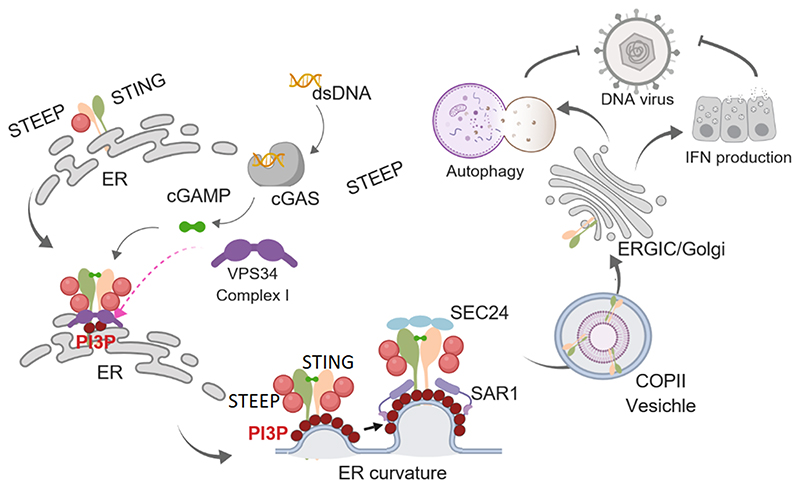
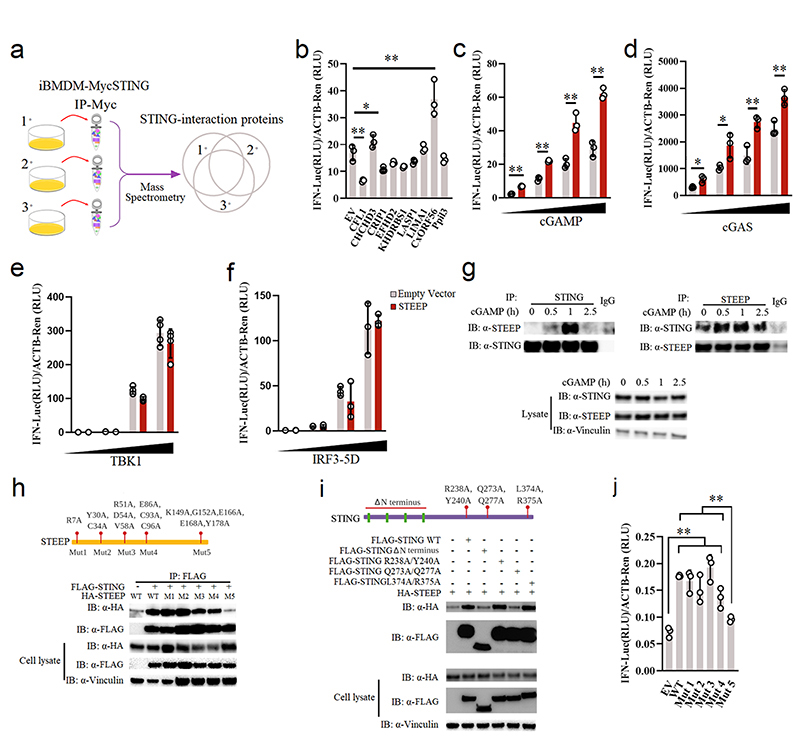
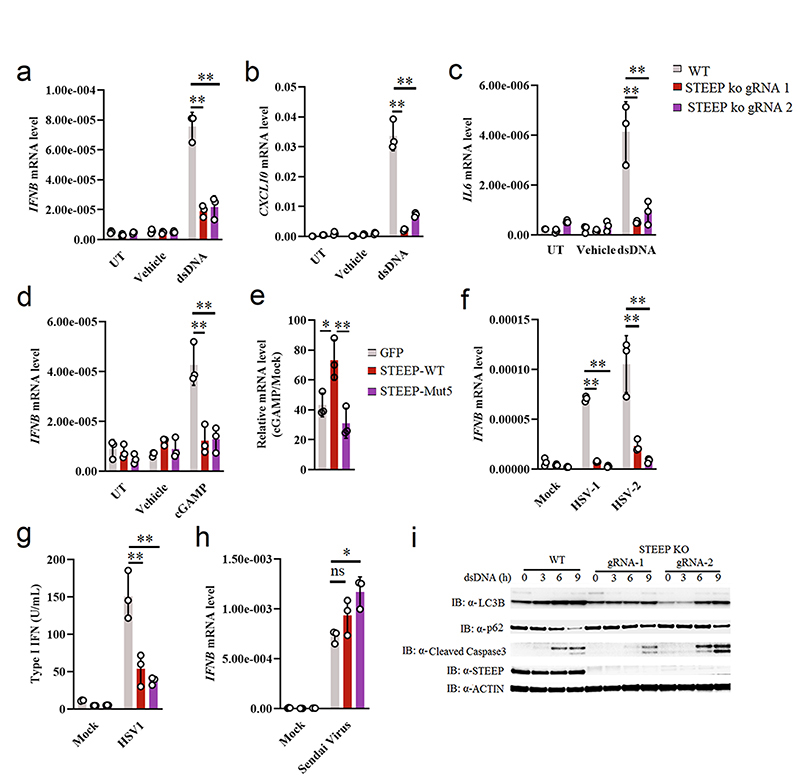
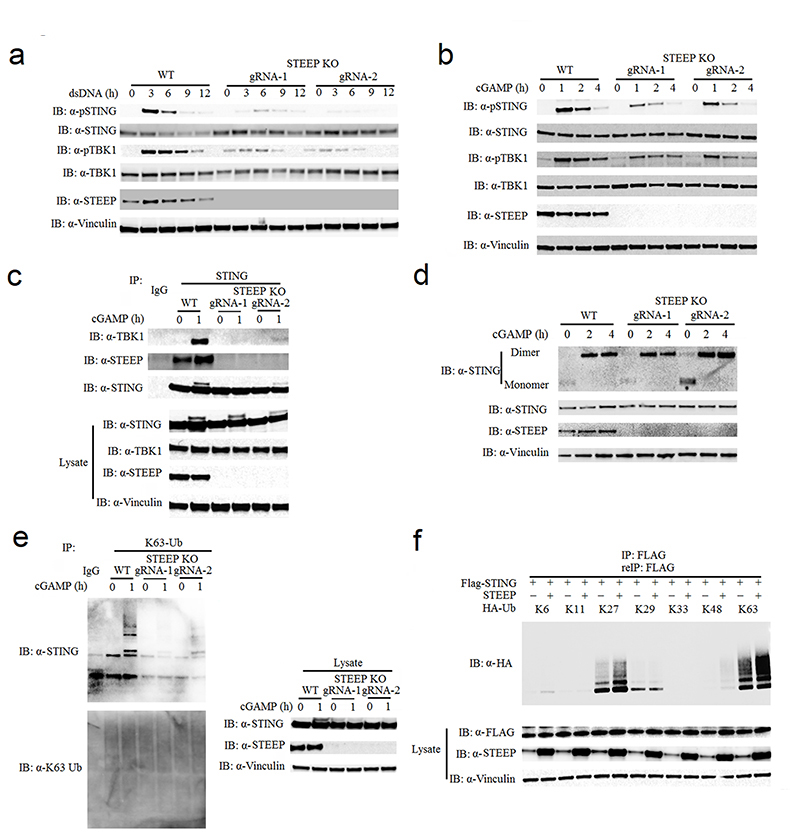
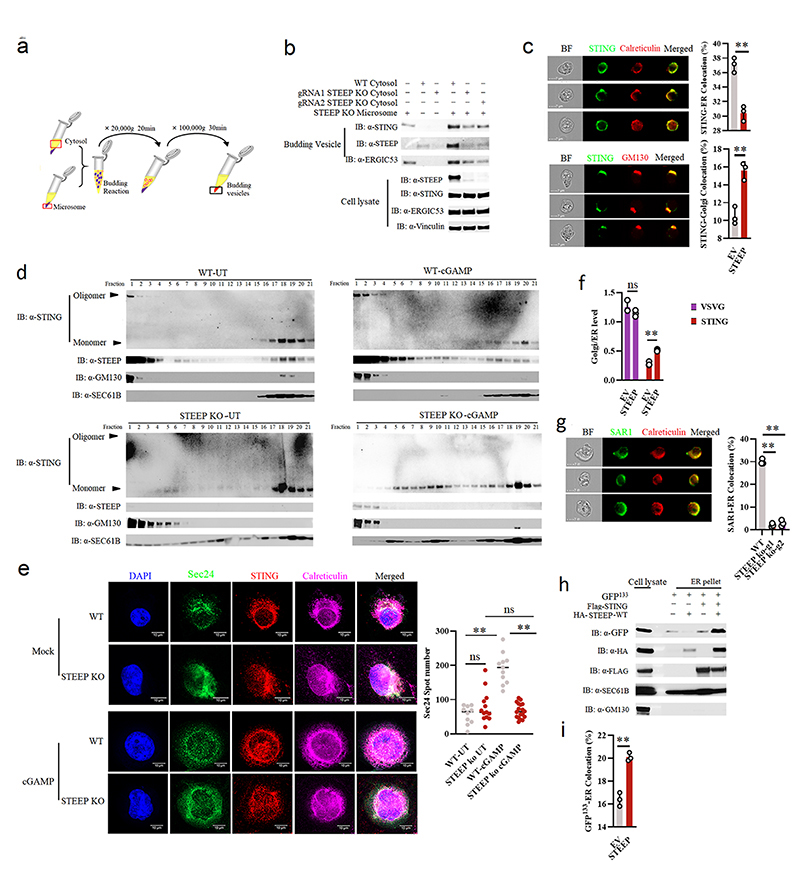
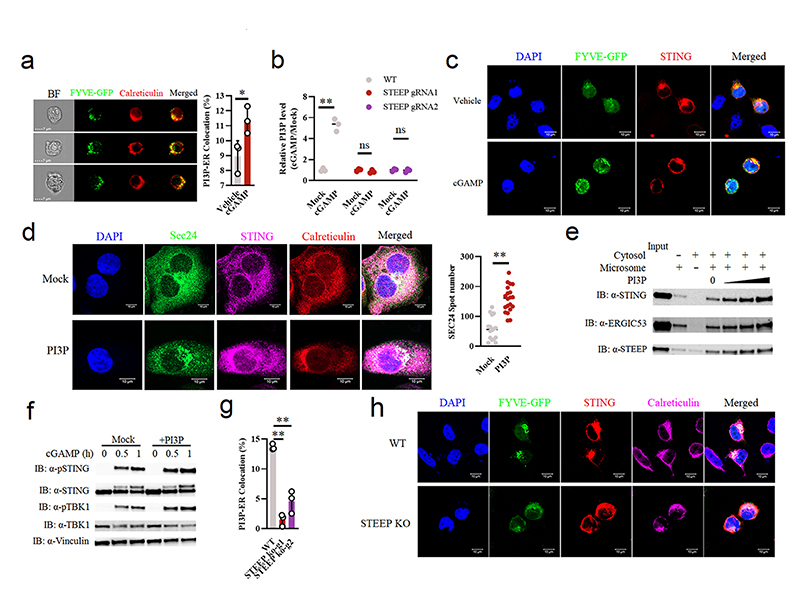
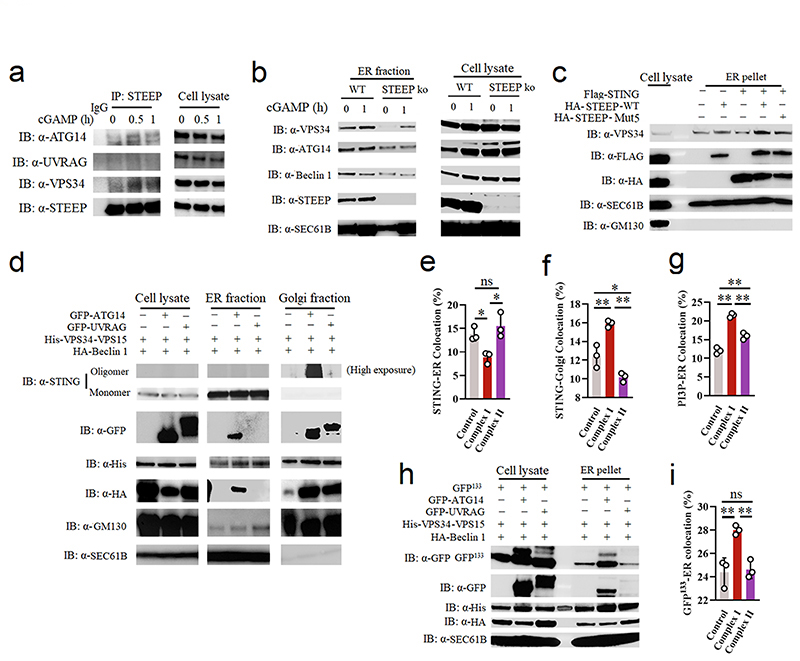
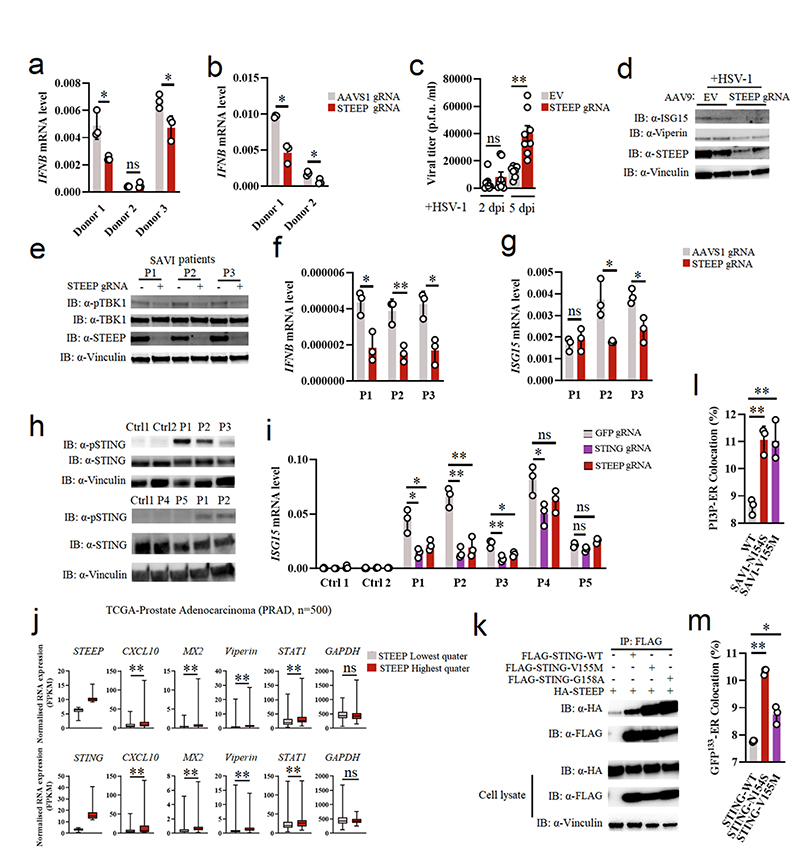
STING is essential for control of infections and for tumor immunosurveillance, but it can also drive pathological inflammation. STING resides on the endoplasmic reticulum (ER) and traffics following stimulation to the ERGIC/Golgi, where signaling occurs. Although STING ER exit is the rate-limiting step in STING signaling, the mechanism that drives this process is not understood. Here we identify STEEP as a positive regulator of STING signaling. STEEP was associated with STING and promoted trafficking from the ER. This was mediated through stimulation of phosphatidylinositol-3-phosphate (PtdIns(3)P) production and ER membrane curvature formation, thus inducing COPII-mediated ER-to-Golgi trafficking of STING. Depletion of STEEP impaired STING-driven gene expression in response to virus infection in brain tissue and in cells from patients with STING-associated diseases. Interestingly, STING gain-of-function mutants from patients interacted strongly with STEEP, leading to increased ER PtdIns(3)P levels and membrane curvature. Thus, STEEP enables STING signaling by promoting ER exit.


Conflict of interest statement

Competing Interests Statement

The authors declare no competing interests.

Figures

Extended Data Fig. 1
Extended Data Fig. 1. Basic characteristics and properties of CxORF56/STEEP.
(a) Comparison of protein sequence identify between STING and STEEP in different species. (b) mRNA Expression of STEEP in human tissues. The data are from proteinatlas.org. (c) Illustration of the three known isoforms of STEEP. Source, uniprot.org. (d) Predicted nuclear localization and nuclear exit signals in STEEP, based on sequence analyses by cNLS mapper and LocNES, respectively. (e) Whole cell lysates, cytoplasmic fractions, and nuclear fractions from PMA-differnetiated THP-1 cells were immunoplotted for STEEP and β-actin. A representative blot is shown from n = 3 biologically independent experiments with similar results. (f) Predicted transmembrane regions in STEEP and STING. Based on sequence analysis by TMHMM.
Extended Data Fig. 2
Extended Data Fig. 2. STEEP is a positive regulator in STING pathway.
(a) Reporter gene assay for HEK-293T cells transfected with 50 ng STEEP or empty vector, IFNB1 promoter luciferase reporter, β-actin Renilla reporter, and MAVS or TRIF as indicated for 24 h (n = 3) (ns P = 0.86, ns P = 0.23, lift to right). (b) Immunoprecipitation of Flag-tagged STING and STEEP (n = 3 biologically independent experiments). (c) Confocal microscopy of HeLa cells transfected with HA-STEEP and FLAG-STING for 24 h followed by mock treatment or cGAMP stimulation. Representative data from one experiment are shown (n = 3 biologically independent experiments). (d) Alignment of STEEP/CxORF56 from the indicated species, and highlight of residues mutated to alanine in Mut 1-5. Data in panel a are shown as means of biological triplicates +/- st.dev. Statistical analysis of data shown in panel a was performed using two-tailed Student’s t-test.
Extended Data Fig. 3
Extended Data Fig. 3. Targeting of STEEP by CRISPR.
(a) Illustration of gRNAs sequence and location used to target human STEEP. (b) Immunoblot for STEEP in THP-1-derived clones transduced with STING-targeting gRNAs. (c) STEEP KO THP-1 cells were transfected with mRNA encoding WT STEEP. 24 h later, the cells were lysed, and immunoblotted as shown. For comparison, lysates from WT THP-1 cells were included. (d-f) Efficiency of STEEP gene targeting in primary human fibroblasts (d), primary human macrophage (e) and SAVI patient fibroblasts (f). (g) gRNAs used to target STEEP in mice. (h-i) Efficiency of STEEP targeting in MEF cells. The KO scores were calculated based on the ICE Analysis tool from Synthego. In panels b and c, data shown are representative blots from three biologically independent experiments with similar results.
Extended Data Fig. 4
Extended Data Fig. 4. Effect of STEEP KO on STING signaling.
(a) STEEP KO THP-1 cells electroporated with GFP mRNA, WT STEEP mRNA or mut5 STEEP mRNA were stimulated with cGAMP (150 nM, 1 h). Levels of pSTING and pTBK1 were monitored by Immunoblotting. (n = 3 biologically independent experiments). (b-c) Immunoblot analysis of the indicated proteins from whole cell lysates of WT or STEEP KO Hela cells (b) and human foreskin fibroblasts (c) after stimulation with dsDNA for the indicated time intervals. (n = 3 biologically independent experiments). All data shown in this figure are representative blots from three biologically independent experiments.
Extended Data Fig. 5
Extended Data Fig. 5. Impact of STEEP on STING trafficking.
(a) The in vitro membrane budding reaction illustrated in Fig. 4a was performed with material from wild-type THP-1 cells in the presence or absence of ATP. M, membranes; P, post 20.000 g pellet; BV, budding vesicles. Representative blots from three biologically independent experiments with similar results are shown. (b) Confocal microscopy of WT Hela and STEEP KO Hela cells stimulated with/without cGAMP for 0.5 h. The cells were immunostained with anti-STING (red), anti-calreticulin (green), anti-GM130 (purple). Sections were counterstained with DAPI to visualize nuclei. (n = 3 biologically independent experiments). (c) ImageStream analysis of Sar1-ER colocation. FLAG-tagged Sar1 was transfected into HEK-293T with STING expression cells for 24 h, and stimulated with/without cGAMP (100 nM) for 30 min. After fixation and permeabilization, the cells were incubated with rabbit anti-calreticulin (ER marker) and mouse anti-FLAG. (n = 3) (**P = 0.00042). (d) Immunoblot analysis of the indicated proteins from the whole Hela cell lysates transfected with SAR1 or SAR1-H79G. (n = 3 biologically independent experiments). (e, f) Imagestream analysis of STING trafficking from ER (e) to Golgi (f) after transfection of SAR1 or SAR1-H79G for 24 h in HEK-293T with STING expression cells (e, **P = 0.00035; f, **P = 0.00010). (g) Endogenous Sec24 was immunoprecipitated from THP-1 cell lysates isolated after +/-BFA treatment and cGAMP (100 nM) stimulation for the indicated time. Precipitates and lysates were immunoblotted with antibodies against Sec24A/B, STING, and vinculin (n = 3 biologically independent experiments). (h) Confocal microscopy analysis of Sec24 foci in STEEP KO THP-1 cells rescued with WT or mut5 STEEP mRNA and stimulated with cGAMP for 10 min. Nuclei were stained with DAPI. For quantification of Sec24 foci, 12 cells per group were counted in a blinded fashion. Representative data from one experiment are shown (n = 3 biologically independent experiments). Each data point represents one cell and data are shown as means +/- st.dev. Statistical analysis was performed by a two-tailed unpaired t test with welch’s correction (*P = 0.016, ns P = 0.51, *P = 0.045, left to right). (i) Budding vesicle analysis (as illustrated in Fig 4a) for mCherry-VSVG and STING on WT and STEEP KO Hela cells transfected with mCherry-VSVG. The data shown is representative from two biologically independent experiments with similar results. (j) Confocal microscopy imaging of SAR1-Flag (green) and calreticulin (red, ER marker) in WT and STEEP KO Hela cells stimulated with cGAMP (100 nM) for 20 min. Sections were counterstained with DAPI to visualize nuclei. (n = 3 biologically independent experiments). (k) Imagestream analysis of ER membrane curvature in Flag-STING-transfected HEK-293T cells probed with GFP133 with/without 100 nM cGAMP stimulation for 20 min. (n = 3) (**P = 0.000011). (l) Confocal microscopy analysis Hela cells transfected with Flag-tagged STING and GFP133 and treated with 100 nM cGAMP stimulation for 20 min. Cells were probed with antibodies against of STING (Red) and Calreticulin (ER marker, Purple). GFP133 (green) is an ER membrane curvature probe. (n = 3 biologically independent experiments). (m) Imagestream analysis of ER membrane curvature and STING colocation in HEK-293T cells with/without 100 nM cGAMP stimulation for 20 min. (n = 3) (**P = 0.000044). (n) WT and STEEP KO THP-1 cells were stimulated with cGAMP for 10 min, fixed and stained with anti-Clim63, anti-RTN4, and anti-STING. Nuclei were stained with DAPI. For quantification of RTN4:Climp63 ratio, 10 cells per group were counted in a blinded fashion. Representative data from one experiment are shown (n = 3 biologically independent experiments). Each data point represents one cell and data are shown as means +/- st.dev. Statistical analysis was performed by a two-tailed unpaired t test with welch’s correction (ns P = 0.64, **P = 0.0046, **P = 0.0060, ns P = 0.071). (o) Analysis of protein synthesis in WT and STEEP KO THP-1 cells using the Click-iT™ HPG Alexa Fluor™ 488 Protein Synthesis Assay Kit (n = 6) (ns P = 0.62, ns P = 0.10, left to right). (p) ER- and Golgi-enriched pellets from lysates of STEEP-deficient Hela cells transfected with empty vector, HA-STEEP WT, or HA-STEEP mut5 were fractionated by gradient centrifugation. The collected fractions were immunoblotted with anti-STING, anti-HA, anti-GM130 (Golgi), and anti-Sec61B (ER). Representative blots from one experiment are shown (n = 3). For data from ImageStream analysis (panel c, e, f, k, and m), each data point represents the percent of positive cells from one representative sample and are shown as means +/- st.dev. Statistical analysis of data in panels c, e, f, k, m, and o was performed using two-tailed Student’s t-test.
Extended Data Fig. 6
Extended Data Fig. 6. STEEP promotes PI3P production and ER membrane curvature.
(a, b) Confocal microscopy analysis of PI3P level on ER. PI3P was probed with anti-PI3P antibody in THP-1 cells (a), or FYVE-GFP in Hela cells (b) or with/without 100 nM cGAMP stimulation for 20min. ER was stained and visualized using rabbit anti-Calreticulin (ER marker, Red) and mouse anti-flag, and relevant secondary antibodies. (c) PIP Strip membranes blotted with various lipids were incubated sequentially with Flag-tagged WT, 139-C, or V155M STING or with empty vector (EV). An anti-Flag antibody conjugated with HRP was used to visualize the binding. Phospholipids with clear positive binding to WT STING are highlighted in red on the left PIP Strip illustration. (d) Confocal analysis for the colocation of anti-STING and anti-PI3P antibodies in THP-1 cells with/without 100 nM cGAMP stimulation for 15 min. (e) Immunoblot analysis of the indicated proteins from the whole cell lysates of Hela cells transfected MTMR3/MTMR3-C143S, and stimulated for 1h with cGAMP. (n = 3 biologically independent experiments). (f, g) Imagestream analysis of STING trafficking from ER (f) to Golgi (g). HEK-293T cells were transfected by MTMR3/MTMR3-C143S and Flag-tagged STING for 24 h and stimulated cGAMP (150 nM) for 30 min. After fixation and permeabilization, flag and ER were labelled using rabbit anti-calreticulin (ER marker) and mouse anti-flag, and relevant secondary antibodies. (n = 3) (f, **P = 0.0020; g, **P = 0.00088). (h) Imagestream analysis of SAR1-ER colocation. Hela cells were transfected by MTMR3/MTMR3-C143S and Flag-tagged SAR1 for 24 h and stimulated cGAMP (100 nM) for 30 min. After fixation and pre-permeabilization, ER and Flag were labelled using rabbit anti-calreticulin (ER marker) and mouse anti-flag, and relevant secondary antibodies. (n = 3) (**P = 0.0014). (i) Imagestream analysis of ER membrane curvature. HEK cells were co-transfected by MTMR3/MTMR3-C143S, Flag-tagged STING and GFP133 for 24 h and stimulated with/without cGAMP for 30 min. After fixation and pre-permeabilization, the cells were stained with anti-calreticulin and relevant secondary antibodies. (n = 3) (ns P = 0.26, *P = 0.012, **P = 4.3E-05, **P = 1.0E-06, left to right). Panels a-e, representative images from n = 3 biologically independent experiments with at least 2 times similar results are shown. For data from ImageStream analysis (panel f, g, h, i), each data point represents the percent of positive cells from one representative sample and are shown as means +/- st.dev. Statistical analysis of data in panels f-h was performed using two-tailed Student’s t-test, and in panel i was performed using two-tailed one-way ANOVA test.
Extended Data Fig. 7
Extended Data Fig. 7. Vps34 Complex I promotes STING activation.
(a) Immunoblot analysis of the indicated proteins from the cell lysates of THP-1 cells pre-treated with DMSO, 10 uM VPS34 inhibitor (VPS34-IN1) or 5 mM 3-MA and then stimulated with 150 nM cGAMP for the indicated time intervals. (n = 3 biologically independent experiments). (b) Immunoblot analysis of the indicated proteins from the cell lysates of HaCaT cells transfected with siRNA-control or siRNA-vps34 for 36 h and then stimulated with cGAMP for the indicated times. (n = 3 biologically independent experiments). (c) Reporter gene assay. HEK-293T with STING stable expression cells were transfected with 50 ng VPS34, Beclin1, ATG14, UVRAG or empty vector, IFNB1 promoter luciferase reporter, and β-actin Renilla reporter. After transfection for 24 h, the cells were treated with/without BafA1 and then stimulated with 200 nM cGAMP for 6 h (n = 3). Statistical analysis of data in panel c was performed using two-tailed one-way ANOVA test (**P = 1.87E-06, ns P = 0.88, **P = 2.46E-09, **P = 0.0063, **P = 0.00053, ns P = 0.10, **P = 1.74E-06, ns P = 0.99, left to right). (d) The isolation of THP-1 cell fractions were obtained by Opti-prep gradient. After collecting the different layers, immunoblot analysis of the indicated proteins was carried out to probe for organelle enrichment of each fraction. The input was from whole cell lysate. Representative blots from two biologically independent experiments with similar results are shown. Data in panel c are shown as means of biological sample triplicates +/- st.dev.
Extended Data Fig. 8
Extended Data Fig. 8. Role for STEEP in host defense and inflammation.
(a) The workflow for examination of HSV1 replication in genome-edited brain slices from Cas9lsl mice. (b) To evaluate expression from the Cas9 and GFP-containing locus, emission of fluorescence from AAV9-treated Cas9lsl brain slices was monitored. The images represent brain slices 6 days after treatment. Representative images from two biologically independent experiments with similar results are shown. (c-d) Levels of type I IFN bioactivity and CXCL10 protein in serum from five SLE patients and two healthy donors. (e-g) Box plots of TCGA RNA expression profiles in Bladder Urothelial Carcinoma (BLCA, e), Cervical Kidney renal papillary cell carcinoma (KIRP, f), and Liver Hepatocellular Carcinoma (LIHC, g). Samples with the highest 25% and the lowest 25% of STEEP (upper panels) and STING (lower panels) expression were selected and grouped. CXCL10, MX2, Viperin (RSAD2), STAT1 and GAPDH gene expression levels were compared between STEEP/STING-high and STEEP/STING-low groups. The upper and lower ends of the boxes represent the upper and lower quartiles, and the horizontal line inside the box is median of the dataset. The bar extending parallel from the boxes is the “whiskers”, indicating upper and lower extreme of the dataset. Statistical significance was evaluated using two-tailed Mann-Whitney test (ns P > 0.01, *P < 0.01, **P < 0.001). (h) Imagestream analysis of ER membrane curvature. HEK-293T cells were co-transfected by MTMR3/MTMR3-C143S, STING/ STING SAVI mutant and GFP133 for 24 h. After fixation and pre-permeabilization, the cells were stained with anti-calreticulin and relevant secondary antibodies. (n = 3) (ns P = 0.15, ns P = 0.10, *P = 0.038, *P = 0.029, left to right). For data from ImageStream analysis (panel h), each data point represents the percent of positive cells from one representative sample and are shown as means +/- st.dev. Statistical analysis of data panel h was performed using two-tailed Student’s t-test.
Extended Data Fig. 9
Extended Data Fig. 9. Proposed model for action of STEEP in STING signaling.
Interaction between STEEP and STING is observed in the resting state, but this is augmented following STING activation. This may involve the conformational change imposed on STING following cGAMP binding or mediated with low threshold in SAVI gain-of-function STING mutants. The STEEP-STING association increases recruitment of the VPS34 complex I to produce PI3P on the ER. The PI3P accumulation in turn induces ER membrane curvature in the STING containing areas, thus recruiting the COPII complex factors SAR1 and SEC24 to ER to form the ER exit site. This finally sorts STING into COPII vesicles for delivery to ERGIC/Golgi to enable antiviral and inflammatory responses.
Figure 1
Figure 1. Identification of STEEP as a positive regulator of STING signaling.
(a) Set-up for identification of STING-interacting proteins. (b) Reporter gene assays for IFNB1 promoter activity in STING-expressing HEK-293T cells co-transfected with the indicated expression plasmids for 24 h, and stimulated by 100 nM cGAMP for 6 h (n = 3) RLU, relative light units. (**P = 0.00051, *P = 0.047, **P = 0.0087, left to right). (c) IFNB1 reporter gene assays in STING-expressing HEK-293T cells transfected with STEEP for 24 h, and stimulated with increasing concentrations of cGAMP (n = 3). (**P = 2.37E-05, **P = 0.00014, **P = 0.0024, **P = 0.00049, left to right). (d-f) IFNB1 reporter gene assays in (d) HEK293T-STING or (e-f) HEK-293T cells transfected with STEEP, and increased concentration of cGAS (n = 3) (**P = 0.016, **P = 0.023, **P = 0.0057, **P = 0.0075, left to right), TBK1 (n = 4) or IRF3-5D (n =3) as indicated for 24 h. (g) Immunoprecipitates and lysates from THP1 cells stimulated with cGAMP (100 nM) were immunoblotted with antibodies against STEEP, STING, and vinculin (n = 3). (h) FLAG was immuno-precipitated from HEK-293T lysates transfected with FLAG-STING and HA-tagged STEEP (WT and indicated mutants). Precipitates were immunoblotted with anti-HA (n = 3). (i) FLAG in lysates from HEK-293T cells expressing FLAG-STING (WT and indicated mutants) together with HA-STEEP was immunoprecipitated, and immuno-blotted with anti-HA (n = 3). (j) IFNB1 reporter gene assays for STING-expressing HEK-293T cells transfected with 50 ng of STEEP (WT or mutants), and IFNB1 promoter luciferase reporter, β-actin Renilla reporter for 24 h (n = 3) (**P < 0.01). Data in panel b-f and j are shown as means of cell culture triplicates +/- st.dev. Statistical analysis of data in panel b and j was performed using two-tailed one-way ANOVA test, and panel c and d was performed using two-tailed Student’s t-test.
Figure 2
Figure 2. STEEP is essential for IFN induction through the cGAS-STING pathway.
(a-d) WT and STEEP-deficient THP-1 cells were treated with (a-c) dsDNA (500 ng/ml, 6h) (**P < 0.01), (d) 2’3’ cGAMP (100 nM, 2h) (**P = 0.0022, **P = 0.0025, left to right). Total RNA was isolated, and IFNB, CXCL10, and IL6 mRNA were measured as indicated by RT-qPCR. (e) STEEP-deficient THP-1 cells transfected with mRNA encoding GFP, STEEP-WT or STEEP-Mut5, and subsequently stimulated with cGAMP (100 nM, 2h) (**P = 0.032, **P = 0.0068, left to right). IFNB was measured by RT-qPCR. (f-h) WT and STEEP-deficient THP-1 cells were infected with (f-g) HSV1 or HSV2 (both MOI 1, 12 h) (**P < 0.01), or (h) Sendai virus (MOI 1, 12 h) (ns P = 0.19, *P = 0.014, left to right). . Total RNA or culture supernatants were isolated, and IFNB mRNA and type I IFN bioactivity were measured as indicated by RT-qPCR and biological assay, respectively. (n = 3, biologically independent samples) (i) WT and STEEP-deficient THP-1 cells were treated with dsDNA (2 ug/ml) for the indicated time intervals, and levels of LC3, p62, cleaved caspase 3 (CC3), STEEP and actin were determined by immunoblotting. Representative blot from three independent experiments with similar results are shown. Data in panel a-h are shown as means of biological sample triplicates +/- st.dev. (n = 3 biologically independent samples for all data sets in the figure). Statistical analysis of data presented in panel a-h was performed using two-tailed one-way ANOVA test.
Figure 3
Figure 3. STEEP is essential for STING ubiquitination and recruitment of TBK1.
(a, b) Immunoblot analysis for the indicated proteins from whole cell lysates of WT or STEEP-deficient THP-1 cells after stimulation with (a) dsDNA or (b) cGAMP for the indicated time intervals. (n = 3 biologically independent experiments). (c) Immunoblot analysis of proteins co-immunoprecipitated with endogenous STING probed with the indicated antibodies. The lysates used for the immunoprecipitation were from WT or STEEP-deficient THP-1 cells stimulated with cGAMP for 1 h. (n = 3 biologically independent experiments). (d) STING dimerization assay. Immunoblot analysis with anti-STING probing of lysates from WT or STEEP-deficient THP-1 cells after stimulation with cGAMP for the indicated time intervals. The lysates were run on non-reducing SDS-PAGE prior to blotting. For controls reduced samples were run in parallel and blotted for STING, STEEP, and vinculin. (n = 3 biologically independent experiments). (e) K63-linkage ubiquitin TUBE assay and immunoblotting using anti K63-linkage ubiquitin and anti-STING antibodies. The material used was whole cell lysates from WT or STEEP-deficient THP-1 cells stimulated with cGAMP for 1 h. (n = 3 biologically independent experiments). (f) HEK-293T cells were transfected with FLAG-tagged STING, STEEP, HA-tagged Ub-K11, Ub-K27, Ub-K29, Ub-K33, Ub-K48 or Ub-K63 before co-immunoprecipitation and immunoblot analysis were performed with the indicated antibodies. (n = 3 biologically independent experiments).
Figure 4
Figure 4. STEEP is essential for STING trafficking from ER to Golgi.
(a) Illustration of the in vitro membrane budding reaction. (b) Immunoblot analyses of budded material from the in vitro membrane budding reactions using cytosolic fractions from WT or STEEP-deficient THP-1 cells and microsomes from STEEP-deficient THP-1 cells. (n = 3 biologically independent experiments). (c) HEK-293T cells were transfected as indicated and probed with mouse anti-FLAG and either rabbit anti-calreticulin (ER marker) or anti-GM130 (Golgi marker). Cells were analysed by ImageStream. (n = 3) (**P = 0.0013, **P = 0.0030, up to down). (d) ER- and Golgi-enriched pellets from mock- or cGAMP-treated WT and STEEP-deficient HeLa cells were fractionated, and immunoblotted for STEEP, STING, GM130 (Golgi), and Sec61B (ER) (n = 2 biologically independent experiments). (e) WT and STEEP-deficient THP-1 cells stimulated with cGAMP for 10min were stained with anti-Sec24, anti-STING, and anti-calreticulin. For quantification of Sec24 foci, 10, 13, 11, and 18 cells from the WT-Mock, STEEP KO-Mock, WT-cGAMP, and STEEP KO-cGAMP, respectively were counted in a blinded fashion. Representative data from one experiment are shown (n = 3 biologically independent experiments). Statistical analysis used: two-tailed unpaired t test with welch’s correction. Each data point represents one cell and are shown as means +/- st.dev. (ns P = 0.15, **P < 0.000001, nsP = 0.41, **P < 0.000001, left to right). (f) HEK-293T cells transfected with STING, VSVG, and STEEP as indicated for 24 h were subjected to ImageStream analysis for colocalization of STING and VSVG with ER and Golgi. The data are shown as Golgi/ER (n = 3) (ns P = 0.18, **P = 0.00050, left to right). (g) FLAG-tagged Sar1 was transfected into WT or STEEP-deficient Hela cells for 24 h, and stimulated with cGAMP (100 nM, 30 min) Cells were probed with rabbit anti-calreticulin (ER marker) and mouse anti-FLAG. (n = 3) (**P = 0.0000040, **P = 0.000012, left to right). (h) HEK-293T cells were transfected as indicated. ER-enriched pellets precipitated with calcium chloride were immunoblotted for GFP, HA, GM130 (Golgi), and Sec61B (ER). (n = 3 biologically independent experiments). (i) GFP-tagged ALPS (GFP133) was co-transfected with the indicated vectors into HEK-293T cells for 24 h. Fixed cells were probed with rabbit anti-calveticulin (ER marker). (n = 3), and analyzed by ImageStream (**P = 0.00080). For data from ImageStream analysis (panels c, f, g, and i), each data point represents the percent of the positive cells from one representative sample and are shown as means +/- st.dev. Statistical analysis of data in panels c, f, g, and i was performed using two-tailed Student’s t-test.
Figure 5
Figure 5. STEEP governs PI3P accumulation on ER to promote STING ER exit.
(a) HEK-293T cells were co-transfected with GFP-tagged FYVE domain and FLAG-tagged STING for 24 h and stimulated cGAMP (150 nM, 30 min). Cells were analysed by ImageStream for PI3P and ER colocalization. ER, calreticulin. (n = 3) (*P = 0.038). (b) WT and STEEP-deficient HeLa cells were treated with cGAMP (100 nM, 1 h). Acidic lipids were isolated from ER fractions, and PI3P was measured by ELISA. Data are shown as means of biological sample triplicates +/- st.dev. (n = 3 biologically independent samples) (**P = 0.00028, ns P = 0.24, ns P = 0.66, left to right). (c) Confocal microscopy of Hela cells transfected with GFP-FYVE and FLAG-tagged STING, treated with cGAMP (100 nM, 20 min), and immunostained with and anti-FLAG (red). Representative data from one experiment are shown (n = 3 biologically independent experiments). (d) Confocal microscopy of THP-1 cells treated with vehicle or PI3P (100 uM, 2 h), and stained with anti-calreticulin, anti-Sec24, and anti-STING. For quantification of Sec24 foci, 16 and 20 cells from the Mock and PI3P-treated groups, respectively, were counted in a blinded fashion. Representative data from one experiment are shown (n = 3 biologically independent experiments). Statistical analysis was performed using two-tailed unpaired t-test with welch’s correction. Each data point represents one cell and are shown as means +/- st.dev (**P < 0.000001). (e) Immunoblotting of budded material from the in vitro membrane budding reactions incubated with increasing concentrations of PI3P (1 uM, 10 uM and 100 uM). (n = 3 biologically independent experiments). (f) Immunoblotting for the indicated proteins in whole cell lysates from THP-1 cells treated with PI3P (50 uM, 30 min) prior to stimulation with cGAMP, and incubation for the indicated time intervals. (n = 3 biologically independent experiments). (g, h) WT and STEEP-deficient Hela cells were transfected with GFP-tagged FYVE and FLAG-tagged STING for 24 h and stimulated with cGAMP for 20 min. The fixed cells were stained with anti-FLAG, anti-calreticulin and analyzed by ImageStream and Confocal microscopy. (n = 3) (**P = 0.000047, **P = 0.0013, left to right). h, a representative image from 2 biologically independent experiments with similar results is shown. For ImageStream data analysis (panels a, g), each data point represents the percent of the positive cells from one representative sample and shown as means +/- st.dev. Statistical analysis of data presented in panels a, b, and g was performed using two-tailed Student’s t-test.
Figure 6
Figure 6. STEEP recruits the VPS34 complex I to ER to produce PI3P.
(a) Immunoblot analysis for the indicated proteins in anti-STEEP immunoprecipitates from THP1 cell lysates. Cells were stimulated with cGAMP (100 nM, for 0, 0.5, and 1 h). (n = 2 biologically independent experiments). (b) Immunoblot analysis of the indicated proteins from the ER fraction of THP-1 cells treated with cGAMP for 1 h. (n = 3 biologically independent experiments). (c) HEK-293T cells were transfected with Flag-STING and HA-STEEP (WT/mut5). ER-enriched pellets were immunoblotted for VPS34, FLAG, HA, GM130 (Golgi), and Sec61B (ER). (n = 3 biologically independent experiments). (d) ER- and Golgi-enriched pellets from STING-expressing HEK-293T cells transfected with control (His-VPS34, HA-Beclin1, V5-VPS15 and empty vector), Complex I (His-VPS34, HA-Beclin1, V5-VPS15 and GFP-ATG14) or Complex II (His-VPS34, HA-Beclin1, V5-VPS15 and GFP-UVRAG) were fractionated, and immunoblotted for the indicated proteins (n = 3 biologically independent experiments) (e, f) HEK-293T cells were transfected by control, Complex I, or Complex II (as specified under d above) and FLAG-tagged STING for 24 h. Fixed cells were probed with the indicated antibodies, and analyzed by ImageStream. (n = 3) (ns P = 0.54, *P < 0.05, **P = 0.01). (g) ImageStream analysis of PI3P-ER colocalization. HEK-293T cells were transfected with control, Complex I or Complex II (as specified for panel d above), GFP-FYVE and FLAG-tagged STING for 24 h. Fixed cells were probed with the indicted antibodies. (n= 3) (**P < 0.0001, **P = 0.0022, **P = 0.00030, left to right). (h) STING-expressing HEK-293T cells were transfected with GFP-tagged ALPS (GFP133), control, Complex I, or Complex II (as specified in panel d). ER-enriched pellets were immunoblotted for GFP, HA, His, GM130 (Golgi), and Sec61B (ER). (n = 3 biologically independent experiments). (i) HEK-293T cells were transfected with control, Complex I or Complex II, GFP133 and FLAG-tagged STING for 24h. Fixed cells were probed with the indicted antibodies and analyzed by ImageStream. (n = 3) (**P = 0.0053, ns P = 0.94, **P = 0.0074, left to right). For data from ImageStream analysis (panels e, f, g, and i), each data point represents the percent of the positive cells from one representative sample and are shown as means +/- st.dev. Statistical analysis of data in panels e, f, g, and i was performed by two-tailed one-way ANOVA test.
Figure 7
Figure 7. STEEP facilitates STING-dependent antiviral defense and pathological signaling.
(a, b) Primary human fibroblasts and monocyte-derived macrophages treated with Cas9 and gRNAs as indicated were stimulated with vehicle or cGAMP (100 nM, 2h). Total RNA was harvested and IFNB levels measured. (n = 3) (a, *P = 0.049, ns P = 0.59, *P = 0.039, left to right; b, *P = 0.021, *P = 0.014, left to right). (c, d) Brain slices from Cas9+ mice treated with Steep-specific sgRNAs were infected with 5 x 10³ PFU HSV1 (c) Viral load in the culture supernatants were determined by plaque assay. Data represent mean +/- st.dev, from n = 8 mice. Statistical analysis: two-tailed Mann-Whitney test (ns P = 0.33, *P = 0.00016, left to right). (d) Immunoblot analysis of ISGs response by indicative proteins in HSV1-infected WT or STEEP KO mouse brain splice (n = 2 mice). Dpi, days post infection. (e-g) Fibroblasts from SAVI patients were treated with Cas9 and the indicated sgRNAs. Whole-cell lysates and total RNA were isolated, and analyzed by immunoblot or RT-qPCR, respectively. e, data are from 3 SAVI patients, and panels f and g data are shown as means +/- st.dev, for n = 3 independent replicates. (ns P = 0.56, *P < 0.05, **P < 0.01). (h) PBMC lysates from healthy controls and five SLE patients were subjected to immunoblotting with antibodies against pSTING (S366), total STING, Vinculin. Data are from n = 2 unrelated healthy donors (Ctrl1, and 2), and n = 5 unrelated SLE patients. (i) Monocytes from two healthy donors and five IFN-high SLE patients were treated with gRNA/Cas9 complexes targeting STING and STEEP. Total RNA was isolated 48 h later and analyzed for ISG15 mRNA levels (n = 3) (ns P > 0.05, *P < 0.05, **P < 0.01). (j) Box plots of TCGA RNA expression profiles in Prostate adenocarcinoma (PRAD). The highest and lowest 25% of expression of STEEP (upper panels) and STING (lower panels) were analyzed by comparing STEEP/STING-high and STEEP/STING-low groups. Statistical analysis: two-tailed Mann-Whitney test. The upper and lower ends of the boxes represent the upper and lower quartiles, and the horizontal line inside the box is median of the dataset. The bar extending parallel from the boxes is the “whiskers”, indicating upper and lower extreme of the dataset (ns P > 0.01, **P < 0.001). (k) Lysates from HEK-293T cells transfected with the indicated STING expression constructs were immunoprecipitated with anti-Flag, and immunoblotted with antibodies directed against HA and FLAG. (n = 3 biologically independent experiments). (l, m) ImageStream analysis of PI3P-ER (l) and ER-GFP133 colocalization (m). HEK-293T cells were transfected with GFP-FYVE/GFP133 and STING/STING-SAVI mutants for 24 h. Fixed cells were incubated with rabbit anti-calreticulin (n = 3 biologically independent experiments) (l, **P = 0.0017, ** P = 0.0053, left to right; m, **P = 3.20E-06, *P = 0.035, left to right).. Data in panels a, b, f, g and i are shown as means of biological technical triplicates +/- st.dev from one representative experiment. For data from ImageStream analysis (panels l and m), each data point represents the percent of the positive cells from one representative sample and are shown as means +/- st.dev. Statistical analysis of data presented in panels a, b, f, and g was used through two-tailed unpaired t-test with welch’s correction, and in panels i, l, and m was performed using two-tailed Student’s t-test.

References

    1. Paludan SR. Activation and Regulation of DNA-Driven Immune Responses. Microbiol Mol Biol Rev. 2015;79:225–241. - PMC - PubMed
    1. Sun L, Wu J, Du F, Chen X, Chen ZJ. Cyclic GMP-AMP Synthase Is a Cytosolic DNA Sensor That Activates the Type I Interferon Pathway. Science. 2013;339:786–791. - PMC - PubMed
    1. Wu J, et al. Cyclic GMP-AMP Is an Endogenous Second Messenger in Innate Immune Signaling by Cytosolic DNA. Science. 2013;339:826–830. - PMC - PubMed
    1. Ishikawa H, Barber GN. STING is an endoplasmic reticulum adaptor that facilitates innate immune signalling. Nature. 2008;455:674–678. - PMC - PubMed
    1. Shang G, Zhang C, Chen ZJ, Bai XC, Zhang X. Cryo-EM structures of STING reveal its mechanism of activation by cyclic GMP-AMP. Nature. 2019;567:389–393. - PMC - PubMed

Publication types

MeSH terms