. 2020 Sep;21(9):983-997.
doi: 10.1038/s41590-020-0731-4. Epub 2020 Jul 20.

The activation trajectory of plasmacytoid dendritic cells in vivo during a viral infection

Affiliations

The activation trajectory of plasmacytoid dendritic cells in vivo during a viral infection

Abdenour Abbas et al. Nat Immunol. 2020 Sep.

Abstract

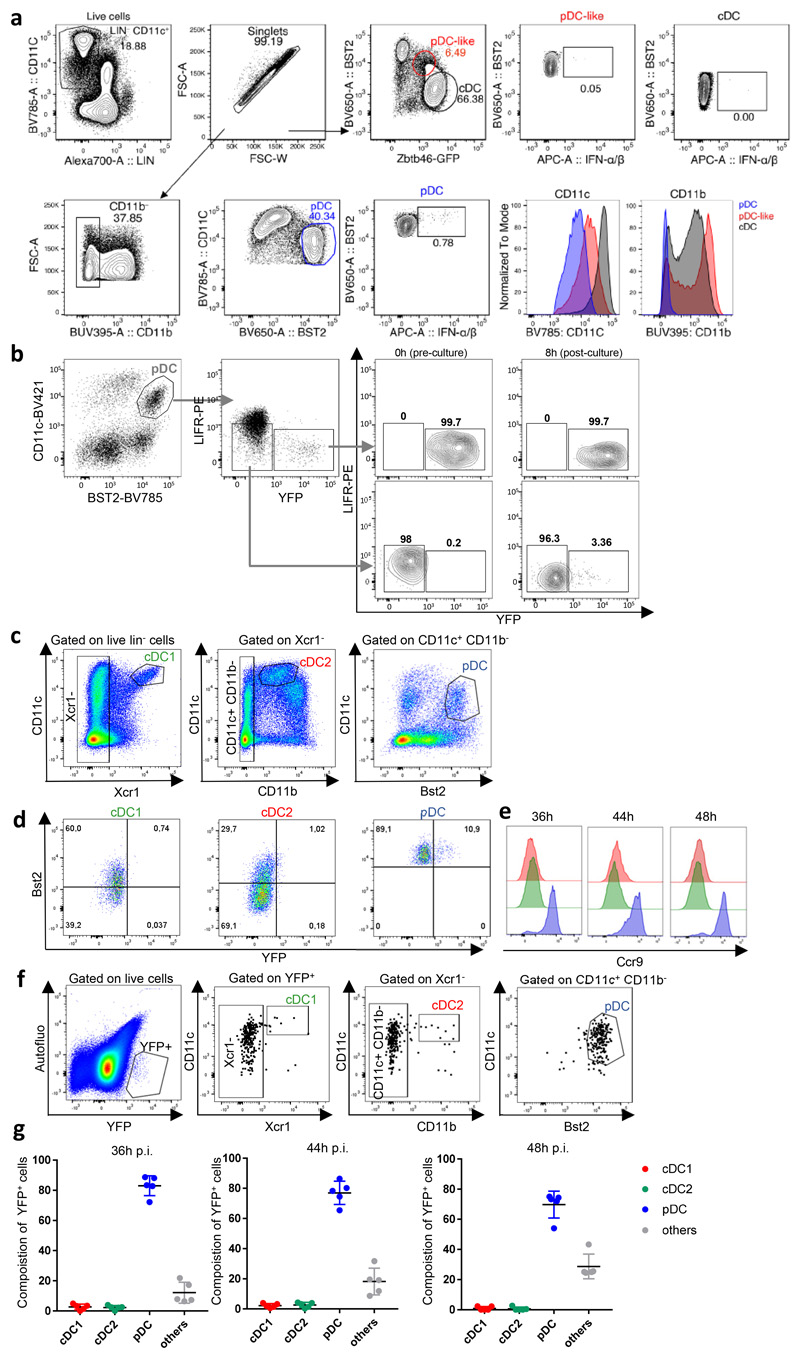
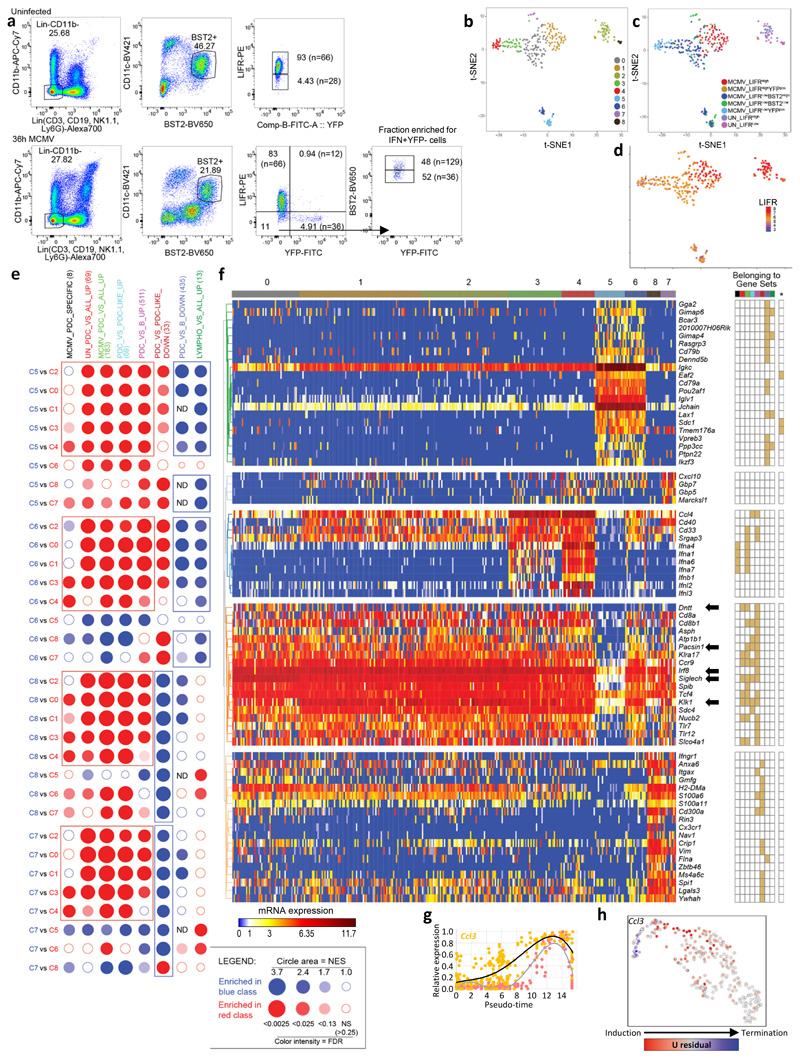
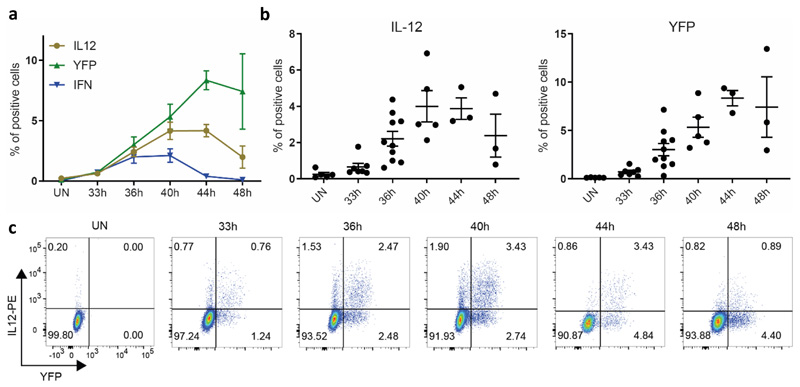
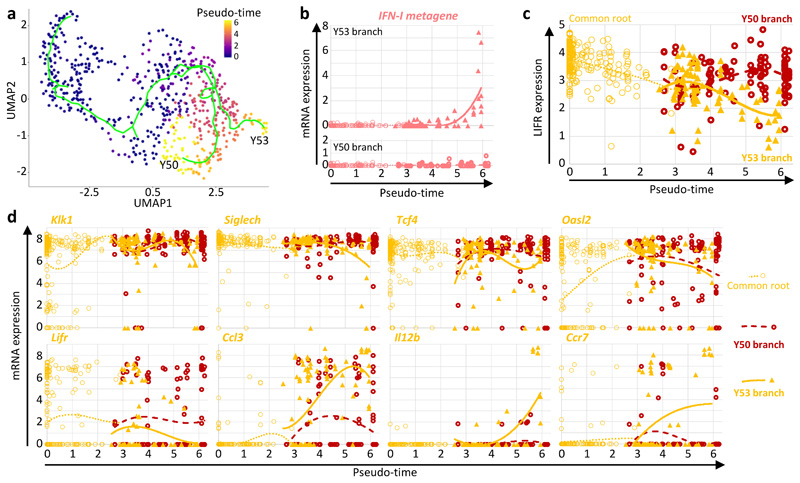
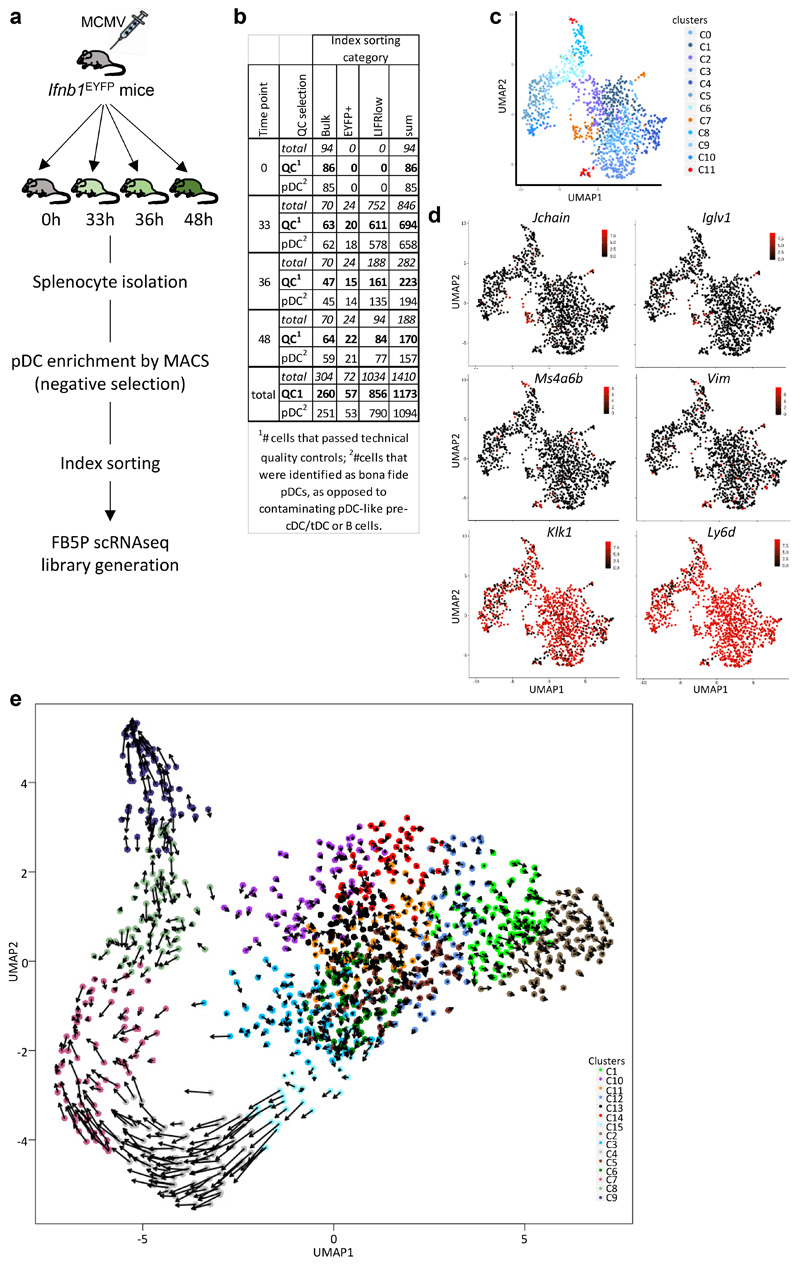
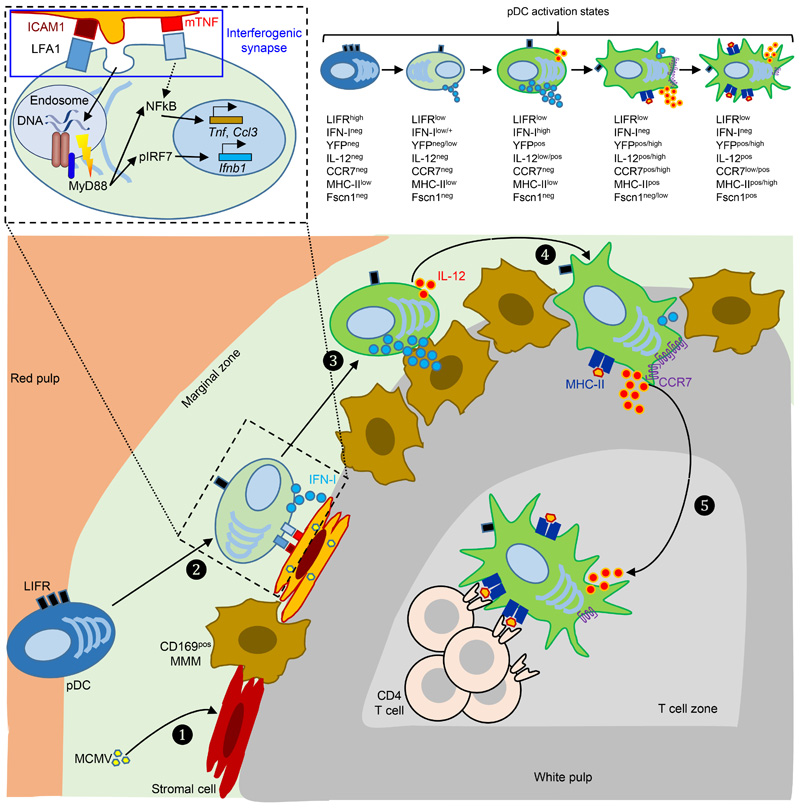
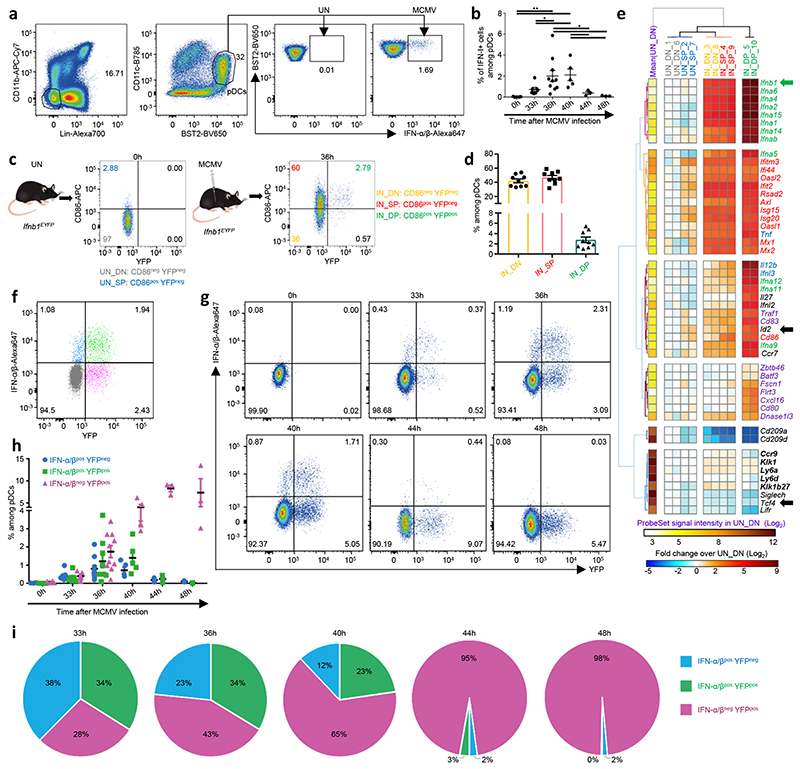
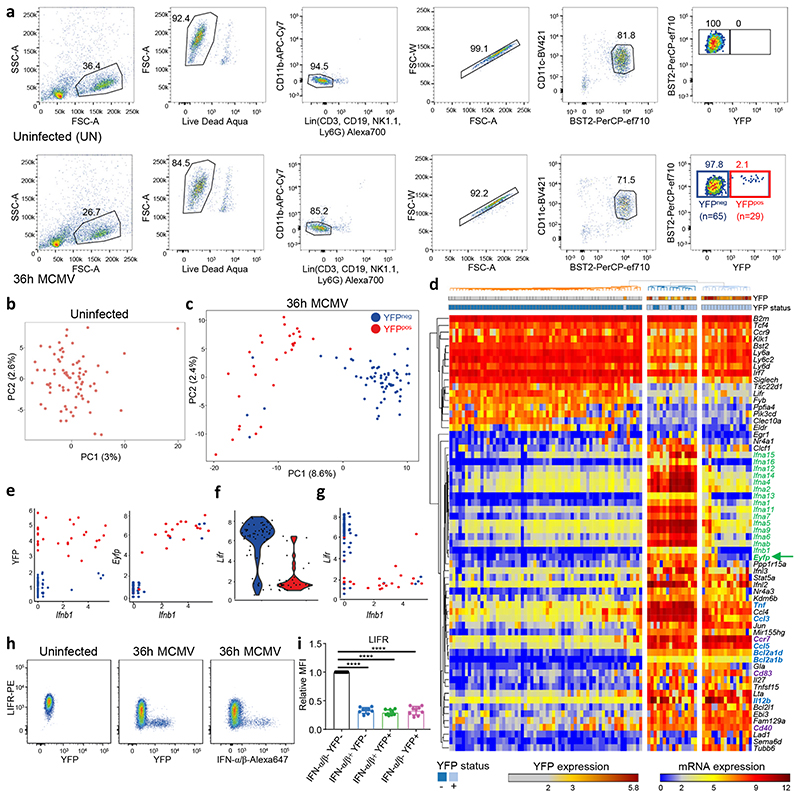
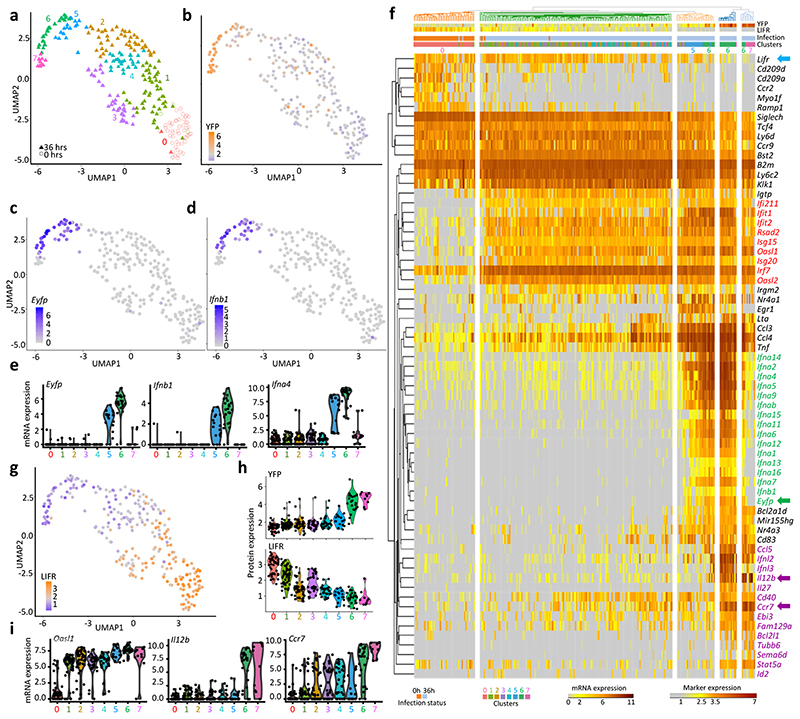
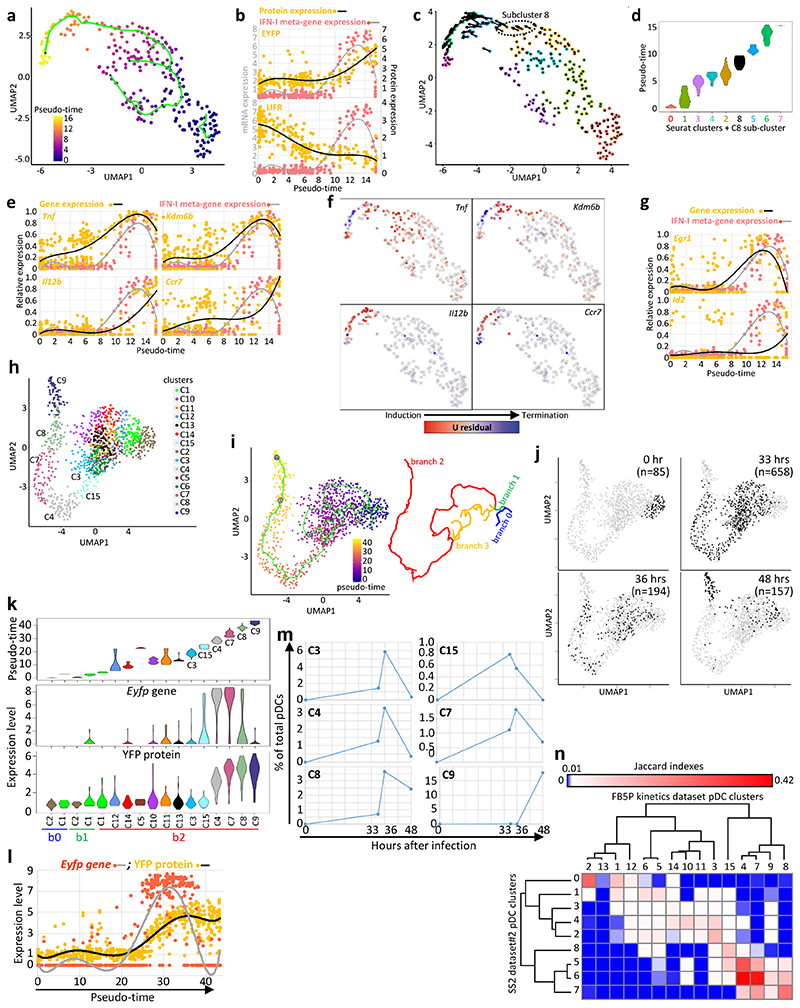
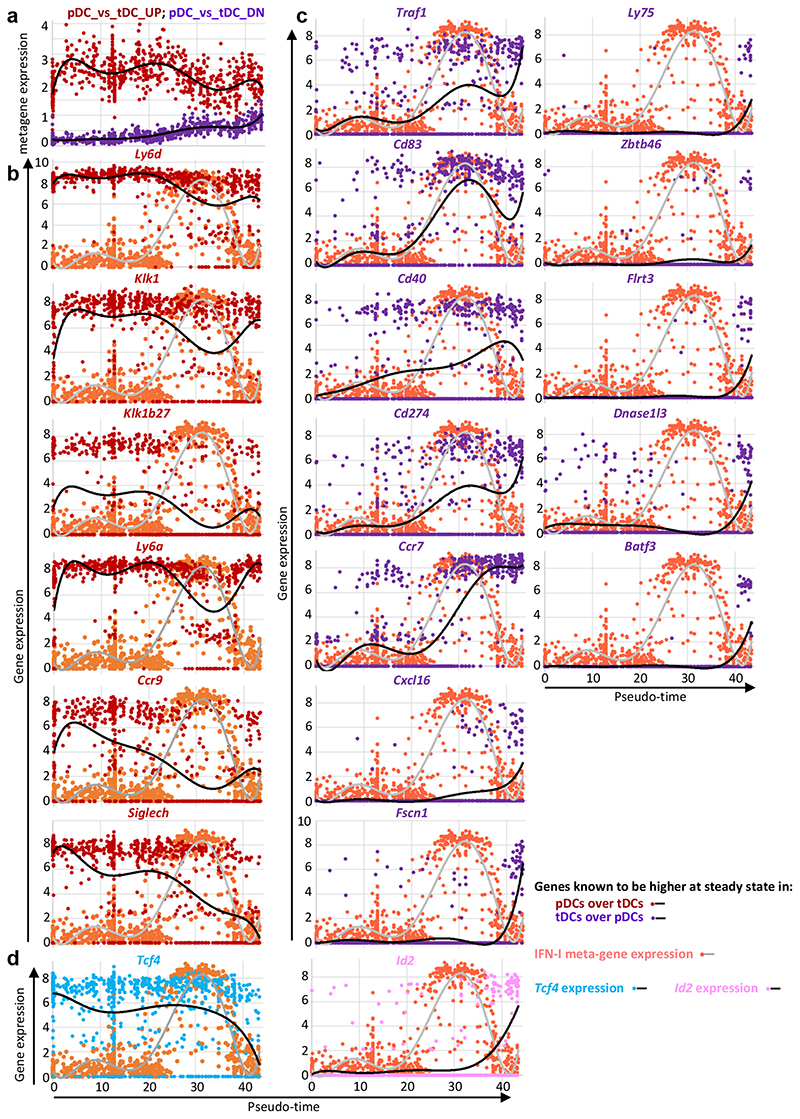
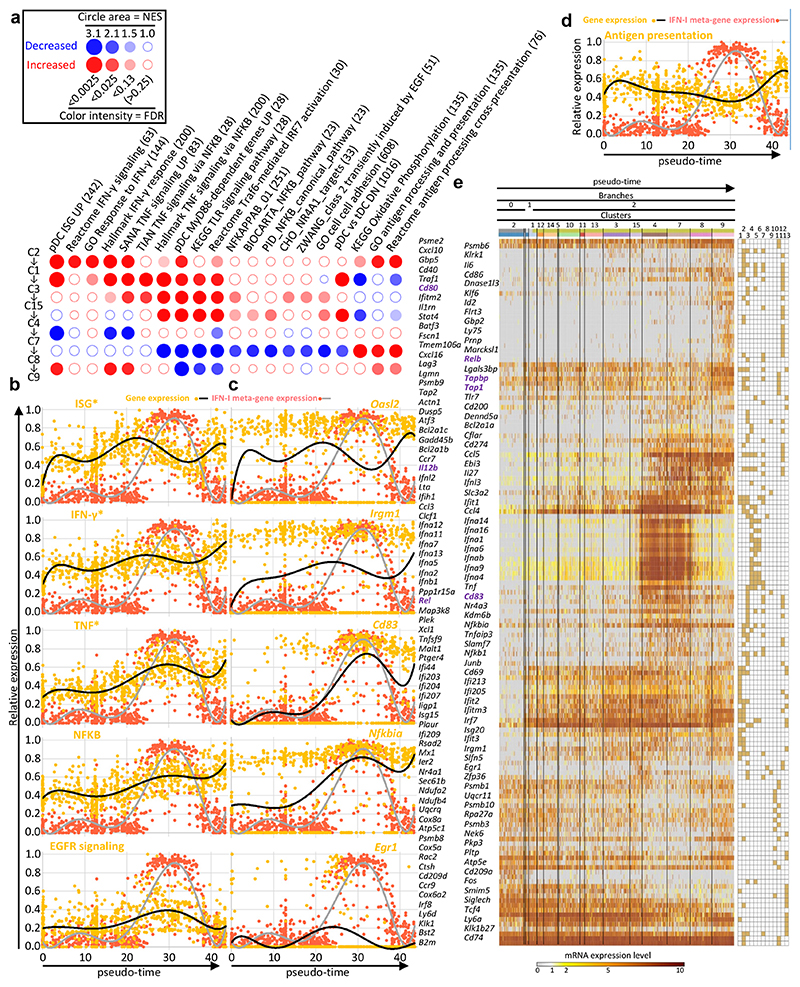
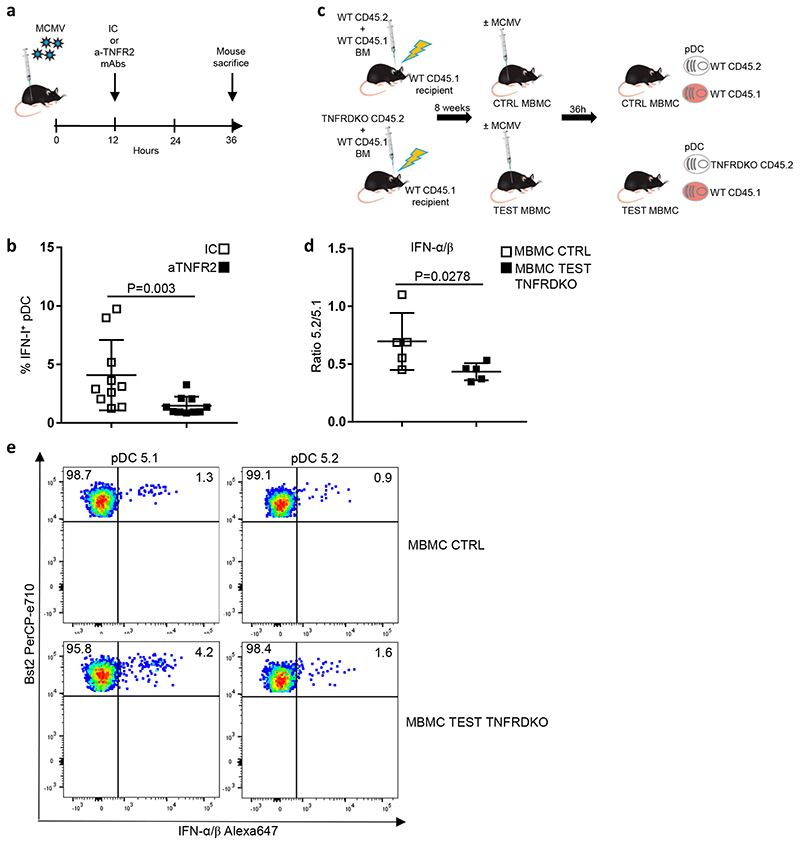
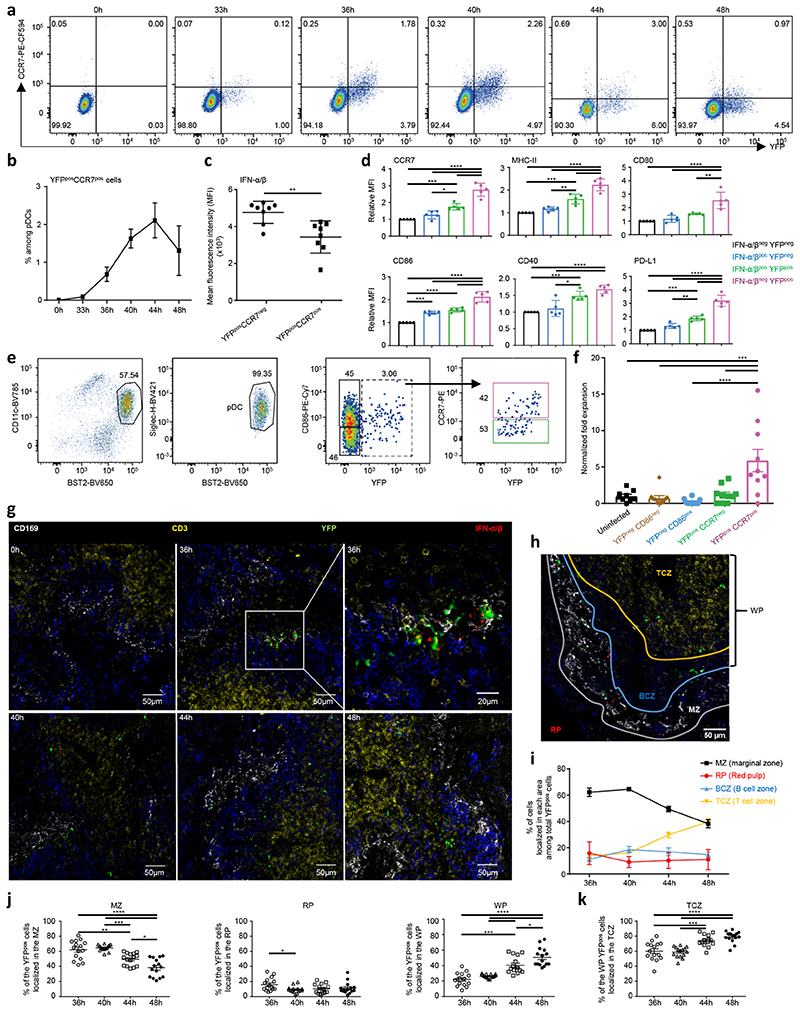
Plasmacytoid dendritic cells (pDCs) are a major source of type I interferon (IFN-I). What other functions pDCs exert in vivo during viral infections is controversial, and more studies are needed to understand their orchestration. In the present study, we characterize in depth and link pDC activation states in animals infected by mouse cytomegalovirus by combining Ifnb1 reporter mice with flow cytometry, single-cell RNA sequencing, confocal microscopy and a cognate CD4 T cell activation assay. We show that IFN-I production and T cell activation were performed by the same pDC, but these occurred sequentially in time and in different micro-anatomical locations. In addition, we show that pDC commitment to IFN-I production was marked early on by their downregulation of leukemia inhibitory factor receptor and was promoted by cell-intrinsic tumor necrosis factor signaling. We propose a new model for how individual pDCs are endowed to exert different functions in vivo during a viral infection, in a manner tightly orchestrated in time and space.


Conflict of interest statement

Competing interests

The authors declare no competing interests.

Figures

Extended Data Fig. 1
Extended Data Fig. 1. Validation of the Ifnb1Eyfp reporter mice to track IFN-I-producing pDCs during MCMV infection.
a, IFN-α/β production by pDCs (blue), pDC-like cells (red) and cDCs (black) at 36h after MCMV infection of Zbtb46GFP reporter mice. Overlaid histograms (bottom right) show CD11c and CD11b expression for the three cell types. The data shown are from one mouse representative of 3 animals from 2 independent experiments. b, YFP expression in pDCs is stable during the biological process examined. Ifnb1 EYFP CD45.2+ mice were infected by MCMV. 36h later, LIFRlo EYFP- or LIFRlo EYFP+ pDCs were sorted by flow cytometry and cultured in vitro for 8h in CD45.1+ feeder FLT3-L bone marrow cultures. YFP expression was monitored by flow cytometry before and after the culture as indicated. The data shown are from one experiment representative of two independent ones. c-g Around 80% of splenic YFP+ cells are bona fide pDCs at all time points examined during MCMV infection. c, cDCs and pDCs were identified following the gating strategy shown. The analysis was performed after selection of live cells and exclusion of Lin+ cells. d, YFP expression was analyzed in indicated splenic DC populations, isolated from 44h MCMV-infected Ifnb1Eyfp mice. e, Ccr9 expression was analyzed in splenic cDC1s (red), cDC2s (green) and pDCs (blue) isolated from 36h (left), 44h (middle) or 48h (right) MCMV-infected Ifnb1Eyfp mice. f, Autofluorescence-YFP+ cells were gated in live splenocytes isolated from 44h MCMV-infected Ifnb1Eyfp mice. The proportions of DCs vs non-DCs (others, grey) in YFP+ cells were analyzed according to the gating strategy shown in (c). g, Summary of the results obtained following the strategy shown in (e) at 36h (left), 44h (middle) and 48h (right) post-infection. For each time point, data (mean ± s.e.m.) are shown for 5 mice from one experiment.
Extended Data Fig. 2
Extended Data Fig. 2. Design and quality control of the SS2 dataset#2.
a, Flow cytometry gating and overall strategy for index sorting of pDCs from one uninfected (UN, top panel) and one 36h MCMV-infected (bottom panel) Ifnb1Eyfp mice, using LIFR and BST2 expression levels to enrich IFN-I Eyfp + pDCs, for scRNAseq. Numbers in parentheses indicate the total number of cells sorted in each gate. b, t-SNE and cell clustering analysis for the 323 cells that passed quality controls. c, Sorting phenotype projection on the t-SNE space. d, LIFR expression projection on the t-SNE space. Data are expressed as inverse hyperbolic arcsine (asinh) of fluorescence intensity. e, BubbleMap illustrating GSEA results for 8 selected gene sets (columns) in pairwise comparisons between the cell clusters (rows) identified in (b). ND, not determined. f, Heatmap (left) showing mRNA expression levels of representative genes (rows) across the cell clusters (columns) identified in (b). Most of the genes shown were selected due to their contribution to the GSEA results from (e), as informed by the grid on the right of the heatmap where filled cells mean belonging of the gene (row) to a gene set (column). The gene set order and color code on the top of the grid is the same as in panel e. The far right column of the grid (*) corresponds to genes selectively expressed to high levels in plasmocytes. g, Normalized expression of Ccl3 vs the IFN-I meta-gene along pseudo-time. h, Projection on the UMAP space of the predicted induction (red) vs termination (blue) of Ccl3 transcription.
Extended Data Fig. 3
Extended Data Fig. 3. Kinetics of IL-12 production by pDCs during MCMV infection.
a, Frequency (mean ± s.e.m.) of YFP+, IFN+ and IL-12+ pDCs isolated from Ifnb1Eyfp mice at indicated time points after MCMV infection. b, Data from individual animals for the frequencies of IL-12+ and YFP+ cells in pDCs isolated from Ifnb1Eyfp mice at indicated time points, with overlay of mean ± s.e.m. c, Flow cytometry dot plots showing IL-12 vs YFP expression in pDCs isolated from one representative Ifnb1Eyfp mouse for each time point. The data from all panels were analyzed from the same experiments, with 5 mice at 0h, 7 at 33h, 10 at 36h, 5 at 40h, 3 at 44h and 3 at 48h, from one experiment for 44h and 48h, or pooled from 2 (resp. 3) independent experiments for 33h and 44h (resp. 36h).
Extended Data Fig. 4
Extended Data Fig. 4. LIFR downregulation enables enrichment from WT C57BL/6 mice of the pDCs engaged in IFN-I.
pDCs were sorted from 36h MCMV-infected WT C57BL/6 mice, with a protocol including an enrichment of LIFRlo cells to increase the capture efficiency for pDCs engaged in IFN-I production. a, Monocle pseudo-temporal analysis showing bifurcation of the inferred pDC activation trajectory in two major branches, Y53 and Y50. b, Expression of the IFN-I meta-gene along pseudo-time for the Y53 (top) and Y50 (bottom) branches of the pDC activation trajectory. c, LIFR expression along pseudo-time on the pDCs from the common root (empty thin orange circles), Y53 branch (filled orange triangles) and Y50 branch (empty thick dark red circles) of the pDC activation trajectory. d, Expression of individual genes along pseudo-time for the cells from the common root (empty thin orange circles), Y53 branch (filled orange triangles) and Y50 branch (empty thick dark red circles) of the pDC activation trajectory. A polynomial curve was fit to the data for each of the three segments of the trajectory.
Extended Data Fig. 5
Extended Data Fig. 5. Design, quality controls and RNA velocity analysis of the FB5P kinetics dataset.
a, Experimental design. For each time point, splenocytes were isolated from one Ifnb1 Eyfp mouse, depleted of Lin+ cells by magnetic sorting and used for index sorting of pDCs using three sorting gates: i) total (bulk) pDCs, ii) LIFRlo pDCs irrespective of their YFP expression, and iii) YFP+ pDCs. FB5P-seq scRNAseq libraries were then prepared. b, Table indicating the total numbers of cells sorted for each time point and sorting gate, the numbers of cells that passed quality control upon data analysis, and the number of bona fide pDC ultimately kept after identification and removal of contaminating cell types. c,d, Identification and removal of contaminating B and pDC-like cells. c, UMAP and clustering analysis. The analysis of the genes differentially expressed across clusters combined with their mining for expression across immune cell types by using the MyGeneSet tool of Immgen enabled identification of contaminating B cells (cluster 7, highlighted in orange). A GSEA analysis performed by using BubbleGUM (not shown) enabled identification of contaminating pDC-like cells (cluster 11, highlighted in red). d, Projection on the UMAP space of the expression of two B cell-specific genes, Jchain and Iglv1, two pDC-like cell-specific genes, Ms4a6b and Vim, and 2 genes selectively expressed at high levels in pDCs, Klk1 and Ly6d. e, Projections of the velocity vector of each pDC in the UMAP space obtained after contaminant removal.
Extended Data Fig. 6
Extended Data Fig. 6. Ex vivo unidirectional transition of pDCs isolated from MCMV-infected mice from a YFP+CCR7- to a YFP+CCR7+ activation state.
Ifnb1 Eyfp CD45.2+ mice were infected by MCMV. 36h later, LIFRlo YFP+ CCR7- pDCs and LIFRlo YFP+ CCR7+ pDCs were sorted and cultured in vitro for 8h in CD45.1+ feeder FLT3-L bone marrow cultures. CCR7 expression was monitored by flow cytometry before and after the culture, as depicted in the right panel. The data shown are from one experiment representative of two independent ones.
Extended Data Fig. 7
Extended Data Fig. 7. Micro-anatomical locations of splenic YFP+ cells during MCMV infection of Ifnb1Eyfp mice.
(a, b, c) Number of IFN-α/β spots per mm2 (a), of YFP+IFN-α/β+ cells/mm2 (b), and of YFP+ cells per mm2 (c), in whole spleen sections from Ifnb1Eyfp mice at indicated time points after MCMV infection. (d) Number of YFP+ cells per mm2 residing in the different spleen zones. MZ, marginal zone; RP, red pulp; WP, white pulp. Fifteen individual data points are shown on each graph for each time point, corresponding to quantitation of 5 different whole spleen sections per mouse, from 3 different mice, with overlay of mean±s.e.m.
Extended Data Fig. 8
Extended Data Fig. 8. Proposed model of the spatiotemporal dynamics of splenic pDC activation and functions during MCMV infection.
MCMV initially targets and replicates in stromal cells and/or metallophilic macrophages in the marginal zone (❶). These infected cells may then upregulate their expression of ICAM-1 and express mTNF, leading to their specific recognition by, and interactions with, quiescent pDCs. This interaction is proposed to downregulate LIFR expression on pDCs, to induce low levels of Tnf and Ccl3 in pDCs. It may also lead to the generation of an interferogenic synapse (❷) promoting local targeted delivery of viral material from the infected cell to pDCs, as illustrated on the upper left detailed drawing enlarged from the corresponding delimited area in the main drawing. This viral material is engulfed in pDCs and routed into dedicated endosomes, allowing TLR9 triggering, with the downstream enforcement of Tnf and Ccl3 expression and the induction of IFN-I genes. At this early activation state, pDCs from Ifnb1Eyfp reporter mice already start to express IFN-I but not yet clearly detectable levels of YFP. Then, pDCs further enhance their expression of IFN-I, leading to their expression of high levels of YFP in Ifnb1Eyfp reporter mice, and they simultaneously start to express IL-12 (❸). After termination of their IFN-I production, pDCs further enhance their IL-12 production, acquire CCR7 expression and migrate from the marginal zone to the white pulp through bridging channels (❹). Ultimately, pDCs relocate to the T cell zone where they harbor clear features of mature DCs, with a transcriptional, morphologic and functional convergence with tDCs, presumably including the acquisition of a dendritic morphology upon expression of Fscn1 and other genes involved into cytoskeleton remodeling, and acquisition of the ability to prime naïve CD4+ T cells (❺). CD169+ MMM, marginal zone metallophilic macrophages; mTNF, plasma membrane-bound TNF; pIRF7, phosphorylated IRF7.
Fig. 1
Fig. 1. Bulk transcriptional profiling suggests the induction of distinct pDC activation states in vivo during MCMV infection.
a, pDC gating strategy within live single-cells. b, Percentages of IFN-I+ cells within pDCs at indicated time points afterMCMV infection. *p<0.05, **p<0.01 (One-way ANOVA). c, YFP and CD86 co-expression in pDCs isolated from uninfected (UN) or 36h MCMV-infected (IN) Ifnb1EYFP mice. d, Percentages of subpopulations within splenic pDCs of 36h MCMV-infected Ifnb1EYFP mice. The data are shown for n=9 individual mice pooled from 3 independent experiments. e, Heatmap showing mRNA expression levels of selected genes (rows) across pDC subpopulations (columns), with hierarchical clustering using City block distance for cells and Euclidian distance for genes. f, Co-expression of IFN-α/β and YFP in pDCs isolated from one representative 36h MCMV-infected Ifnb1Eyfp mouse. g, Co-expression of IFN-α/β and YFP in pDCs isolated from Ifnb1Eyfp mice, at 0h (UN), 33h, 36h, 40h, 44h and 48h after MCMV infection. For each time point, one representative mouse is shown. h, Proportions of IFN-α/β+YFP, IFN-α/β+YFP+ and IFN-α/βYFP+ cells amongst pDCs, at indicated time points. i, Pie charts recapitulating the mean proportions of cells expressing IFN-I and/or YFP (see color key) amongst pDC positive for either molecule at different time points during the course of MCMV infection in Ifnb1Eyfp mice. For panels b, d and h, data are presented as mean±s.e.m, and for panel i as mean percentage. Panels b and f-i show data from individual mice, with n=5 at 0h, 7 at 33h, 10 at 36h, 5 at 40h, and 3 at 44h and 48h, pooled from 2 (resp. 3) independent experiments for 33h and 40h (resp. 0h and 36h). One experiment was performed for 44h and 48h.
Fig. 2
Fig. 2. scRNAseq analysis of pDCs from 36h MCMV-infected mice confirms their heterogeneity and pinpoints to LIFR downregulation as a selective marker of IFN-I-producing pDCs.
a, Flow cytometry gating strategy for index sorting of pDC from one uninfected mouse (top) and from one 36h MCMV-infected mouse (bottom). Numbers in parentheses correspond to the number of cells sorted for each population. b-c, Principal component analysis (PCA) on 1,016 highly variable genes of single pDCs isolated from uninfected, b, or from one MCMV-infected mice (SS2 dataset#1), c, encompassing 29 YFP+ cells (red) and 65 YFP cells (blue). d, Heatmap showing mRNA expression of selected genes, and YFP protein fluorescence intensity obtained from index sorting data, with hierarchical clustering using one minus Pearson correlation as distance metric for both cells and genes. e, Scatter plots showing Ifnb1 expression vs YFP protein fluorescence intensity (left), or Ifnb1 vs Eyfp mRNA expression (right). f, Violin plot showing Lifr expression in YFP vs YFP+ pDCs. g, Scatter plot showing Ifnb1 vs Lifr mRNA expression. h, Flow cytometry analysis showing the downregulation of LIFR protein expression on IFN-α/β+ (middle) or YFP+ (right) pDC isolated from 36h MCMV-infected Ifnb1EYFP mice, as compared to pDC isolated from uninfected animals (left). The dot plots shown are from one mouse representative of 10 animals. i, Relative median fluorescence intensity (MFI) of LIFR on IFN-α/βYFP (black), IFN-α/β+YFP (blue), IFN-α/β+YFP+ (green) and IFN-α/βYFP+ (pink) populations. The data are shown for n=10 individual animals pooled from 2 independent experiments, with overlay of mean±s.e.m. values. ****p<0.0001 (One-way ANOVA with Tukey’s post hoc test).
Fig. 3
Fig. 3. scRNAseq analysis identifies 8 different pDC activation states in vivo during MCMV infection.
a, Dimensional reduction performed using the UMAP algorithm, and graph-based cell clustering, for 264 bona fide pDCs isolated from one control and one 36h MCMV-infected mice (SS2 dataset#2). b, Inverse hyperbolic arcsine (asinh) fluorescence intensity of YFP projected on the UMAP space. c-d, Expression of Yfp and Ifnb1 on the UMAP space. e, Violin plots showing mRNA expression profiles of selected genes across all individual cells and in comparison between the clusters identified in (a), cluster 0= UN pDCs, clusters 1-4= MCMV Eyfp YFP pDCs, cluster 5= MCMV Eyfp+YFP pDCs, cluster 6= MCMV Eyfp+YFP+ pDCs, cluster 7= MCMV EyfpYFP+ pDCs. f, Heatmap showing mRNA expression levels of selected genes (rows) across individual pDCs (columns), with hierarchical clustering using one minus Spearman rank correlation for cells and Kendall’s tau distance for genes. The top differentially expressed genes between Seurat clusters are shown, as well as representative ISG and pDC-specific genes. B2m was included as an invariant control housekeeping gene. YFP and LIFR protein fluorescence intensities, obtained from index sorting data, are also shown on the top of the heatmap, as well as the infection status of the mice from which the pDCs were isolated, and the belonging of individual pDCs to the Seurat cell clusters. g, LIFR expression intensity projected on the UMAP space. h, Violin plots showing asinh fluorescence intensity of EYFP and LIFR across Seurat clusters. i, Violin plots showing mRNA expression profiles of selected genes across Seurat clusters.
Fig. 4
Fig. 4. Inference of the pDC activation trajectory during MCMV infection.
a, Monocle pseudo-temporal inference of the pDC activation trajectory for the SS2 dataset#2. b, Expression of the YFP or LIFR proteins vs the IFN-I meta-gene along pseudo-time. Dots correspond to individual cells and a 6-order polynomial curve was fit to the data. c, RNA Velocity reconstruction of the pDC activation trajectory. Projections of the velocity vector of each pDC are represented as arrows in the UMAP space. The black dotted ellipse corresponds to the new subcluster 8. d, Violin plots showing pseudo-time distribution across Seurat clusters, including subcluster 8. e, Expression along pseudo-time of the indicated genes vs the IFN-I meta-gene, each normalized to their maximal value. f, Predicted induction (red) vs termination (blue) of the transcription of selected genes as obtained using Velocyto. g, Normalized expression along pseudo-time of Egr1 (top) and Id2 (bottom) vs the IFN-I meta-gene. h, UMAP and clustering analysis of the FB5P kinetics dataset after removal of contaminants. i, Pseudo-temporal inference of the pDC activation trajectory obtained using Monocle. j, Distribution in the UMAP space of the cells isolated at different time points after infection. The cell numbers analyzed for each time point (black dots) are indicated in parentheses. k, Violin plots showing the values for pseudo-time (top), Eyfp (middle) and YFP (bottom) expression, across cell clusters. l, Eyfp and YFP expression across pseudo-time. Individual cells are shown as dots and a polynomial curve was fit to the data. m, Calculus of the frequency over real-time of pDCs being in the different activation states (cell clusters) associated to IFN-I production. n, Heatmap showing the equivalences between the pDC clusters from the SS2 dataset#2 and the FB5P kinetics dataset based on the calculation of Jaccard Indexes reflecting their marker gene content overlap. One minus Pearson correlation was used as distance metric for hierarchical clustering.
Fig. 5
Fig. 5. Transcriptional convergence of pDCs towards tDCs over pseudo-time.
a, Meta-gene expression levels (y-axis) along pseudo-time (x-axis), in the FB5P kinetic dataset, for genes higher in steady state pDCs over tDCs (pDC_versus_tDC_UP gene set, dark red dots and upper black curve) and for the genes lower in steady state pDCs as compared to tDCs (pDC_versus_tDC_DN gene set, violet dots and lower black curve). Individual cells are shown as dots and a polynomial curve was fit to the data. The gene sets were generated by reanalyzing public data (GEO Series GSE76132, see Supplementary Data 2). b, Expression level along pseudo-time of representative individual genes of the pDC_versus_tDC_UP gene set. c, Expression level along pseudo-time of representative individual genes of the pDC_versus_tDC_DN gene set. d, Expression level along pseudo-time of the pDC master transcription factor Tcf4 (blue dots and black curve) and of its counter-regulated cDC1 master transcription factor Id2 (pink dots and black curve). The expression of the IFN-I meta-gene is shown on each graph for comparison (pale red dots and gray curve).
Fig. 6
Fig. 6. Identification of annotated gene modules regulated along pseudo-time during pDC activation.
a, BubbleMap showing the gene sets with the most relevant and significant enrichment patterns along the pseudo-time of pDC activation trajectory. Dark red bubbles represent significant increased expression of the gene set (columns) across two consecutive pDC clusters along pseudo-time (rows). Dark blue bubbles represent significant decreased expression. Empty bubbles correspond to lack of significant differences in gene set expression between the pDC clusters compared. Hence, the expression pattern of each gene set along pseudo-time is visualized as a vertical succession of red or blue bubbles. b,c Normalized expression level (y-axis) along pseudo-time (x-axis) of the meta-genes corresponding to the selected gene sets (left) and of one of their representative genes (right) (pale orange dots and black curves). The expression of the IFN-I meta-gene is shown on each graph for comparison (pale red dots and gray curve). d, Normalized expression level (y-axis) along pseudo-time (x-axis) of the metagene corresponding to the antigen presentation gene set, vs the IFN-I meta-gene. e, Heatmap showing the expression patterns along pseudo-time of individual genes selected from the analysis illustrated on panel (a), with hierarchical clustering of the genes using one minus Pearson correlation as distance metric. Belonging of the genes to the gene sets illustrated in a-c is shown in the grid on the right of the heatmap, with gene set 1, ISG; 2, IFN-γ responsive genes; 3, TNF signaling pathway and responsive genes; 4, pDC Myd88-dependent genes UP; 5, KEGG TLR signaling pathway; 6, Reactome Traf6-mediated IRF7 activation; 7, NFKB signaling pathways and responsive genes; 8, Zwang class 2 transiently induced by EGF; 9, CHO NR4A1 targets; 10, KEGG Oxidative phosphorylation; 11, GO antigen processing and presentation; 12, pDC_versus_tDC_DN; 13, pDC_versus_tDC_UP.
Fig. 7
Fig. 7. Cell-intrinsic TNF signaling promotes pDC IFN-I production.
a, Experimental protocol followed to evaluate the role of TNF signaling in pDC activation during MCMV infection. b, Percentages of IFN+ cells in splenic pDCs isolated from isotype control (IC)-treated animals vs anti-TNFR2-treated mice. The data are shown for 10 individual animals pooled from 2 independent experiments, with overlay of mean±s.e.m. values. c, Generation of mixed bone marrow chimera (MBMC) mice; CTR, control. Recipient C57BL/6 CD45.1 (5.1) mice were lethally irradiated and then reconstituted with equal proportions of bone marrow (BM) cells isolated from WT 5.1 mice and from indicated CD45.2 (5.2) mice, either WT for CTR MBMC mice or TNFR1/2-KO (TNFRDKO) for TEST MBMC animals. Reconstituted MBMC mice were infected by MCMV and their splenic pDCs examined ex vivo for IFN-I production. d, Measuring the cell-intrinsic role of TNF signaling in promoting pDC IFN-I production. Results are expressed as 5.2/5.1 ratio of the percentages of IFN-I-producing pDCs obtained from MCMV-infected CTR WT versus TEST TNFRDKO MBMC mice. The data are shown for 5 individual animals for each type of MBMC mice, pooled from 2 independent experiments, with overlay of mean±s.e.m. values. For b and d, the statistical analysis was performed using one-sided Mann-Whitney U test. e, Dot plots show representative data of intracellular IFN-I staining in 5.2+ versus 5.1+ pDCs isolated from the indicated MCMV-infected MBMC mice.
Fig. 8
Fig. 8. Characterization of the phenotype, function and micro-anatomical location of pDC activation states.
a, YFP vs CCR7 expression in splenic pDCs during MCMV infection. Data from one representative Ifnb1Eyfp mouse is shown for each time points. b, Frequency of YFP+CCR7+ cells within splenic pDCs during MCMV infection. The data represent individual mice with n = 5 at 0h, 7 at 33h, 10 at 36h, 5 at 40h, and 3 at 44h and 48h, from one experiment for 44h and 48h, and pooled from 2 (resp. 3) independent experiments for 33h and 40h (resp. 0h and 36h). c, Mean fluorescence intensity of IFN-α/β on YFP+CCR7+ vs YFP+CCR7 pDCs isolated from 36h MCMV-infected mice. d, Relative median fluorescence intensity (MFI) of indicated markers on pDC subpopulations isolated from 36h MCMV-infected Ifnb1Eyfp mice. The data in c and d are from n = 10 (resp. 5) mice from two independent experiments (c) or one experiment representative of two (d). e, Flow cytometry sorting strategy for splenic pDC subpopulations from uninfected (UN) or 38h MCMV-infected Ifnb1Eyfp mice, starting from live single CD11bneg Linneg cells. f, Expansion of naïve CD4 OT-II cells upon co-culture with the indicated OVA peptide-pulsed pDC subpopulations. The graph shows individual data points pooled from 3 independent experiments, each with 2-4 replicate co-cultures for each pDC subpopulation. g, Immunohistological analysis of spleen sections from uninfected (UN) or MCMV-infected Ifnb1Eyfp mice harvested at the indicated time points. Top right image, 5x zoom of the region delimited in the previous image. h, Definition of spleen zones for cell quantification (see online methods). i, Distribution of YFP+ cells across the different spleen zones during the course of MCMV infection. j, Detail of the individual data collected and used for generating the graph of panel I. k, A similar analysis was performed as in panel (j) for the percentages of WP YFP+ pDCs residing in the TCZ. For g-k, data were analyzed from 3 different mice, with 5 different whole splenic sections per mouse (i.e. 15 images per time point). In b-d,f,i-k, data are shown as mean±s.e.m. and P values are from One-way ANOVA with Tukey’s post hoc test, with *p<0.05, **p<0.01, ***p<0.001, ***p<0.0001.

References

    1. Tomasello E, Pollet E, Vu Manh TP, Uze G, Dalod M. Harnessing Mechanistic Knowledge on Beneficial Versus Deleterious IFN-I Effects to Design Innovative Immunotherapies Targeting Cytokine Activity to Specific Cell Types. Front Immunol. 2014;5:526. - PMC - PubMed
    1. Asselin-Paturel C, et al. Mouse type I IFN-producing cells are immature APCs with plasmacytoid morphology. Nature immunology. 2001;2:1144–1150. - PubMed
    1. Dalod M, et al. Interferon alpha/beta and interleukin 12 responses to viral infections: pathways regulating dendritic cell cytokine expression in vivo. J Exp Med. 2002;195:517–528. - PMC - PubMed
    1. Kadowaki N, Antonenko S, Lau JY, Liu YJ. Natural interferon alpha/beta-producing cells link innate and adaptive immunity. J Exp Med. 2000;192:219–226. - PMC - PubMed
    1. Grouard G, et al. The enigmatic plasmacytoid T cells develop into dendritic cells with interleukin (IL)-3 and CD40-ligand. J Exp Med. 1997;185:1101–1111. - PMC - PubMed

Publication types

Substances