. 2020 Aug;15(8):2413-2442.
doi: 10.1038/s41596-020-0335-3. Epub 2020 Jul 20.

Organotypic culture assays for murine and human primary and metastatic-site tumors

Affiliations

Organotypic culture assays for murine and human primary and metastatic-site tumors

Veena Padmanaban et al. Nat Protoc. 2020 Aug.

Abstract

Cancer invasion and metastasis are challenging to study in vivo since they occur deep inside the body over extended time periods. Organotypic 3D culture of fresh tumor tissue enables convenient real-time imaging, genetic and microenvironmental manipulation and molecular analysis. Here, we provide detailed protocols to isolate and culture heterogenous organoids from murine and human primary and metastatic site tumors. The time required to isolate organoids can vary based on the tissue and organ type but typically takes <7 h. We describe a suite of assays that model specific aspects of metastasis, including proliferation, survival, invasion, dissemination and colony formation. We also specify comprehensive protocols for downstream applications of organotypic cultures that will allow users to (i) test the role of specific genes in regulating various cellular processes, (ii) distinguish the contributions of several microenvironmental factors and (iii) test the effects of novel therapeutics.


Figures

Extended Data Figure 1:
Extended Data Figure 1:. Variables that affect organoid yield from mammary human tumor organoids
(a) Organoid yield increased as the protocol was optimized during the course of the study. (b) Variations in organoid yield based on modifications to the protocol.
Figure 1:
Figure 1:. Workflow diagram
A brief summary of the various assays described in this protocol including the isolation and culture of organoids, and downstream biochemical assays using 3D embedded organoids. An approximate timeline is also provided for each step of the protocol.
Figure 2:
Figure 2:. Isolation of organoids from primary murine and human mammary tumors
(a) Workflow for isolating tumor organoids from mouse models of metastatic breast cancer. Isolated organoids are embedded in 3D matrices such as Matrigel or collagen I and cultured in the presence of FGF2 as a growth factor. (b) Representative primary tumor freshly isolated from a 10–12 week-old MMTV-PyMT mouse, and after being minced (b’). Scale bar, 1 cm. (c-d) After digestion with trypsin and collagenase, organoids are in suspension with stromal cells (c). Stromal cells are depleted, and epithelial organoids are enriched by performing short (3–4 seconds) differential spins (d). Scale bar, 100 μm. (e) A representative murine tumor organoid. Non-epithelial fragments such as muscle can be observed in the final organoid suspension. Scale bar, 20 μm. (f) Dotplot depicting the number of tumor organoids isolated from a gram of MMTV-PyMT or C3(1)-Tag tumors. Bar – median. (g) Workflow for isolating primary tumor organoids from surgical samples from patients with invasive breast cancer. Isolated organoids are embedded in 3D matrices such as Matrigel or collagen I and cultured in the presence of EGF as a growth factor. (h) Representative surgical specimen received. Yellow arrow marks an adipose-rich region. Scale bar, 1 cm. (i) Representative micrograph of an organoid suspension isolated from a primary human tumor. Scale bar, 100 μm. A zoomed-in organoid in suspension is represented in the black box. Scale bar, 20 μm. (j) Undigested stroma (S) can be observed in the final organoid suspension. A Masson Trichome stain shows tumor cells (T) entrapped within stromal regions. Scale bar, 50 μm. (k) Dotplot depicting the number of tumor organoids isolated from a gram of primary human breast tumors. Bar – median.
Figure 3:
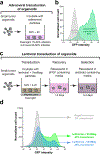
Figure 3:. Viral transduction of organoids
(a) Workflow for transducing organoids with adenoviral particles. Organoids are transduced in suspension overnight. (b) Representative flow cytometry histograms demonstrating the efficiency of adenoviral transduction (adeno-GFP) in murine tumor organoids (>80%). (c) Workflow for transducing organoids with lentiviral particles. Organoids are transduced in suspension in the presence of magnetic nanoparticles overnight, allowed to recover for another 24 hours in the presence of growth factor containing organoid media. Successfully transduced organoids are selected using an antibiotic for 3–4 days. Representative flow cytometry histograms demonstrating the efficiency of lentiviral transduction in murine tumor organoids. Successfully transduced cells express EGFP. Transduction efficiency at MOI = 10 was found to be ~46% and ~23% in the presence and absence of magnetic nanoparticles respectively.
Figure 4:
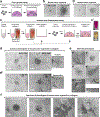
Figure 4:. 3D assays for growth, invasion, and dissemination of tumor organoids
(a) Growth of tumor organoids can be measured by embedding in 3D Matrigel and culturing for 4–6 days in the presence of a growth factor. (b) Organoids from a MMTV-PyMT tumor (b) or primary human tumor (b’) embedded in Matrigel are small and have a rounded morphology (left, Day 0). Over 4–6 days, they grow in size and form large “branched” structures (right, Day 5). Scale bar, 100 μm. (c) Workflow of an invasion and dissemination assay. Collagen I is prepared by neutralizing rat tail collagen I and allowing collagen to polymerize at 4°C until it turns translucent. Neutralized collagen I is used to make underlays in glass-bottomed plates. Freshly isolated tumor organoids are resuspended in polymerized collagen I and plated at 37° C. (d) MMTV-PyMT tumor organoids invade collectively into surrounding collagen I (d) while C3(1)-Tag tumor organoids both invade and disseminate (d’). Scale bar, 100μm. Zoom-ins of invasion and disseminated units are in black boxes. Black arrows mark single disseminated cells, while yellow arrows label disseminated cell clusters. Scale bar, 50 μm. (e) DIC micrographs depicting possible alternate phenotypes of tumor organoids in 3D collagen I. A tumor organoid with rounded or “branched” invasion strands (e1). A tumor organoid with no invasion strands (e2). A tumor organoid that died during the course of the culture (e3). A tumor organoid that made contact with the coverslip. Black box zoom-in depicts the difference between the 3D vs 2D regions of the structure (e4, Scale bar, 50μm). Stromal cells within the organoid extending a protrusion into collagen I which is zoomed into in the white box (e5, Scale bar, 50μm). Scale bar, 100 μm. (f) Primary human breast tumor organoids exhibit a wide spectrum of phenotypes in collagen I. From left to right: a non-invasive, disseminative, collectively invasive, and both invasive and disseminative organoids. Black arrows mark disseminated units. Scale bar, 100 μm.
Figure 5:
Figure 5:. 3D colony formation assay to model metastasis formation
(a) Workflow for a colony formation assay. Freshly isolated murine tumor organoids are trypsizined into a heterogeneous mixture of 1–50 cell clusters. This suspension is flow sorted to isolate single cells or 2–5 cell clusters. If single cells were isolated, they can be reaggregated overnight in a cell-repellent dish to form 2–5 cell clusters. Cell clusters are then embedded in 3D Matrigel and colony formation is assessed 7 days after culturing in the presence of FGF2. (b) Left: Single cancer cells directly embedded into Matrigel rarely form colonies. Scale bar, 100μm. A representative image of a single cell at the end of 7 days in culture is zoomed into the black box. Scale bar, 10μm. Right: Confocal images of fluorescently labeled single cells when the culture was started (top, Day 0) and at the end of 7 days in culture (bottom, Day 7). Scale bar, 10 μm. (c-d) Representative images of colonies arising from reaggregated clusters (c) or from flow sorted cell clusters (d). Scale bar, 100μm. Representative colonies are zoomed into in black boxes. Scale bar, 50μm. Confocal images of fluorescently labeled small clusters (top, Day 0) and corresponding colonies arising after culture (bottom, Day 7). Scale bar, 20 μm. (e) Workflow for tail vein injections to assess colony formation potential in vivo. Fluorescently labeled MMTV-PyMT cancer cells are trypsinized into small clusters and injected into non-fluorescent NSG host mice. Lungs from these mice are harvested after 3–4 weeks and number of metastatic colonies counted using a dissection microscope.
Figure 6:
Figure 6:. Isolation of metastatic organoids from murine and human mammary tumor-derived metastases
(a) Workflow for isolating organoids from metastatic lesions in mice. Organoids isolated from fluorescently labelled MMTV-PyMT primary tumors were trypsinized to small clusters, injected via the tail of non-fluorescent NSG mice. Lungs from these mice were harvested 4 weeks later. Fluorescently labeled metastases were micro-dissected and digested into metastatic organoids. These metastases are cultured in 3D matrices in the presence of FGF2. (b) Metastatic organoids derived from MMTV-PyMT tumors form “branched” structures in 3D Matrigel. Scale bar, 100 μm. (c) Organoids isolated from the MMTV-PyMT primary tumor invade robustly into collagen I. Scale bar, 100 μm. (d) Metastatic organoids derived from MMTV-PyMT tumors rarely invade into collagen I. This is in contrast to the primary tumor organoids they were derived from. Left: More common non-invasive phenotype. Right: Rare invasive phenotype. Scale bar, 100 μm. (e) Immunofluorescent images of a non-invasive and invasive metastatic organoids embedded in collagen I. Cells within the organoids were mTomato+ and keratin+. Scale bar, 100 μm. (f) Workflow for isolating organoids from surgical specimens of metastatic lesions from breast cancer patients. Isolated organoids are cultured in 3D matrices in the presence of EGF as a growth factor. (g) Representative images of primary human metastatic organoids isolated from various sites. Most of these metastatic organoids remain non-invasive in collagen I. Scale bar, 100 μm.
Figure 7:
Figure 7:. Downstream applications of 3D organotypic cultures – immunofluorescence, protein isolation, and FACS
(a) Workflow for performing immunofluorescence in 3D cultured organoids. After fixation, organoids in 3D gels such as Matrigel and collagen can either be saved for immunofluorescence in-gel or embedded in O.C.T. to cryosection. Permeabilization, blocking, and antibody staining is then performed on organoids in 3D gels or cryosections. (b) Representative immunofluorescent images of organoids embedded in 3D Matrigel or collagen I. Left to right (green): F-actin, phosphohistone-H3, E-cadherin, pan-cytokeratin, and keratin-14. (c) Workflow for isolating 3D embedded organoids from Matrigel or collagen I gels prior to protein extraction or FACS. Organoids embedded in Matrigel are isolated using PBS-EDTA, while those in collagen are isolated using PBS-collagenase. (d) Representative Western blots for various proteins using lysates from organoids embedded in Matrigel (left) and collagen I (right). (e) Representative histogram demonstrating successful recovery of cells for FACS from organoids embedded in 3D ECM gel. Live/ dead assessment is based on PI staining.
Figure 8:
Figure 8:. Application of methods to multiple model and organ systems
(a) Transgenic mice were developed to express Myc under the control of liver-specific Liver Activator Protein. LAP drives the expression of a tetracycline transactivator (tTA), which is in the ‘OFF’ state in the presence doxycycline (Dox). Upon withdrawal of Dox, tTA binds to the tetracycline operator (tetO) in the promoter region to drive the expression of Myc. These mice develop localized HCC. Representative primary tumor from a mouse is shown. The tumor is mechanically and enzymatically digested to generate organoids. Organoids are cultured in a 3D matrix in the presence of EGF as a growth factor. (b) Murine HCC tumor organoids in Matrigel do not disseminate. Scale bar, 100 μm. (c) Murine HCC tumor organoids in collagen-I displaying collective cell invasion. Scale bar, 100 μm. (d) Micrograph of a subcutaneously passaged triple negative breast PDX tumor isolated from an NSG mouse. The tumor is mechanically and enzymatically digested to generate organoids. Organoids are cultured in a 3D matrix in the presence of 2% serum. (e) Organoids from breast PDX tumors commonly grow with non-invasive borders when embedded in 3D Matrigel (left). In rare cases, organoids can have several cells disseminate into the surrounding matrix. Arrows mark disseminated cells (right). Scale bar, 100 μm. (f) Organoids isolated from a breast PDX tumor typically grows and remains non-invasive in 3D collagen I (left). In rare cases, organoids can invade collectively into the surrounding matrix (right). Scale bar, 100 μm. (g) Micrograph of a subcutaneously passaged pancreatic adenocarcinoma PDX tumor isolated from a NSG mouse. The tumor is mechanically and enzymatically digested to generate organoids. Organoids are cultured in a 3D matrix in the presence of serum. (h) PDAC PDX tumor organoids grow with a non-invasive border in 3D Matrigel. Scale bar, 100 μm. (i) PDAC PDX tumor organoids display a high level of rotational movement and motility but typically remain non-invasive in 3D collagen I (left). In rare cases, organoids can invade collectively or exhibit a single-file invasion strands (right). Scale bar, 100 μm.

References

    1. Nelson CM & Bissell MJ Of extracellular matrix, scaffolds, and signaling: tissue architecture regulates development, homeostasis, and cancer. Annu Rev Cell Dev Biol 22, 287–309, doi:10.1146/annurev.cellbio.22.010305.104315 (2006). - DOI - PMC - PubMed
    1. Simian M et al. The interplay of matrix metalloproteinases, morphogens and growth factors is necessary for branching of mammary epithelial cells. Development 128, 3117–3131 (2001). - PMC - PubMed
    1. Ewald AJ Practical considerations for long-term time-lapse imaging of epithelial morphogenesis in three-dimensional organotypic cultures. Cold Spring Harb Protoc 2013, 100–117, doi:10.1101/pdb.top072884 (2013). - DOI - PubMed
    1. Nguyen-Ngoc K-V et al. ECM microenvironment regulates collective migration and local dissemination in normal and malignant mammary epithelium. Proc Natl Acad Sci USA 109, E2595–2604 (2012). - PMC - PubMed
    1. Ewald AJ et al. Mammary collective cell migration involves transient loss of epithelial features and individual cell migration within the epithelium. J Cell Sci 125, 2638–2654, doi:10.1242/jcs.096875 (2012). - DOI - PMC - PubMed

Publication types