. 2020 Sep;23(9):1168-1175.
doi: 10.1038/s41593-020-0668-9. Epub 2020 Jul 20.

SPARC enables genetic manipulation of precise proportions of cells

Affiliations

SPARC enables genetic manipulation of precise proportions of cells

Jesse Isaacman-Beck et al. Nat Neurosci. 2020 Sep.

Abstract

Many experimental approaches rely on controlling gene expression in select subsets of cells within an individual animal. However, reproducibly targeting transgene expression to specific fractions of a genetically defined cell type is challenging. We developed Sparse Predictive Activity through Recombinase Competition (SPARC), a generalizable toolkit that can express any effector in precise proportions of post-mitotic cells in Drosophila. Using this approach, we demonstrate targeted expression of many effectors in several cell types and apply these tools to calcium imaging of individual neurons and optogenetic manipulation of sparse cell populations in vivo.


Conflict of interest statement

Competing Interests statement: The authors declare no competing financial interests.

Figures

Extended Data Figure 1
Extended Data Figure 1. SPARC development cassettes.
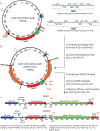
(a,b) Schematics of PhiC31-dependent UAS-inversion effector constructs. (a) control construct with canonical attP sites and (b) truncated 34bp_attP experimental construct. (c-d”) 34bp_attP-Inversion-GCaMP6f expression (green, c,d) in Mi1 neurons (magenta, c’-d’) counterstained with anti-Bruchpilot (Brp; blue, overlay c”-d”). Fewer Mi1 neurons are labeled at day two post eclosion (c-c”) than at day six post eclosion (d-d”). (e) Schematic of the LexA-OR-Flp expression construct. PhiC31 recombines one of two competing attP target sequences with one attB target sequence to enable either LexA or Flp expression. Reaction 1 leads to LexA expression. Reaction 2 leads to Flp expression. (f-f”) Flp-enabled mCD8::GFP expression (green, f) or LexA-driven myr::tdTomato expression in Mi1 neurons (magenta, f’) counterstained with anti-Bruchpilot (Brp; blue, overlay f”). n = 10 optic lobes per genotype. Scale bar: 10μm.
Extended Data Figure 2
Extended Data Figure 2. Plasmid maps and molecular cloning methods for SPARC and SPARC2 constructs.
(a) Map of pHD-3xP3-DsRed-ΔattP (a CRISPR-HDR-donor precursor) showing multiple cloning sites for homology arm insertion (right). (b) Map of pHD-3xP3-DsRed-ΔattP-CRISPR-donor (example includes homology arms targeting the attP40 region of the Drosophila genome). (c) SPARC and SPARC2 cassettes are inserted into pHD-3xP3-DsRed-ΔattP-CRISPR-donor via unique KpnI, NdeI, or BsiWI restriction enzyme sites. SalI restriction enzyme sites in the SPARC2 module allow for one-step swapping of the effector and terminator to generate pHD-SPARC2 donor plasmids. Abbreviations: MCS – multiple cloning site; gRNA – guide RNA; HDVR – hepatitis delta virus ribozyme sequence.
Extended Data Figure 3
Extended Data Figure 3. SPARC-GCaMP6f expression in Kenyon cells.
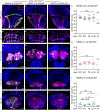
(a-d) Anterior view of the Drosophila central brain showing GCaMP6f expression (green) in Kenyon cells (magenta) counterstained with anti-Bruchpilot (Brp; blue). (a) SPARC-D-GCaMP6f, no PhiC31. (b) SPARC-D-GCaMP6f. (c) SPARC-I-GCaMP6f. (d) SPARC-S-GCaMP6f. (e-h”) GCaMP6f expression (green, e-h) in Kenyon cell bodies (magenta, e’-h’) with overlay (e”-h”). (e-e”) SPARC-D-GCaMP6f, no PhiC31. GCaMP6f is not detected in Kenyon Cells in the absence of PhiC31. (f-f”) SPARC-D-GCaMP6f. (g-g”) SPARC-I-GCaMP6f. (h-h”) SPARC-S-GCaMP6f. Scale bars: 30μm (a-d), 10μm (e-h”). n > 10 brains per condition from three independent experiments.
Extended Data Figure 4
Extended Data Figure 4. SPARC and SPARC2 user guide.
(a) Important notes regarding SPARC and SPARC2 use and stock maintenance. (b) Example crossing schemes for SPARC or SPARC2 to allow expression of effectors.
Figure 1:
Figure 1:. Schematic description of the SPARC method.
(a) Schematic of the SPARC cassette. PhiC31 recombines one of two competing attP target sequences with one attB target sequence. Progressively truncating the first attP favors retention of the stop cassette, preventing expression of effector (Dense (D): 60bp, canonical sequence; Intermediate (I): 38bp; Sparse (S): 34bp). Rxn 1 describes the cassette rearrangement that produces effector expression. Rxn 2 describes the cassette rearrangement that fails to produce effector expression. (b) Table illustrating how PhiC31 and Gal4 expression in a cell can impact the SPARC cassette and SPARC effector expression. Effector expression occurs only in cells that express both PhiC31 and Gal4 and in which Rxn 1 occurs. (c) Schematic of SPARC effector expression in cell populations. PhiC31 expressed from nSyb-PhiC31 recombines the SPARC cassettes in all cells, rendering Gal4/UAS expression of the effector possible (Rxn 1; open green circle) or not possible (Rxn 2; open black circle) in three predictable proportions depending on the sequence of the first attP in the SPARC cassette (D, I, S). Gal4 is expressed in either all of these neurons (Pan-Neuronal Gal4) or a subset of these neurons (Cell-Specific Gal4) but can only drive effector expression (closed green circle) in the stochastic subset of cells in which SPARC Rxn 1 has occurred. Because the SPARC reaction is stochastic, different animals (Animal 1, Animal 2) will express effector in different subsets of cells within the Gal4 pattern.
Figure 2:
Figure 2:. The SPARC toolkit enables predictable expression of effectors at three levels.
(a) Schematic of the Drosophila optic lobe highlighting T4, T5, and Mi1. (b-e) GCaMP6f expression (green) in T4 and T5 neurons counterstained with anti-Bruchpilot (Brp, synaptic protein; blue). (b) SPARC-S-GCaMP6f, no PhiC31. (c) SPARC-D-GCaMP6f. (d) SPARC-I-GCaMP6f. (e) SPARC-S-GCaMP6f, arrow points to dendrite shown in inset. n > 10 optic lobes per genotype, observed in three independent experiments. (f) Schematic of the SPARC2 cassette including the 2X hepatitis delta virus ribozyme (HDVR) sequence. (g-k) LexA::p65-driven expression of myr::tdTomato (green, g-k), in Mi1 neurons (magenta, g’-k’) counterstained with anti-Bruchpilot (Brp; blue, overlay, g”-k”). (g) SPARC-I-LexA::p65, no PhiC31. (h) SPARC2-I-LexA::p65, no PhiC31. (i) SPARC2-D-LexA::p65. (j) SPARC2-I-LexA::p65. (k) SPARC2-S-LexA::p65. Scale bars: 10μm. n > 10 optic lobes per condition, observed in three independent experiments.
Figure 3:
Figure 3:. SPARC2 labels precise proportions of neurons across a diverse set of cell types.
(a-o) SPARC2-mCD8::GFP expression (green) in different neuron populations (magenta) counterstained with anti-Bruchpilot (Brp; blue). SPARC2-D-mCD8::GFP, SPARC2-I-mCD8::GFP, and SPARC2-S-mCD8::GFP in the following cell types (a-c) T4 and T5 neurons, (d-f) Mi1 neurons, (g-i) olfactory projection neurons (PNs) in the GH146-Gal4+ population, (j-l) LC20 neurons, and (m-o) HS neurons. (p-r) Percentage of neurons labeled by different SPARC2 modules. (p) SPARC2-D-mCD8::GFP (black circles). (q) SPARC2-I-mCD8::GFP (magenta circles). (r) SPARC2-S-mCD8::GFP (green circles). n = 10 optic lobes or antenna lobes per genotype, from two independent experiments; bars indicate mean value. Scale bars: 10μm (a-i) or 15μm (j-o). ns = not significant (1-way ANOVA); * = p = 0.03 (Mi1 vs. LC20) and *** p = 0.0002 (Mi1 vs. T4T5) or p = 0.0003 (Mi1 vs. PN; two-sided Student’s t-test). Within a cell type, all differences between D, I, and S variants are statistically significant (p<0.0001, two-sided Student’s t-test). We excluded HS from statistical analyses (see \ Methods).
Figure 4:
Figure 4:. SPARC2 stochastically labels different subsets of neurons in each animal.
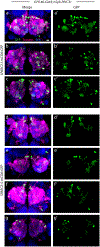
(a-g) SPARC2-mCD8::GFP expression (green) in olfactory PNs targeted by GH146-Gal4 (magenta; myr::tdTomato reporter) counterstained with anti-Bruchpilot (Brp; blue). (a-c’) SPARC2-I-mCD8::GFP and (d-g’) SPARC2-S-mCD8::GFP. 7 brains shown, representative of n = 10 brains per genotype. Scale bar: 10μm.
Figure 5:
Figure 5:. SPARC enables calcium imaging of single neurons.
(a,b) Normalized averaged fluorescence intensity of GCaMP6f in T5 dendrites sparsely labeled using (a) SPARC-S-GCaMP6f or (b) FlpOut-Gal80-enabled expression. Arrows point to dendrites. n = 8 experiments (c,d) GCaMP6f fluorescence responses (ΔF/F0) of T5 dendritic ROIs to sinusoidal gratings moving in one of eight different directions. PD denotes the preferred direction of each cell with the angular deviation from PD in degrees (c) Averaged responses of a representative ROI expressing GCaMP6f using SPARC-S-GCaMP6f (green) or FlpOut-Gal80-enabled expression (black). n = 8 experiments (d) Normalized tuning curves averaged across all T5 dendritic ROIs. n = 8 flies and 37 units per condition, center values indicate means, error bars show one standard deviation from the mean. (e) Direction-selectivity indices (DSI) for each T5 dendritic ROI. n = 8 flies and 37 units per condition; ***p = 3.75E-10 (two-tailed Student’s t-test), bars represent the mean. Scale bar: 10μm.
Figure 6:
Figure 6:. SPARC2 enables optogenetic stimulation of sparse cell populations.
(a) Schematic of the central complex and ellipsoid body depicting SPARC2-labeled R2 ring neurons. (b) SPARC2-D-CsChrimson::tdTomato-3.1 expression (tdTomato; green) in R2 neurons (mCD8::GFP; magenta) counterstained with anti-Bruchpilot (Brp; blue). Image is representative of five individual brains stained from two independent experiments (c-c”) Closeup of cell bodies on the right in (b) showing (c) CsChrimson expression in (c’) R2 cells. (c”) Overlay. (d) Current-clamp recordings of single tdTomato+ (top) and tdTomato (bottom) R2 neurons. Stimulus is a 50-ms pulse of green light (vertical bar); 10 trials each (colored lines), mean response (black line). (e) Average evoked response (open circles) and mean population response (line) of R2 neurons, both tdTomato+ (green, n = 4) and tdTomato (magenta, n = 3); each neural recording (d,e) was an independent experiment. Scale bars: 20μm.

References

    1. Luo L, Callaway EM & Svoboda K Genetic Dissection of Neural Circuits: A Decade of Progress. Neuron 98, 256–281 (2018). - PMC - PubMed
    1. Duffy JB GAL4 system in Drosophila: a fly geneticist’s Swiss army knife. Genesis 34, 1–15 (2002). - PubMed
    1. Golic KG & Lindquist S The FLP recombinase of yeast catalyzes site-specific recombination in the Drosophila genome. Cell 59, 499–509 (1989). - PubMed
    1. Sauer B & Henderson N Site-specific DNA recombination in mammalian cells by the Cre recombinase of bacteriophage P1. PNAS 85, 5166–5170 (1988). - PMC - PubMed
    1. Yeh E, Gustafson K & Boulianne GL Green fluorescent protein as a vital marker and reporter of gene expression in Drosophila. PNAS 92, 7036–7040 (1995). - PMC - PubMed

Publication types

LinkOut - more resources