

COVID-19 and Inequity: a Comparative Spatial Analysis of New York City and Chicago Hot Spots
- PMID: 32691212
- PMCID: PMC7371785
- DOI: 10.1007/s11524-020-00468-0
COVID-19 and Inequity: a Comparative Spatial Analysis of New York City and Chicago Hot Spots
Abstract
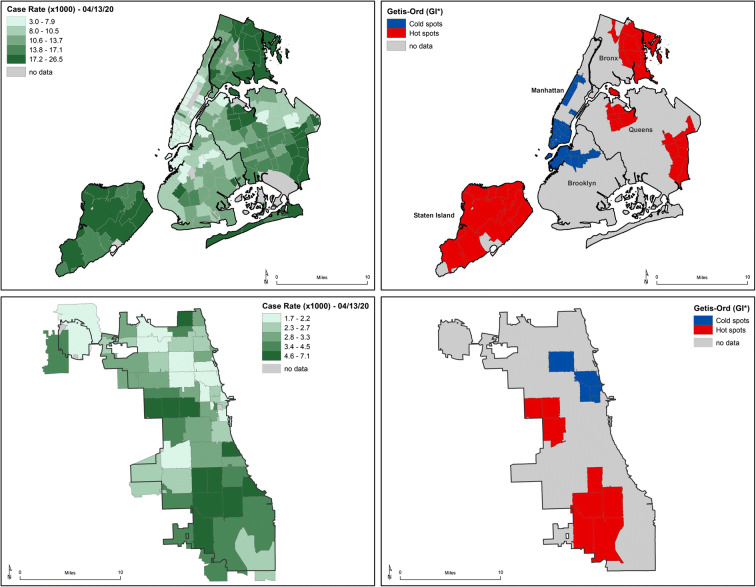
There have been numerous reports that the impact of the ongoing COVID-19 epidemic has disproportionately impacted traditionally vulnerable communities associated with neighborhood attributes, such as the proportion of racial and ethnic minorities, migrants, and the lower income households. The goal of this ecological cross-sectional study is to examine the demographic and economic nature of spatial hot and cold spots of SARS-CoV-2 rates in New York City and Chicago as of April 13, 2020 using data from the New York City Department of Health and Mental Hygiene, Illinois Department of Public Health, and the American Community Survey. In both cities, cold spots (clusters of low SARS-CoV-2 rate ZIP code tabulation areas as identified by the Getis-Ord (GI*) statistic) demonstrated social determinants of health characteristics typically associated with better health outcomes and the ability to maintain physical distance ("social distancing"). These neighborhoods tended to be wealthier, have higher educational attainment, higher proportions of non-Hispanic white residents, and more workers in managerial occupations (all p values < 0.01 using Wilcoxon two-sample test). Hot spots (clusters of high SARS-CoV-2 rate ZIP code tabulation areas) had similarities as well, such as lower rates of college graduates and higher proportions of people of color. It also appears that household size (more people per household), rather than overall population density (people per square mile), is more strongly associated with hot spots. New York City had an average of 3.0 people per household in hot spots and 2.1 in cold spots (p < 0.01), and Chicago had 2.8 people per household in hot spots and 2.0 in cold spots (p = 0.03). However, hotspots were located in neighborhoods that were significantly less dense (New York City: 22,900 people per square mile in hot spots and 68,900 in cold spots (p < 0.01); Chicago: 10,000 people per square mile in hot spots and 23,400 in cold spots (p = 0.03)). Findings suggest important differences between the cities' hot spots as well. NYC hot spots can be described as working-class and middle-income communities, perhaps indicative of greater concentrations of service workers and other occupations (including those classified as "essential services" during the pandemic) that may not require a college degree but pay wages above poverty levels. Chicago's hot spot neighborhoods, on the other hand, are among the city's most vulnerable, low-income neighborhoods with extremely high rates of poverty, unemployment, and non-Hispanic Black residents.
Keywords: COVID; Chicago; Equity; GIS; Geography; Hot spot; New York; SARS-CoV-2.
Figures

References
-
- Centers for Disease Control and Prevention. Social Distancing. 2020; https://www.cdc.gov/coronavirus/2019-ncov/prevent-getting-sick/social-di.... Accessed 5/2020.
Publication types
MeSH terms
LinkOut - more resources
Full Text Sources
Other Literature Sources
Miscellaneous
