. 2020 Nov 9;12(1):1788898.
doi: 10.1080/19490976.2020.1788898. Epub 2020 Jul 20.

TH1 cell-inducing Escherichia coli strain identified from the small intestinal mucosa of patients with Crohn's disease

Affiliations

TH1 cell-inducing Escherichia coli strain identified from the small intestinal mucosa of patients with Crohn's disease

Manabu Nagayama et al. Gut Microbes. .

Abstract

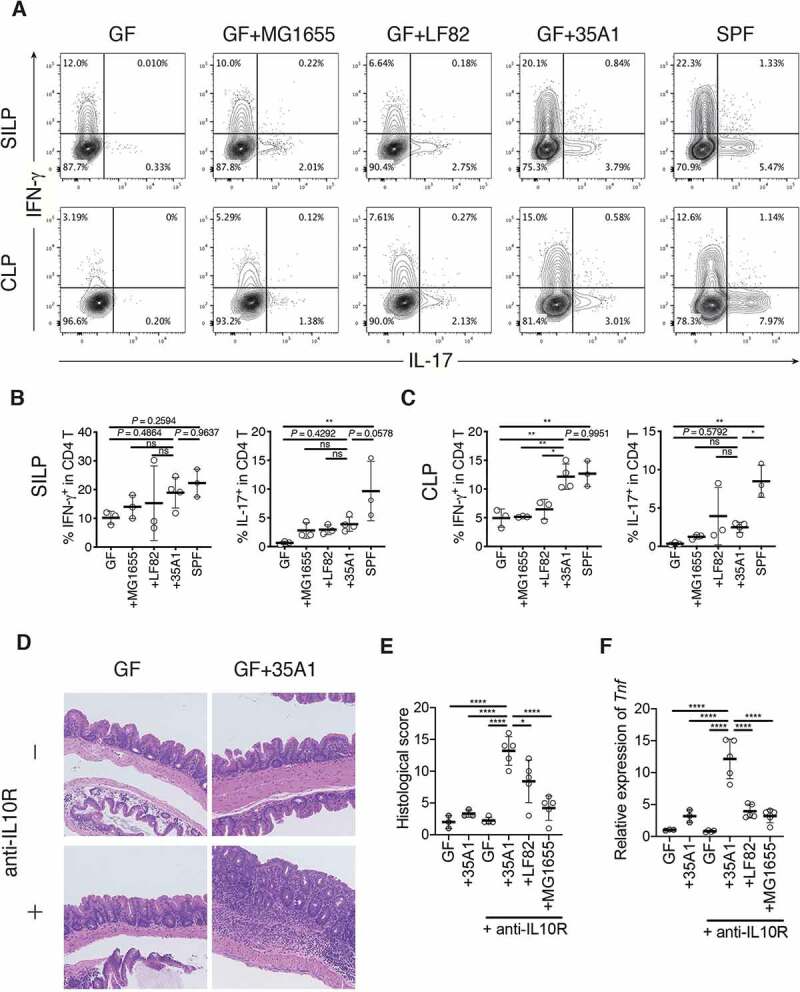
Dysbiotic microbiota contributes to the pathogenesis of Crohn's disease (CD) by regulating the immune system. Although pro-inflammatory microbes are probably enriched in the small intestinal (SI) mucosa, most studies have focused on fecal microbiota. This study aimed to examine jejunal and ileal mucosal specimens from patients with CD via double-balloon enteroscopy. Comparative microbiome analysis revealed that the microbiota composition of CD SI mucosa differs from that of non-CD controls, with an increased population of several families, including Enterobacteriaceae, Ruminococcaceae, and Bacteroidaceae. Upon anaerobic culturing of the CD SI mucosa, 80 bacterial strains were isolated, from which 9 strains representing 9 distinct species (Escherichia coli, Ruminococcus gnavus, Klebsiella pneumoniae, Erysipelatoclostridium ramosum, Bacteroides dorei, B. fragilis, B. uniformis, Parabacteroides distasonis, and Streptococcus pasteurianus) were selected on the basis of their significant association with CD. The colonization of germ-free (GF) mice with the 9 strains enhanced the accumulation of TH1 cells and, to a lesser extent, TH17 cells in the intestine, among which an E. coli strain displayed high potential to induce TH1 cells and intestinal inflammation in a strain-specific manner. The present results indicate that the CD SI mucosa harbors unique pro-inflammatory microbiota, including TH1 cell-inducing E. coli, which could be a potential therapeutic target.

Keywords: Escherichia coli; Ruminococcus gnavus; Crohn’s disease; TH1; TH17; double-balloon enteroscopy; microbiome.


Figures

Figure 1.
Figure 1.
Unique microbiota structure in the small intestinal (SI) mucosa of Crohn’s disease (CD) patients. (a) Schematic representation of specimens obtained from the SI via double-balloon enteroscopy. 16S rRNA gene sequencing analyses were conducted (CD; n = 27, non-CD; n = 17). (b) Alpha-diversity indices of the SI microbiota. (c) Bray-Curtis distance-based non-metric multidimensional scaling (NMDS) plot of SI samples and permutational multivariate analysis of variance (PERMANOVA) statistics between CD (red) and non-CD samples (blue). (d-f) Relative abundance of bacterial taxa at the phylum (d) and the family level (e, f) of the SI microbiota. (f) Statistical comparison between CD patients with (green) and without (red) intestinal stricture(s). Each bar in (B) and the thick bar in (D-F) represent the mean values of groups. Each point in (b-f) represents an individual sample. Error bar, SD. P or FDR value * < 0.05; ** < 0.01; *** < 0.001; **** < 0.0001, unpaired Student’s t-test (B), multiple t-tests with false discovery rate (FDR) approach (D-F).
Figure 2.
Figure 2.
Taxa that were enriched in the small intestinal (SI) mucosa of Crohn’s disease (CD) patients. (a) A histogram of the LDA scores computed for differentially abundant taxa between CD and non-CD subjects. (b) A histogram of the false discovery rate (FDR) calculated by comparing SI samples between CD and non-CD. Only significant taxa (FDR < 0.05) are shown. (c) Venn diagram of 18 CD-enriched bacteria identified via three computational analyses. (d) Relative abundance of E. coli and R. gnavus in mucosal specimens and intestinal juice. (e) Relative abundance of E. coli and R. gnavus in the saliva, SI, and feces. (f) SI microbiota composition of each sample was determined via 16S rRNA sequencing. Operational taxonomic units (OTUs) significantly enriched in CD patients are marked in warm colors, those enriched in non-CD controls are in blue, and those without significant differences are indicated in gray. (g) A list of the 9 strains isolated from CD SI samples. Their closest species and percentage similarity (%) in the National Center for Biotechnology Information (NCBI) database are indicated. Each thick bar in (d, e) represents the mean of a group. Each point in (D, E) represents an individual sample. Error bar, SD. *P < .05; **P < .01, LEfSe (A), multiple t-tests with FDR approach (B), unpaired Student’s t-test (D, E).
Figure 3.
Figure 3.
Induction of intestinal TH1 cells by Crohn’s disease (CD)-associated bacteria and the E. coli strain. (a) Representative flow cytometry plots of small intestinal (upper) and colonic (lower) lamina propria (SILP and CLP) CD4+ TCRβ+ T cells (CD4 T cells). Germ-free (GF) C57BL/6 (B6) mice were orally inoculated with a mixture of 9 CD-enriched strains (9-mix) and euthanized after 3 weeks. (b) Percentage of IFN-γ+ and IL-17+ cells among small intestinal (upper) and colonic (lower) LP CD4 T cells. (c) Representative flow cytometry plots of colonic LP CD4 T cells. (d) Percentage of IFN-γ+ and IL-17+ cells among DR3-positive and DR3-negative CD4 T cells. (e) Representative flow cytometry plots of colonic LP CD4 T cells. GF B6 mice were orally inoculated with a mixture of CD-derived R. gnavus and E. coli strains (2-mix) or with either of them individually. (f) Percentage of IFN-γ+ and IL-17+ cells among colonic LP CD4 T cells. Each point in (B, D, F) represents an individual mouse. Each thick bar in (B, D, F) represents the mean of a group. Error bar, SD. *P < .05; **P < .01; ***P < .001; ****P < .0001, one-way ANOVA with Tukey’s post hoc test (b, f), two-way ANOVA with Bonferroni’s post hoc test (D).
Figure 4.
Figure 4.
Strain-dependent induction of TH1 cells and intestinal inflammation by E. coli 35A1. (a) Representative flow cytometry plots of small intestinal (upper) and colonic (lower) lamina propria (SILP and CLP) CD4 T cells. Germ-free (GF) C57BL/6 (B6) mice were orally inoculated with CD-derived E. coli 35A1, E. coli LF82, or E. coli MG1655 strain and euthanized after 3 weeks. (b, c) Percentage of IFN-γ+ and IL-17+ cells among SI (b) and colonic (c) LP CD4 T cells. (d-f) Representative hematoxylin and eosin staining (d), histological colitis scores of the cecum (e), and relative expression of Tnf mRNA in the scraped colonic epithelium (f) of E. coli 35A1-, LF82-, or MG1655-monocolonized colitis model mice. GF wild-type B6 mice were colonized with each E. coli strain on day 1, followed by weekly intraperitoneal injections with anti-mouse IL10 R antibody (1 mg/body) from day 1 until the end of the experiment. Each point in (B, C, E, F) represents an individual mouse. Each thick bar in (B, C, E, F) represents the mean of a group. Error bar, SD. *P < .05; **P < .01; ns, not significant (P > .05), one-way ANOVA with Tukey’s post hoc test.

References

    1. Yamazaki K, McGovern D, Ragoussis J, Paolucci M, Butler H, Jewell D, Cardon L, Takazoe M, Tanaka T, Ichimori T, et al. Single nucleotide polymorphisms in TNFSF15 confer susceptibility to Crohn’s disease. Hum Mol Genet. 2005;14(22):3499–14. PMID: 16221758. doi:10.1093/hmg/ddi379. - DOI - PubMed
    1. Franke A, McGovern DP, Barrett JC, Wang K, Radford-Smith GL, Ahmad T, Lees CW, Balschun T, Lee J, Roberts R, et al. Genome-wide meta-analysis increases to 71 the number of confirmed Crohn’s disease susceptibility loci. Nat Genet. 2010;42(12):1118–1125. PMID: 21102463. doi:10.1038/ng.717. - DOI - PMC - PubMed
    1. Liu JZ, van Sommeren S, Huang H, Ng SC, Alberts R, Takahashi A, Ripke S, Lee JC, Jostins L, Shah T, et al. Association analyses identify 38 susceptibility loci for inflammatory bowel disease and highlight shared genetic risk across populations. Nat Genet. 2015;47(9):979–986. PMID: 26192919. doi:10.1038/ng.3359. - DOI - PMC - PubMed
    1. Kostic AD, Xavier RJ, Gevers D.. The microbiome in inflammatory bowel disease: current status and the future ahead. Gastroenterology. 2014;146(6):1489–1499. PMID: 24560869. doi:10.1053/j.gastro.2014.02.009. - DOI - PMC - PubMed
    1. Pascale A, Marchesi N, Marelli C, Coppola A, Luzi L, Govoni S, Giustina A, Gazzaruso C. Microbiota and metabolic diseases. Endocrine. 2018;61(3):357–371. PMID: 29721802. doi:10.1007/s12020-018-1605-5. - DOI - PubMed

Publication types

Supplementary concepts