. 2020 Dec;9(1):1748-1760.
doi: 10.1080/22221751.2020.1799723.

Dysregulation in Akt/mTOR/HIF-1 signaling identified by proteo-transcriptomics of SARS-CoV-2 infected cells

Affiliations

Dysregulation in Akt/mTOR/HIF-1 signaling identified by proteo-transcriptomics of SARS-CoV-2 infected cells

Sofia Appelberg et al. Emerg Microbes Infect. 2020 Dec.

Abstract

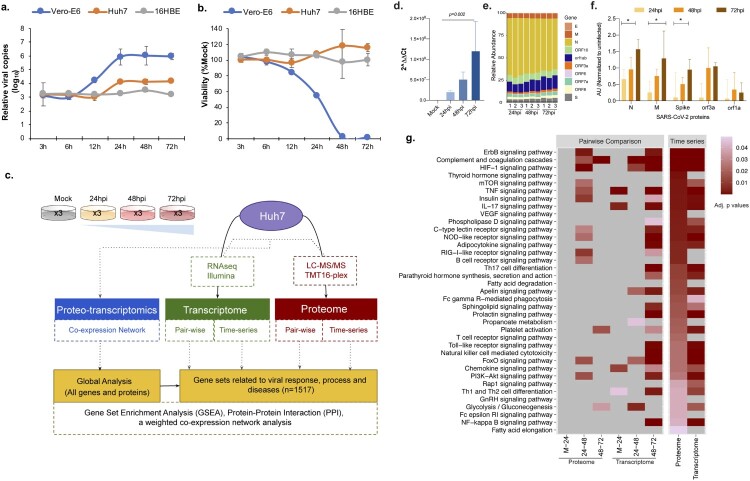
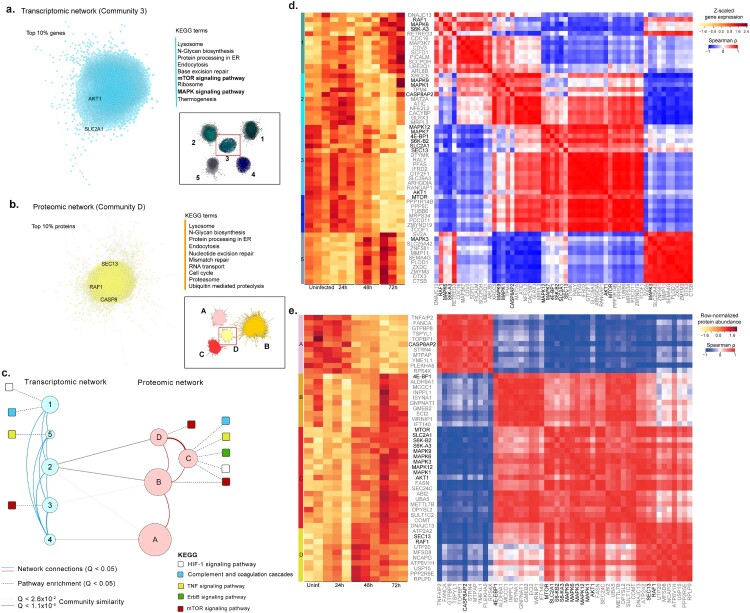
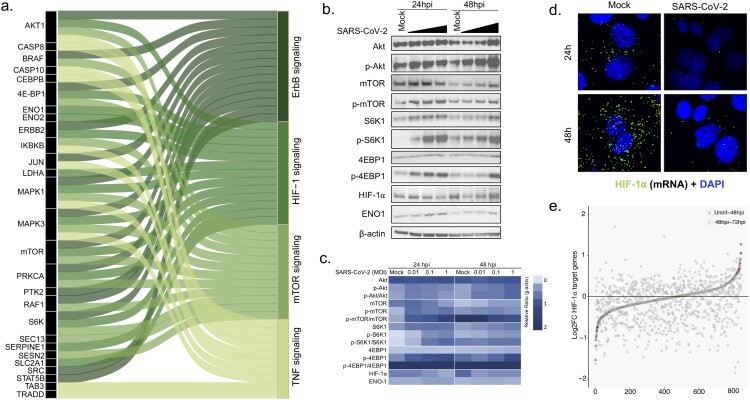
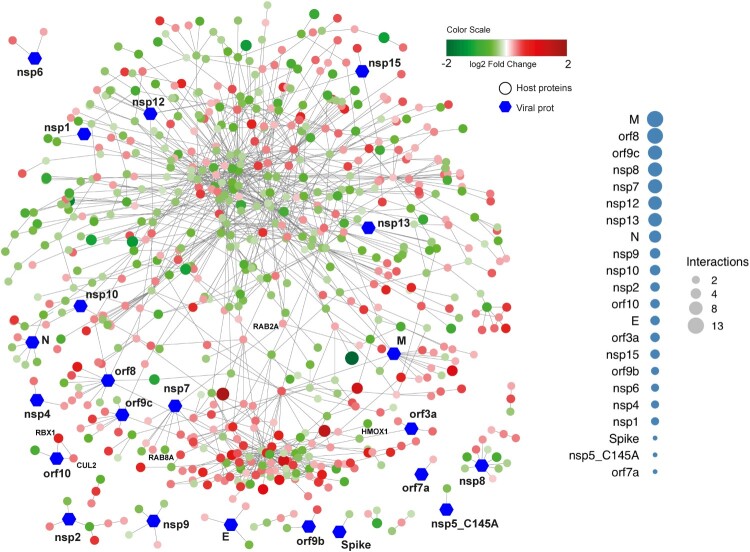
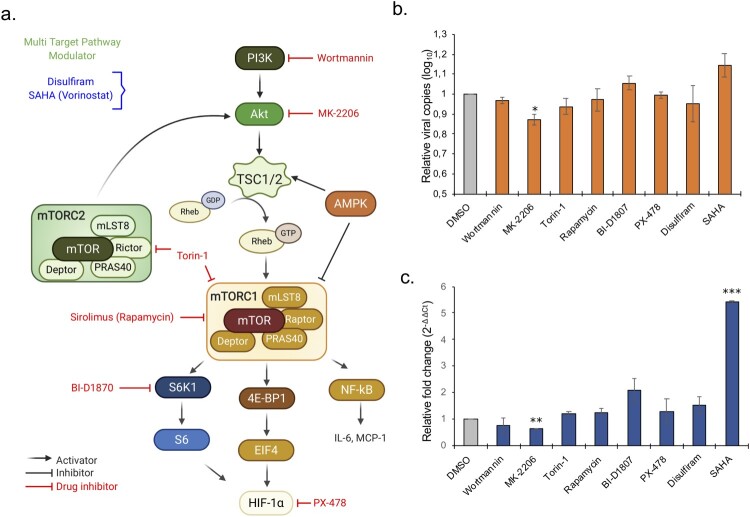
How severe acute respiratory syndrome coronavirus-2 (SARS-CoV-2) infections engage cellular host pathways and innate immunity in infected cells remains largely elusive. We performed an integrative proteo-transcriptomics analysis in SARS-CoV-2 infected Huh7 cells to map the cellular response to the invading virus over time. We identified four pathways, ErbB, HIF-1, mTOR and TNF signaling, among others that were markedly modulated during the course of the SARS-CoV-2 infection in vitro. Western blot validation of the downstream effector molecules of these pathways revealed a dose-dependent activation of Akt, mTOR, S6K1 and 4E-BP1 at 24 hours post infection (hpi). However, we found a significant inhibition of HIF-1α through 24hpi and 48hpi of the infection, suggesting a crosstalk between the SARS-CoV-2 and the Akt/mTOR/HIF-1 signaling pathways. Inhibition of the mTOR signaling pathway using Akt inhibitor MK-2206 showed a significant reduction in virus production. Further investigations are required to better understand the molecular sequelae in order to guide potential therapy in the management of severe coronavirus disease 2019 (COVID-19) patients.

Keywords: Akt/mTOR/HIF-1; MK-2206; SARS-CoV-2; proteomics; transcriptomics.


Conflict of interest statement

No potential conflict of interest was reported by the author(s).

Figures

Figure 1.
Figure 1.
Infection dynamics and proteo-transcriptomics in Huh7 cell line. (a) Vero-E6, Huh7 and 16HBE cell lines were challenged with SARS-CoV-2 at 1 MOI. Viral supernatant samples were harvested at 3 h post infection (hpi), 6hpi, 12hpi, 24 hpi, 48hpi and 72hpi. Viral load was determined by quantitative RT-PCR targeting the N gene of SARS-CoV-2. The viral load at each time point was compared with baseline viral load at 3hpi. (b) The cell viability at each time point was measured by viralToxGlo assay. The viability at each time was determined in comparison to the uninfected control. (c) Brief methodology of the omics experiments. (d) Viral RNA quantification in the Huh7 infected cells using qPCR targeting the E gene of SARS-CoV-2. (e) Detected viral genes and open reading frame in the RNAseq experiment. (f) Temporal dynamics of detected proteins in the Huh7 cells by tandem mass tag-labelled mass spectrometry (TMT-MS). (g) Gene set enrichment analysis using the genes related to viral response, process and diseases in single omics level by pairwise comparative analysis and time series analysis at individual omics level. Significant (adjusted p values) KEGG terms enriched for upregulated genes are represented as heatmap. The lower adjusted p values are shown in dark red color and higher ones with light red color, non-significant pathways are represented in grey color.
Figure 2.
Figure 2.
Network analysis using genes and proteins. Analysis of the most central communities in each network highlights key KEGG terms (right) among the top 10% associated genes and proteins. The top 10% correlations (Spearman rho > 0.95, FDR < 0.05) were selected in the most central community in transcriptomic (a) and proteomic (b) networks (inset) based on mean normalized degree. The top KEGG terms associated with each of the two communities (FDR < 0.05) are highlighted, as well as genes that had been previously found in Figure 1(g). (c) A proteo-transcriptomic network analysis highlights coordinated expression and functional changes in response to viral infection. Communities (circles) in transcriptomic and proteomic networks, where node size is proportion to the number of elements (728 - 2519). Edges indicate association (Q<0.05) with KEGG terms (dashed), network edges (solid red and blue), or community similarity (solid gray). (d) Gene expression and co-expression among key genes and top correlated and central genes in each community identified based on a transcriptomic network (communities 1-5). (e) Protein abundance (A) and correlations (B – C) among key proteins and top correlated and central proteins in each community identified based on a proteomic network (communities A-D). For each community we identified selected the top ten genes (grey labels), ranked by their median centrality (median ranked degree, betweenness, closeness and eccentricity centralities), among the top 10% correlated gene in each community. Key proteins, previously associated with HIF-1α, mTOR, MAPK signaling and other top pathways, are highlighted in black (Figure 1(g)). Spearman rank correlations were computed for all genes and excluded if not statistically significant (Figure S2, FDR < 0.01).
Figure 3.
Figure 3.
SARS-CoV-2 modulates Akt-mTOR-HIF signaling. (a) Top four pathways, ErbB signaling, HIF-1 signaling, mTOR signaling and TNF signaling were selected and, together with proteins that are altered in the infection course, represented as Sankey Plot in order to illustrate the most important contribution to the flow of each pathway. (b) Huh7 cells were infected with SARS-CoV-2 at MOI of 0.01, 0.1 and 1 and cells were harvested at 24hpi and 48hpi. The representative western blots with indicated antibodies are shown. (c) A heatmap with the densitometric protein quantification is shown. All the MOI’s at each timepoint were normalized to β-actin. (d) HIF-1α m-RNA transcripts were visualized using RNAscope in mock infected and SARS-CoV-2 infected (MOI 1) Huh7 cells at 24hpi and 48hpi. (d) Graph showing upregulation and downregulation of HIF-1α target genes at 48hpi to 72hpi in the transcriptomics data as a measure of fold change. Significantly upregulated and downregulated genes are marked in red and green respectively.
Figure 4.
Figure 4.
Network visualizing protein interactions among significantly changing proteins between samples at 24hpi and 48hpi, and SARS-CoV-2 viral proteins. Green color nodes represent decreased proteins at 48hpi and red colored proteins represent increased proteins at 48hpi. Size of the nodes are relative to their log2 fold change. Hexagonal shaped nodes denote SARS-CoV-2 viral proteins. The edges are derived from Human Reference Interactom (HuRI) and SARS-CoV-2 entry in Human Protein Atlas.
Figure 5.
Figure 5.
Repurposing of approved drugs targeting Akt/mTOR/HIF-1 signaling pathway. (a) Schematic representation of Akt-mTOR-HIF-1 signaling. Only key proteins of the pathway and the inhibitors (red) and modulators (blue) used in the study are shown. (b-c) Antiviral assay for the inhibitors and modulators was performed in duplicates. (b) The bar graph shows relative viral copies compared to mock infection in the supernatant after 24 hpi. (c) The bar graph shows relative fold change of viral RNA based on the Ct-values in the cellular RNA after 24 hpi.

References

    1. Dong E, Du H, Gardner L.. An interactive web-based dashboard to track COVID-19 in real time. Lancet Infect Dis. 2020 Feb 19;20(5):533–534. - PMC - PubMed
    1. Zhou P, Yang XL, Wang XG, et al. . A pneumonia outbreak associated with a new coronavirus of probable bat origin. Nature. 2020 Mar;579(7798):270–273. - PMC - PubMed
    1. Wu F, Zhao S, Yu B, et al. . A new coronavirus associated with human respiratory disease in China. Nature. 2020 Mar;579(7798):265–269. - PMC - PubMed
    1. Rohde C, Becker S, Krahling V.. Marburg virus regulates the IRE1/XBP1-dependent unfolded protein response to ensure efficient viral replication. Emerg Microbes Infect. 2019;8(1):1300–1313. - PMC - PubMed
    1. Monteil V, Kwon H, Prado P, et al. . Inhibition of SARS-CoV-2 infections in engineered human tissues using clinical-grade soluble human ACE2. Cell. 2020 May 14;181(4):905–913.e7. - PMC - PubMed

MeSH terms