. 2020 Nov;41(16):4529-4548.
doi: 10.1002/hbm.25139. Epub 2020 Jul 21.

Ex vivo mesoscopic diffusion MRI correlates with seizure frequency in patients with uncontrolled mesial temporal lobe epilepsy

Affiliations

Ex vivo mesoscopic diffusion MRI correlates with seizure frequency in patients with uncontrolled mesial temporal lobe epilepsy

Justin Ke et al. Hum Brain Mapp. 2020 Nov.

Abstract

The role of hippocampal connectivity in mesial temporal lobe epilepsy (mTLE) remains poorly understood. The use of ex vivo hippocampal samples excised from patients with mTLE affords mesoscale diffusion magnetic resonance imaging (MRI) to identify individual cell layers, such as the pyramidal (PCL) and granule cell layers (GCL), which are thought to be impacted by seizure activity. Diffusion tensor imaging (DTI) of control (n = 3) and mTLE (n = 7) hippocampi on an 11.7 T MRI scanner allowed us to reveal intra-hippocampal connectivity and evaluate how epilepsy affected mean (MD), axial (AD), and radial diffusivity (RD), as well as fractional anisotropy (FA). Regional measurements indicated a volume loss in the PCL of the cornu ammonis (CA) 1 subfield in mTLE patients compared to controls, which provided anatomical context. Diffusion measurements, as well as streamline density, were generally higher in mTLE patients compared to controls, potentially reflecting differences due to tissue fixation. mTLE measurements were more variable than controls. This variability was associated with disease severity, as indicated by a strong correlation (r = 0.87) between FA in the stratum radiatum and the frequency of seizures in patients. MD and RD of the PCL in subfields CA3 and CA4 also correlated strongly with disease severity. No correlation of MR measures with disease duration was evident. These results reveal the potential of mesoscale diffusion MRI to examine layer-specific diffusion changes and connectivity to determine how these relate to clinical measures. Improving the visualization of intra-hippocampal connectivity will advance the development of novel hypotheses about seizure networks.

Keywords: biomarker; connectivity; diffusion mri; epilepsy; hippocampus; mesoscale; surgical resection; tractography.


Conflict of interest statement

The authors have no personal financial or institutional interest in the results described in this article.

Figures
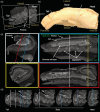
FIGURE 1
FIGURE 1
High resolution MR imaging of a whole healthy human hippocampus. (a) Visualization of the three axes of a 100 μm isotropic mean diffusion (MD) image. (b) Photograph of excised hippocampal sample and delineation of the tail, body and head regions. (c) Coronal and saggital sections of the hippocampus reveal signal differences between cell layers with the granule cell layer being more hyperintense than other regions. The stratum oriens (SO) and alveus are easily discernible in the saggital plane. (d) Anterior–posterior comparison of coronal slices
FIGURE 2
FIGURE 2
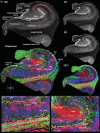
Diffusion MR imaging and regional connectivity. (a) Scalar indices consisting of mean diffusion (MD), axial diffusion (AD) and radial diffusion (RD) define cell layers, such as the granule cell layer (GCL) of the dentate gyrus (DG), as well as the pyramidal cell layer (PCL) that can be sub‐divided in cornu ammonis (CA) 1–4 regions. Tractography of the sample and diffusion encoded color (DEC) images of the fractional anisotropy (FA) further reveal fiber connections between different cell layers. (b) Tractography affords a further dimension of anatomical information that is not discernable from scalar index images that affords the assessment of intra‐hippocampal connectivity. (c) A detailed view of connections, including Mossy fibers and Schaeffer collalerals, afford a system's analysis between different hippocampal layers and regions
FIGURE 3
FIGURE 3
Diffusion MR imaging of control and epileptic hippocampi. (a) MR imaging of hippocampal samples excised from patients with intractable epilepsy poses several challenges. Typically, only the tail region of the excised sample was available for the imaging study, hence limiting the regional evaluation of pathology. Surgical manipulation can also induced injury that leads to small bleeds (green arrow). These hypointense spots are excluded from defining a region of interest. In other cases, blood vessels can produce a hyperintense signal that reflects the presence of freely moving liquid through these (red arrows). Epileptic samples can also contain different levels and types of pathology. A hyperintense region can indicate surgical trauma, but can also be due to reactive gliosis (blue arrows). Anatomical malformations can also be evident (orange asterix). (b) As only the posterior body or tail is typically available for imaging studies, the sample size was approximately a third of the control samples (individual data points represent each subject, line reflects the group mean). For this reason, in control samples only the posterior body and tail region was included for analysis. Samples with a volume of <800 mm3 were excluded from the study, as this portion of the tail typically only afforded a delineation of the dentate gyrus and did not allow a robust comparison between controls and patients. (c) The mean diffusivity (MD) of the patients' samples was higher than controls. (d) The streamline density in epileptic samples was denser than in controls with a mean difference of 13 streamlines/mm3
FIGURE 4
FIGURE 4
Defining regions of interest (ROIs) in human hippocampi. (a) Delineation of anatomical landmarks on mean diffusion (MD) images is achieved based on signal contrast. The granule cell layer (GCL) of the dentate gyrus (DG) is very hyperintense and affords easy delineation. This segementation further defines the stratum moleculare (SM) and the polymorphic cell layer of the hilus. The hippocampal sulcus further divides the S.M. The stratum radiatum (SR) is hypointense and can be separate from the more isointense SM and the pyramidal cell layer (PCL). The PCL can be divided in subfields defining cornu ammonis (CA) 1–4. Size measurements highlight the need for a high resolution with the GCL measuring merely 0.2 mm, that is, two voxels. (b) An overlay between color‐coded MD (blue) and fractional anistropic (red) images can further aid in refining individual cell layers as contrast is more clearly defined for some regions (e.g., SR). (c) CA1‐4 subfields were defined based on anatomical markers. Specifically, the end of the hippocampal sulcus defined the start of CA1. The start of CA2 was specified at the half way point of the external limb of the GCL. The start of CA3 coincided with the apex of the PCL and extended to the end of the external limb of the GCL. CA4 extended from this point into the hilus, but was contrasted with the polymorphic layer that was more hyperintense. The polymorphic layer and GCL in addition to the SM along the hippocampal sulcus were defined as the DG. (d) The stratum oriens (SO) was defined as the thin hypointense layer overlaying the PCL along the CA1‐CA2 regions. Overlaying this thin layer was the more isointense alveus that extended into the subiculum. The SR was a more hypointense region adjacent to the PCL. The SM was more isointense than the SR. The stratum lacunare (SL) was not robustly distinguished and is considered to be part of the region defined as SM here
FIGURE 5
FIGURE 5
Comparisons of regional volumes and scalar indices. (a) Coronal MR images and scalar maps of a control and epileptic hippocampus. In the epileptic hippocampus a hyperintense region (*) is evident in all scans that is due to tissue damage and reactive gliosis. The diffusion encoded color (DEC) image reflects direction of primary diffusion within a voxel encoded by color. (b) Regional volume, T2 signal intensity, mean diffusivity (MD), axial diffusivity (AD), radial diffusivity (RD) and fractional anisotropy (FA). Variability of measurements on FA were equivalent between groups, but variability in MD, AD, and RD was much higher in epileptic samples (individual data points represent each subject, line reflects the group mean)
FIGURE 6
FIGURE 6
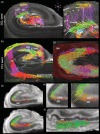
Hippocampal connectivity. (a) Tractography on the hippocampal samples revealed fiber tracts connecting different regions. (b) Perpendicular streamlines emanating from the pyramidal cell layer form connections with deeper seated layers. (c) Streamlines from seeds in different regions indicated more fibers in epileptic samples compared to controls (individual data points represent each subject, line reflects the group mean). Variability in epileptic samples was higher compared to controls. (d) To account for potential differences in regional volumes between both experimental groups, streamline density was calculated. CA1, SM and SR exhibited a higher streamline density in cases with epilepsy
FIGURE 7
FIGURE 7
Regional connectivity. (a) A seed in the granule cell layer (GCL) revealed connections to the CA4 pyramidal cell layer (PCL), as well as to the CA2. Streamlines to CA2 span connections between multiple cell layers. Although some connections terminated within the appropriate cell layer (white *), tracing did not consistently terminate in the stratum moleculare (SM) (*), or PCL (*). (b) Seeding in the PCL uncovered an extensive network of connections. Notably, the performant path (PP), alveus, CA1‐CA3 connections, Schaeffer collaterals of the PCL, as well as GCL to CA4 (Mossy fibers) and CA3 projections. (c) Axonal projections from the the GCL formed aberrant connections that terminated in the SM (region defined by semi‐transparent red outline) and could produce reverberant excitatory networks that drive seizure activity. (d) A closer visualziation of streamlines across at different slice positions with greater contrast between the GCL (seed) and SM (terminal region) further highlight individual streamlines crossing from the GCL to the SM in a perpendicular direction to the GCL. (e) Higher magnification images demontrate how streamlines from the GCL fan into the SM. Most streamlines are short connections that terminate early in the SM, but a few penetrate deeper into the cell layer. Deeper penetration are mostly at the arch of the GCL rather than in the internal or external limb. (f) A sagittal view of the GCL‐SM connectivity indicates that these streamlines cover the entire length of these layers, rather than being confined to a small portion
FIGURE 8
FIGURE 8
Quantitating regional connectivity. Comparisons between control and epileptic samples revealed a systems view of hippocampal connectivity between seed and terminative regions of interest (individual data points represent each subject, line reflects the group mean)
FIGURE 9
FIGURE 9
Correlations between disease burden and MRI measures. (a) Age is negatively correlated (*p < .05) with streamline density (individual data points represent each subject). Older subjects have reduced axonal projections in CA3, GCL, SM, SR and SO. Age is therefore a major co‐variate with older subjects. (b) The severity of epilepsy, as indicated by seizure frequency, correlated highly with FA, particularly in the SR,as well as CA1 and SO (*p < .05; **p < .01). (c) The correlation matrix detailing r values between ROIs and volume uses a colorimetric scale to indicate the strength and direction of correlation (warm to cold). The strongest correlation (r = 0.95) was found between GCL and SM, but strong correlations were also evident for CA1‐CA2, CA1‐SR, CA1‐SO, CA2‐SR and CA2‐SO. Weaker, but significant, correlations were also evident for CA3 with CA1, CA2 and CA4. (r values in white p < .05, FDR in orange square q < 0.05). (d) The volumetric correlations also translate into correlations of streamline density between these ROIs with GCL being strongly correlated with SM. CA1 and CA2 streamline density was also strongly correlated with SR and SO. CA1 and CA2 subfields were also highly correlated with each other, but showed a weaker association with CA3. The pattern of streamline density in CA3 and CA4 were also significantly correlated

Similar articles

Cited by

References

    1. Adler, D. H. , Pluta, J. , Kadivar, S. , Craige, C. , Gee, J. C. , Avants, B. B. , & Yushkevich, P. A. (2014). Histology‐derived volumetric annotation of the human hippocampal subfields in postmortem MRI. NeuroImage, 84, 505–523. 10.1016/j.neuroimage.2013.08.067 - DOI - PMC - PubMed
    1. Adler, D. H. , Wisse, L. E. M. , Ittyerah, R. , Pluta, J. B. , Ding, S. L. , Xie, L. , … Yushkevich, P. A. (2018). Characterizing the human hippocampus in aging and Alzheimer's disease using a computational atlas derived from ex vivo MRI and histology. Proceedings of the National Academy of Sciences of the United States of America, 115(16), 4252–4257. 10.1073/pnas.1801093115 - DOI - PMC - PubMed
    1. Alizadeh, M. , Kozlowski, L. , Muller, J. , Ashraf, N. , Shahrampour, S. , Mohamed, F. B. , … Sharan, A. (2019). Hemispheric regional based analysis of diffusion tensor imaging and diffusion tensor tractozgraphy in patients with temporal lobe epilepsy and correlation with patient outcomes. Scientific Reports, 9(1), 215 10.1038/s41598-018-36818-x - DOI - PMC - PubMed
    1. Bao, Y. , He, R. , Zeng, Q. , Zhu, P. , Zheng, R. , & Xu, H. (2018). Investigation of microstructural abnormalities in white and gray matter around hippocampus with diffusion tensor imaging (DTI) in temporal lobe epilepsy (TLE). Epilepsy & Behavior, 83, 44–49. 10.1016/j.yebeh.2017.12.002 - DOI - PubMed
    1. Bartsch, T. (2012). The clinical neurobiology of the hippocampus: An integrative view. Oxford, UK: Oxford University Press.

Publication types