. 2020 Jul 21:9:e55963.
doi: 10.7554/eLife.55963.

Molecular determinants of large cargo transport into the nucleus

Affiliations

Molecular determinants of large cargo transport into the nucleus

Giulia Paci et al. Elife. .

Abstract

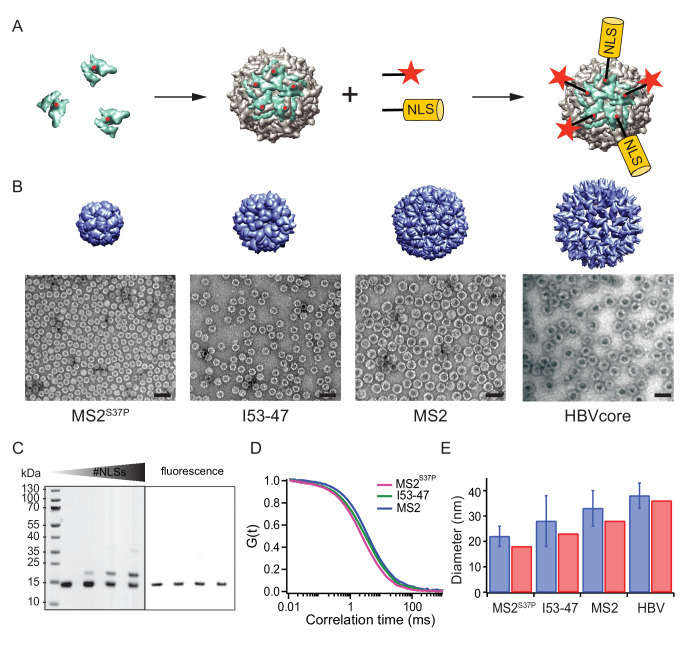
Nucleocytoplasmic transport is tightly regulated by the nuclear pore complex (NPC). Among the thousands of molecules that cross the NPC, even very large (>15 nm) cargoes such as pathogens, mRNAs and pre-ribosomes can pass the NPC intact. For these cargoes, there is little quantitative understanding of the requirements for their nuclear import, especially the role of multivalent binding to transport receptors via nuclear localisation sequences (NLSs) and the effect of size on import efficiency. Here, we assayed nuclear import kinetics of 30 large cargo models based on four capsid-like particles in the size range of 17-36 nm, with tuneable numbers of up to 240 NLSs. We show that the requirements for nuclear transport can be recapitulated by a simple two-parameter biophysical model that correlates the import flux with the energetics of large cargo transport through the NPC. Together, our results reveal key molecular determinants of large cargo import in cells.

Keywords: E. coli; NLS; capsid; cell biology; human; import kinetics; large cargo; molecular biophysics; nuclear transport; permeabilized cells; structural biology.

Plain language summary

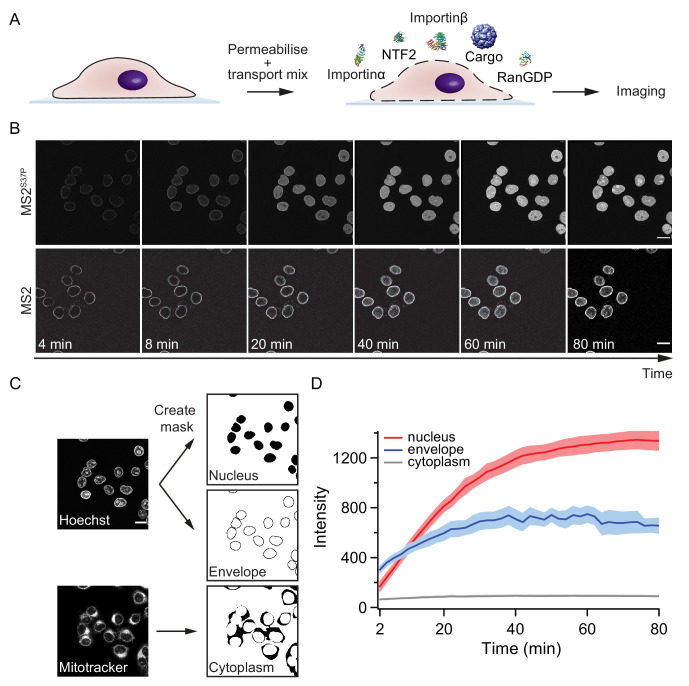
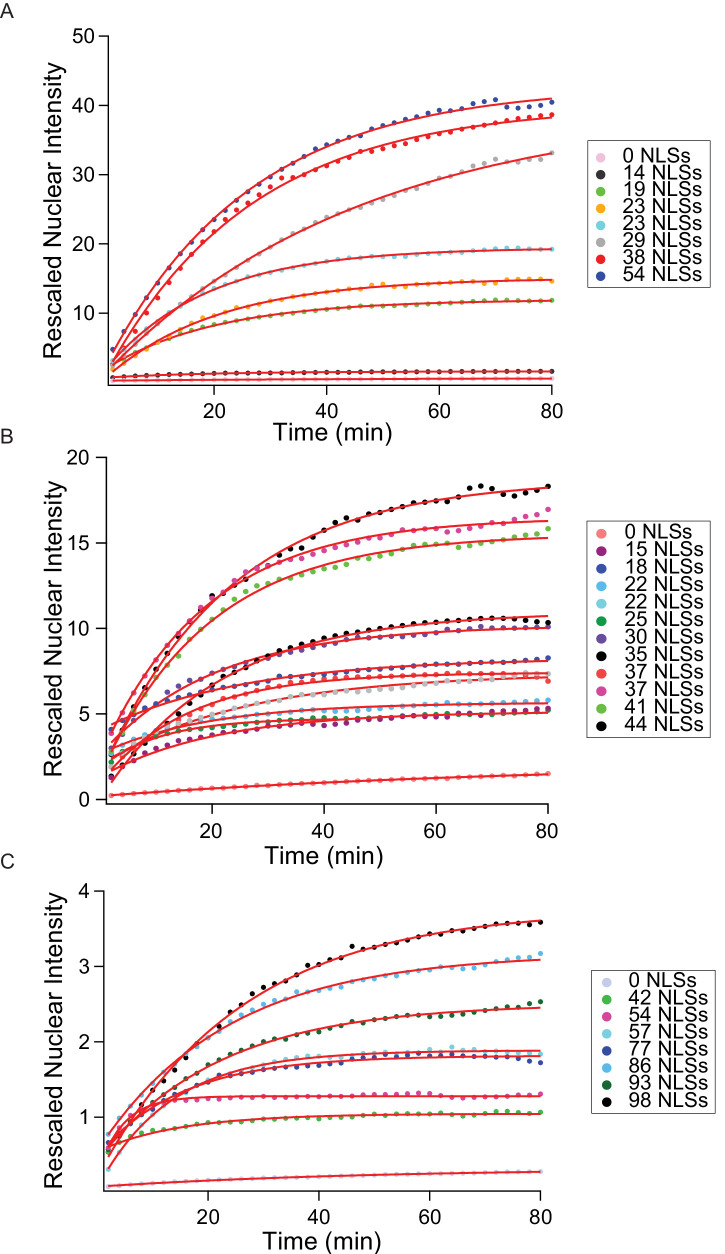
Eukaryotes, such as animals, plants and fungi, store the genetic material within their cells inside a specific compartment called the nucleus. Surrounding the nucleus is a protective membrane which molecules must pass across in order to reach the cell’s DNA. Straddling the membrane are nuclear pore complexes, or NPCs for short, which act as the gatekeepers to the nucleus, shuttling thousands of different molecules back and forth whilst restricting access to others. Large cargoes need to have specific markers on their surface called nuclear localization signals in order to be transported by NPCs. Certain transporter proteins help the NPC carry large molecules across the membrane by binding to these signals. This generates the energy needed to overcome the barrier of transporting it across the membrane. Some viruses have nuclear localization signals of their own, which can exploit this transport system; these signals allow the virus to enter the nucleus and hijack the genetic machinery of the cell. It has been suggested that viruses have multiple copies of these surface signals to improve their chances of reaching the nucleus. However, it remained unclear how the number of nuclear localization signals affects the transport of large molecules into the nucleus. To answer this question, Paci et al. engineered a range of different sized particles derived from viral structures which had varying numbers of nuclear localization signals on their surface. These particles were inserted into human cell lines grown in the laboratory, and imaged to see how they were transported into the nucleus. The rate of nuclear transport was then measured for each particle, and this data was used to create a mathematical model. Paci et al. found that the larger the cargo, the more nuclear localization signals it needed to be efficiently transported across the membrane into the nucleus. This is because inserting big cargoes into the NPC requires more energy. Therefore, by increasing the number of surface signals transporter proteins can bind to, larger molecules are able to interact with the NPC and generate the energy required for crossing. These findings improve our current understanding of how nuclear transport could be hijacked by viruses. It could also help scientists who are developing targeted nanoparticles to deliver therapies for genetic conditions to the nucleus.


Conflict of interest statement

GP, TZ, JC, AZ, EL No competing interests declared

Figures

Figure 1.
Figure 1.. A large cargo ‘toolkit’ for nuclear import studies.
(A) Schematic representation of the mixed labelling reaction with maleimide reactive NLS peptide and maleimide reactive fluorescent dye. The capsid protein, containing a cysteine mutation (in red), self-assembles into a capsid. The purified capsids are then labelled with a mixture of dye and NLS peptide, in different ratios according to the desired reaction outcome. (B) Capsid structures rendered in Chimera (Pettersen et al., 2004) (top) and EM images of the purified capsids (bottom). The scale bar corresponds to 50 nm. (C) SDS-PAGE gel of MS2S37P samples with increasing number of NLS peptides attached (top band). The lower band corresponds to a capsid protein tagged with dye or no dye, but 0 NLS. The upper band corresponds always to the capsid protein without any dye, but NLS, as evident from the fluorescent scan on the right side. (D) Representative FCS autocorrelation curves for the MS2S37P, I53-47 and MS2 capsids. The curves were fitted with a diffusion model to calculate the capsid brightness and concentration. (E) DLS quantification of capsid diameters (blue bars) compared with reference values from literature and structural information (red bars).
Figure 1—figure supplement 1.
Figure 1—figure supplement 1.. I53-50 capsid.
Analog to main text Figure 1 (A) shows I53-50 capsid structures rendered in Chimera (Pettersen et al., 2004) (left) and EM image of the purified sample (right). The scale bar corresponds to 50 nm. (B) SDS-PAGE gel of I53-50 capsids labelled with Alexa647. The different columns correspond to fractions from the main peak of the size exclusion column. Note, how fluorescent labelling is observed in both chain A (top band) and chain B (bottom band), while the labelling aimed only to label an inserted reactive cysteine residue in chain B. This labelling ambiguity could result in an inaccurate estimate of the #NLSs coupled to the capsid surface, therefore this capsid was excluded from further analysis.
Figure 2.
Figure 2.. Pipeline for import kinetic experiments.
(A) Scheme of the transport assay experiment: HeLa cells were permeabilised and incubated with a transport mix containing the cargo of interest, nuclear transport receptors and energy. Confocal images were acquired in 12 different areas every 2 min, for 80 min in total. (B) Representative time-lapse snapshots of cargo import (MS2S37P and MS2 capsids). The scale bar corresponds to 20 μm. (C) Overview of the image analysis pipeline for import kinetics experiments. Two reference stain images (Hoechst and MitoTracker) were segmented and used to generate three masks corresponding to the regions of interest: nucleus, nuclear envelope and cytoplasm. The masks were then applied to the cargo images to calculate the average intensity in the different regions. (D) Representative raw import kinetics traces for the three cellular compartments of interest. Note that imaging starts after 2 min of adding the transport mix to the cells. Curves depict the average fluorescence measured in the different regions; the shaded areas represent the standard deviation over 12 areas.
Figure 2—figure supplement 1.
Figure 2—figure supplement 1.. Control experiments in permeabilised cells.
In order to validate the transport assays in permeabilised cells, we performed several control experiments to rule out the possibility that the measured kinetics were for example influenced by depletion of components in the transport mix during the course of the experiment. Panel A shows a comparison of the same MS2S37P sample measured in normal conditions, with a fivefold excess of Importinα, with a twofold excess of GTP and with addition of an energy regeneration system to the transport mix (0.1 mM ATP, 4 mM creatine phosphate and 20 U/ml creatine kinase). For all cases, capsid import did not change substantially compared to the typical variability in these experiments (the shaded area represents the standard deviation of intensity over 12 different areas acquired). In order to further exclude issues with recycling of transport mix components over time, we purified CAS (the protein responsible for shuttling Importinα back into the cytoplasm [Sun et al., 2013]) and tested its effect on the transport of a MS2S37P sample with 23 NLSs. As can be seen in panel B, including 1 µM CAS in the transport mix, no major differences in the capsid nuclear import were observed.
Figure 2—figure supplement 2.
Figure 2—figure supplement 2.. Microinjection of capsids in live starfish oocytes.
Confocal images of starfish oocytes injected with MS2S37P, I53-47 and MS2 capsids. The plots on the right side correspond to the normalised fluorescence profiles across the nucleus (0 corresponds to the centre of the nucleus, distance in μm, dashed line on the image indicates where the profile is calculated). Note that additional dark areas in the oocyte correspond to oil droplets at the site of injection. For each capsid type, a sample without NLSs was compared with a sample with high #NLSs that showed import in permeabilised cells. Consistent with our results in permeabilised cells with HeLa cells, the efficiency of nuclear accumulation scales with cargo size. Images were taken 1–1.5 hr after injection. Scale bar 50 μm.
Figure 3.
Figure 3.. The import kinetics of large cargoes is tuned by the NLS number.
(A) Confocal images of nuclear import of the different large cargoes. Cells were incubated for up to 1.5 hr with capsids tagged with different number of NLS peptides on their surface. All cargoes displayed a distinct NLS-dependent behaviour. The scale bar corresponds to 20 μm. (B) Representative nuclear import traces for the three large cargoes labelled with increasing amount of NLS peptides. The corrected nuclear intensities are obtained by background-subtracting the raw nuclear intensities, scaling them according to capsid brightness (#dyes) estimated from FCS (Table 1) and subtracting the initial offset A determined by the mono-exponential fit, to better compare the import efficiencies. The corrected intensities are proportional to capsid concentration and allow us to compare the import efficiency of the different samples. See Figure 3—figure supplement 1 for the full dataset displayed without offsetting by A and overlaid with mono-exponential fits.
Figure 3—figure supplement 1.
Figure 3—figure supplement 1.. Entire import kinetic dataset.
Corresponding to main text Figure 3, here we show all measured kinetics for the MS2S37P (A), I53-47 (B) and MS2 (C) capsids. The traces represent the average nuclear intensity measured in 12 different areas, background-subtracted and corrected to account for the different sample brightness (#dyes estimated with FCS, see Table 1). Overlaid on top of the traces, we show the mono-exponential fits used to extract the kinetic parameters.
Figure 4.
Figure 4.. The NLS-engineered Hepatitis B capsid is not imported in the nucleus of permeabilised cells.
Following the same labelling approach as described in Figure 1, HBV capsids with up to 120 NLSs were generated (first row). In order to test capsids with a higher number of NLSs exposed on the surface, we designed two additional versions of the HBV core protein with a direct NLS insertion (total of 240 NLSs). The middle row shows a construct based on the SplitCore-SplitGFP (Walker et al., 2011), where the HBV core protein is split via artificial stop and start codons into two halves and fused to a split-GFP (GFPβ1–10 and GFPβ11), to which we further added an NLS. Once co-expressed, the two core-GFP halves self-assemble into capsid-like particles. The last row shows a construct where the NLS is inserted in the c/e1 epitope loop of the core protein (orange loop) and a cysteine mutation is introduced to perform labelling with a dye (red star). All capsids were targeted to the nuclear envelope but did not give rise to bulk nuclear accumulation in import experiments using permeabilised cells. (A) Schematic representations of the different HBV core protein constructs. (B) EM images of the purified capsids. The scale bar corresponds to 100 nm. (C) Confocal images of capsid import experiments after 1.5 hr. The scale bar corresponds to 20 μm.
Figure 5.
Figure 5.. Effect of cargo size and number of NLSs (#NLSs) on import kinetics and biophysical model.
(A) Cartoon of the determinants for large cargo import: the free energy cost of inserting a large cargo into the dense FG Nup barrier must be compensated by the binding to FG Nups via multiple NTRs (binding sites represented in orange, NTRs omitted for simplicity). The NPC scaffold structure is from EMD-8087. (B) Dependence of ΔG on the capsid size and #NLS for aRan=2. Shaded regions show one standard deviation of FR and ϵ. Fitted values for FR and ϵ are shown in Table 2. (C) Initial flux (corresponding to the slope of the kinetic curve at the initial time point) modelled as J1aRan+eFR-ϵN overlaid on the (normalised) experimental data (dots). Additional experiments with MS2S37P capsids containing additional charges are overlaid and shown as squares. Whenever independent biological replicates were available, the initial flux is calculated as an average and shown with the error extracted from the technical replicates (12 areas imaged in each experiment). In Figure 5—figure supplement 5 we show that the uncertainty between different cells imaged in a single experiment captures well the variability of independent experiments.
Figure 5—figure supplement 1.
Figure 5—figure supplement 1.. Results from biophysical model with aRan=1.
(A) Dependence of ΔG on capsid size and #NLS for aRan=1. Shaded regions show one standard deviation of FR and ϵ. (B) Initial flux modeled as J1aRan+eFR-ϵN overlaid on the (normalised) experimental data. (C) Fitted values for FR and ϵ.
Figure 5—figure supplement 2.
Figure 5—figure supplement 2.. Results from biophysical model where the data point for #NLS=0 is excluded from the fit.
(A) Dependence of ΔG on capsid size and #NLS where the data for #NLS=0 have been excluded from the fitting. (B) The flux determined by the parameters from the fits in (A) overlaid on the initial flux data. (C) Fitted values for FR and ϵ, where the data for #NLS=0 have been excluded from the fits.
Figure 5—figure supplement 3.
Figure 5—figure supplement 3.. Non-uniform distribution of FG Nups along the pore: theoretical model.
(A) The mathematical model used in the main text corresponds to the simplest case where the density of available NTR binding sites within the FG network is uniform throughout the channel (i.e. ΔG has no dependence on the position along the NPC axis). In reality, accumulating evidence indicates that the density of the FG motifs, and consequently the free energy profile, vary along the pore (Lowe et al., 2010; Tagliazucchi et al., 2013; Tu et al., 2013; Lowe et al., 2015). The top panel depicts one such experimentally motivated density profile, which includes a high density 'barrier' region of high FG Nup density at the centre of the pore (ϕ0) (which also increases the cost of insertion in this region [Ghavami et al., 2016; Tagliazucchi et al., 2013]); the low density (ϕv cytoplasmic 'docking/vestibule' region with no insertion cost (dashed line), and the transition region between the two with intermediate FG Nup density (ϕ1). In this case, the effective free energy in the central region is given by ΔG0=-ϵ0ϕ0N+FR,ϕ0 while in the transition regions the effective free energy is ΔG1=-ϵ0ϕ1N+FR,ϕ1, where ϵ0 is the 'bare' free energy of NTR interaction with an FG motif. The effective free energy in the 'vestibule' is ΔGv=-ϵ0ϕvN. The initial flux is J1aRan+2l1lTeΔG1+l0lTeΔG0+lvlTeΔGv where l0,l1,lv are the lengths of the central, peripheral and vestibule regions respectively and lT=l0+2l1+lv. Compared with the uniform model in the main text (Figure 5B), lTeΔG=2l1eΔG1+l0eΔG0+lveΔGv. Bottom panel: Red, green, blue schematically depict effective free energy profiles for N=35 for MS2S37P, I53-47, MS2 respectively. (B) Top panel: for non-uniform effective free energy, the data for all capsid sizes can be described by a single value of the bare interaction energy ϵ0. Parameter values are: l0 = 30 nm, l1 = 5 nm, lv=20nm, ϕ0 = 0.01, ϕ1 = 0.001, ϕv=0.0005, ϵ0 = 15.1 kBT. For MS2S37P: F(ϕ0) = 5.5 kBT, F(ϕ1) = 0.9 kBT; for I53-47: F(ϕ0) = 5.7 kBT, F(ϕ1) = 3.3 kBT; and for MS2 F(ϕ0) = 6.5 kBT, F(ϕ1) = 6.0 kBT. We emphasize that this density profile and the parameter values are just one possible combination consistent with the data, and the results are robust with respect to parameter choice. Bottom panel: overlay of the model with the experimental data.
Figure 5—figure supplement 4.
Figure 5—figure supplement 4.. Comparison of large cargo surface properties.
(A) Coulombic surface colouring of the three kinetically investigated capsids, generated in Chimera (Pettersen et al., 2004). The colour scale is in units of kcal/(mol*e), where e is the charge of a single electron. (B) Hydrophobicity surface colouring generated in Chimera, the colour scale refers to units in the Kyte-Doolittle hydrophobicity scale (Kyte and Doolittle, 1982).
Figure 5—figure supplement 5.
Figure 5—figure supplement 5.. Comparison of biological and technical replicates.
We show here the comparison of six independent biological replicates of the MS2S37P sample with 38 NLSs. The error bars correspond to the standard deviation between technical replicates (12 different areas images in one experiment). As the technical error already captures the variability between replicates extremely well, we averaged biological replicates when available for the different samples and took the largest technical error as the corresponding uncertainty on the initial flux.

References

    1. Adam SA, Marr RS, Gerace L. Nuclear protein import in permeabilized mammalian cells requires soluble cytoplasmic factors. The Journal of Cell Biology. 1990;111:807–816. doi: 10.1083/jcb.111.3.807. - DOI - PMC - PubMed
    1. Aramburu IV, Lemke EA. Floppy but not sloppy: interaction mechanism of FG-nucleoporins and nuclear transport receptors. Seminars in Cell & Developmental Biology. 2017;68:34–41. doi: 10.1016/j.semcdb.2017.06.026. - DOI - PMC - PubMed
    1. Asensio MA, Morella NM, Jakobson CM, Hartman EC, Glasgow JE, Sankaran B, Zwart PH, Tullman-Ercek D. A selection for assembly reveals that a single amino acid mutant of the bacteriophage MS2 coat protein forms a smaller Virus-like particle. Nano Letters. 2016;16:5944–5950. doi: 10.1021/acs.nanolett.6b02948. - DOI - PubMed
    1. Au S, Panté N. Nuclear transport of baculovirus: revealing the nuclear pore complex passage. Journal of Structural Biology. 2012;177:90–98. doi: 10.1016/j.jsb.2011.11.006. - DOI - PubMed
    1. Babcock HP, Chen C, Zhuang X. Using single-particle tracking to study nuclear trafficking of viral genes. Biophysical Journal. 2004;87:2749–2758. doi: 10.1529/biophysj.104.042234. - DOI - PMC - PubMed

Publication types

MeSH terms

Substances